


Businesses generate huge volumes of data, but making sense of it all remains the real challenge. AI data analytics changes the equation. Instead of describing what happened last month, it helps teams understand why it happened, what’s likely to come next, and what to do about it, without needing a data science background to get there.
This guide covers how AI data analytics works, where it delivers the most value across your teams, and how to get started without overhauling your existing workflows. You’ll also find a practical breakdown of what to look for when evaluating platforms, so your team can move from raw data to confident decisions faster.
Try monday agentsKey takeaways
- AI analytics goes beyond reporting: it tells you why something happened and what to do next, not just what the numbers say.
- You don’t need a data science team to get started: conversational language queries and no-code dashboards put real analysis in the hands of anyone on your team.
- AI agents do the analytical work for you: they monitor data, flag risks, and generate reports automatically, so every signal gets flagged with enough time to act.
- Start small and expand: connect your existing data sources, define 3-5 key questions, and prove value in one team before rolling out across departments.
- monday agents connects insights directly to action: alerts, deal context, and next steps all live in one workspace, taking you from “here’s what the data says” to “here’s what we’re doing.”
What is AI data analytics?
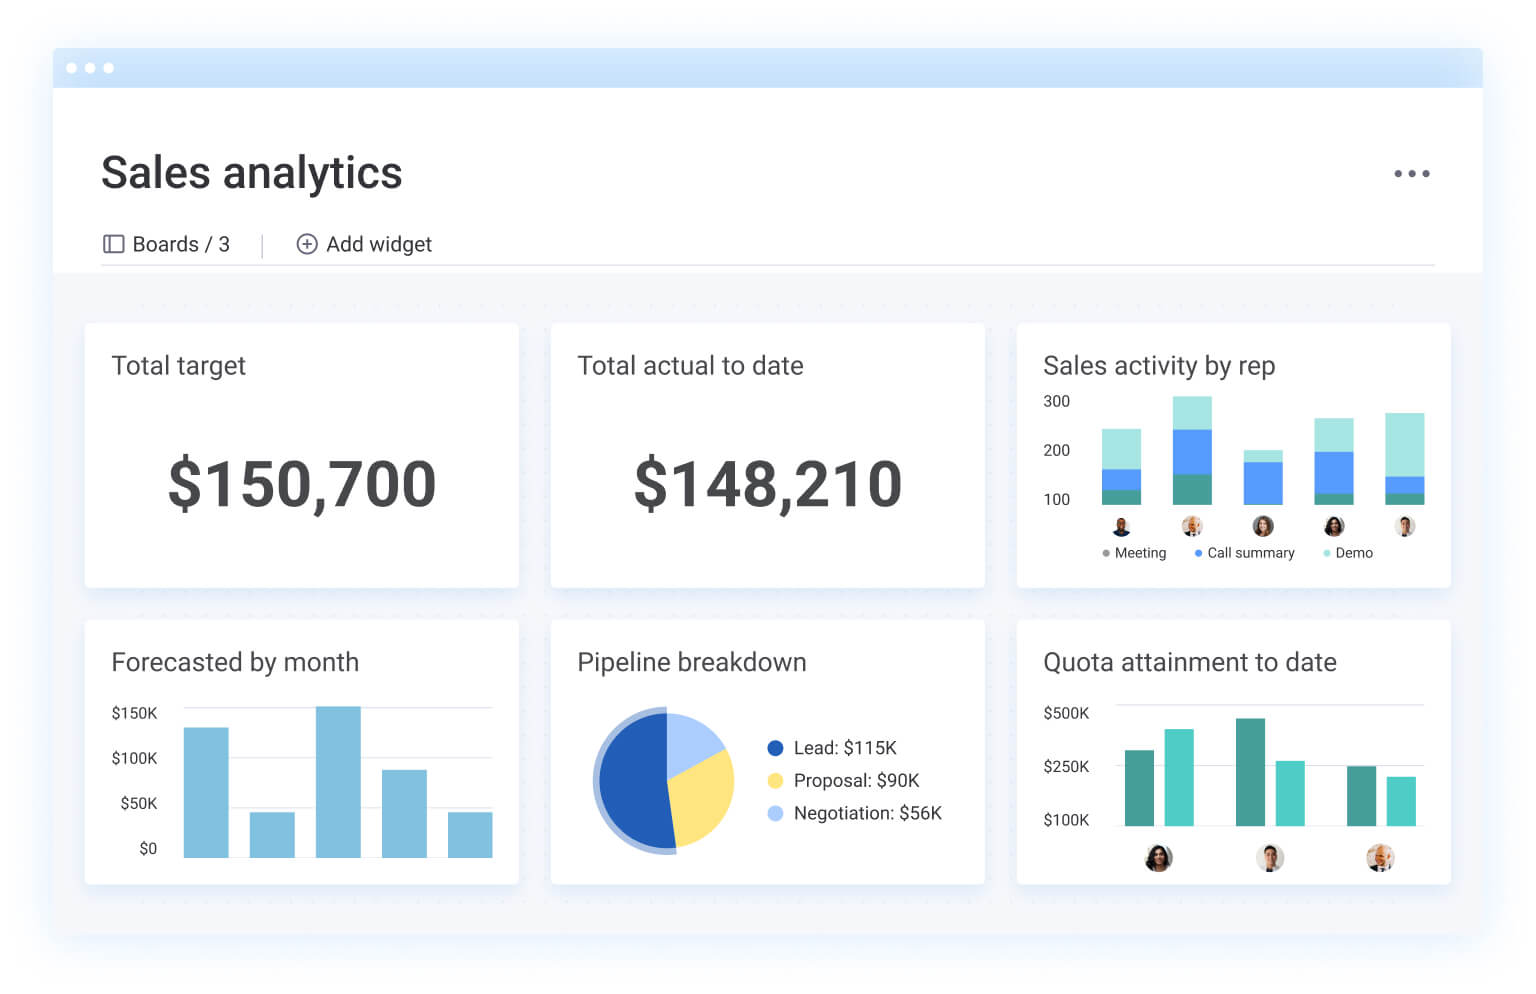
AI data analytics uses machine learning and natural language processing to automatically analyze your business data, uncover patterns, and deliver actionable insights. Unlike traditional reporting that only shows what’s already happened, AI analytics explains why it happened, predicts what’s coming next, and recommends specific actions your team should take.
This means anyone on your team—not just data analysts—can ask questions in plain language and get instant, visual answers. A sales manager can identify at-risk deals without building reports. A marketing lead can spot underperforming campaigns and get budget reallocation recommendations without writing queries. AI analytics puts data-driven decision-making directly in the hands of the people closest to your customers, deals, and projects.
How AI data analytics differs from traditional BI
Traditional business intelligence (BI) uses software to query historical data and build reports. AI data analytics builds on that foundation and extends it across several dimensions.
| Dimension | Traditional BI | AI data analytics |
|---|---|---|
| Data handling | Manual data preparation and cleaning; analysts spend hours formatting, merging, and validating data before analysis can begin | Automated ingestion, cleaning, and integration; AI detects data formats, maps fields across systems, and flags inconsistencies during collection |
| Analysis type | Descriptive: answers "what happened" through historical reports and summaries | Descriptive, diagnostic (why it happened), predictive (what will happen), and prescriptive (what to do about it) |
| User skill required | Requires analysts with SQL knowledge or specialized reporting platforms to build and maintain reports | Accessible through natural language questions; any team member can ask a question and receive a visual, understandable answer |
| Speed of insight | Hours or days to build, validate, and distribute reports | Real-time or near-instant answers drawn from live data |
| Scalability | Limited by analyst capacity; each new report or question requires human effort to produce | Scales across datasets and departments simultaneously without additional headcount |
| Adaptability | Static reports that need manual updates when business conditions change | Models that learn and improve over time as they process more data, becoming increasingly accurate |
Essentially, the historical data, reporting infrastructure, and dashboards that BI provides become the foundation that AI enhances with deeper analysis and forward-looking recommendations.
How AI enhances each stage of data analysis
Data analysis moves through 6 stages, each of which AI transforms. Knowing where AI makes the biggest difference helps you spot quick wins in your own workflows.
Stage 1: Data collection and integration
AI automates the process of pulling data from multiple sources and unifying it into a single structured format. Teams typically need to connect CRM records, marketing platforms, project management boards, email, spreadsheets, and operational databases.
Data integration (combining data from different sources so you can analyze it together) has traditionally required manual exports, imports, and field mapping. AI changes this by handling the heavy lifting automatically:
- Format detection: Automatically identifies data formats across connected systems
- Field mapping: Maps fields across platforms without manual configuration
- Inconsistency flagging: Identifies missing or conflicting entries during collection
Platforms with built-in integrations eliminate the need for manual data transfers entirely, giving AI a richer and more complete dataset to work with from the start. Connect more data sources, and AI has richer context for generating accurate insights.
Stage 2: Data preparation and cleaning
Data preparation means fixing errors, removing duplicates, filling gaps, and standardizing formats before analysis begins. This work typically eats up 60–80% of an analyst’s time.
AI automates tasks that would otherwise require hours of manual effort:
- Duplicate detection: Identifying and merging duplicate contact records before analysis begins
- Format standardization: Correcting inconsistencies in phone number formats, date styles, and naming conventions
- Outlier flagging: Identifying data points that could skew results and require review
For example, an AI system scanning a sales database can find and merge duplicate contact records before analysis begins.
Stage 3: Exploratory analysis and pattern detection
AI goes beyond simple queries to automatically find patterns, correlations, and trends that a person might miss when reviewing data manually. Pattern detection means AI scans large volumes of data to spot recurring behaviors, anomalies, or relationships between variables.
This capability turns raw data into insights you can act on. For example, AI analyzing customer purchase history alongside support ticket data might reveal that customers who contact support within their first 30 days are significantly more likely to churn.
Stage 4: Predictive modeling and forecasting
Predictive modeling takes historical data and estimates what’s likely to happen next. AI builds and continuously refines these models, making predictions increasingly precise over time.
Consider revenue forecasting. AI can project next quarter’s revenue based on:
- Current pipeline velocity
- Deal stage progression
- Historical close rates
Traditional forecasting relies on manual spreadsheet projections and gut instinct, which limits how closely projections align with actual outcomes. AI forecasting improves as it processes more data, shrinking the difference between projected and actual outcomes. Finance, sales, and operations teams can plan resources ahead of time instead of scrambling to catch up.
Stage 5: Visualization and reporting
AI transforms raw analysis into visual dashboards, charts, and narrative summaries anyone on your team can understand and act on. It can:
- Generate written summaries explaining what the data means
- Highlight the most important changes since the last report
- Automatically distribute reports to the right stakeholders on a set schedule
From here, every team member can explore data on their own.
Stage 6: Decision-making and action
AI analytics is the final and most valuable stage of the analysis process. Prescriptive analytics means AI predicts outcomes and recommends specific actions. Examples include:
- “Reassign these three at-risk deals to your top closer.”
- “Increase ad spend on this campaign by 15% based on conversion trends.”
AI data analytics lets teams make faster, more confident decisions based on evidence instead of gut feel, and take action right where the insight appears.
7 benefits of using AI for data analytics
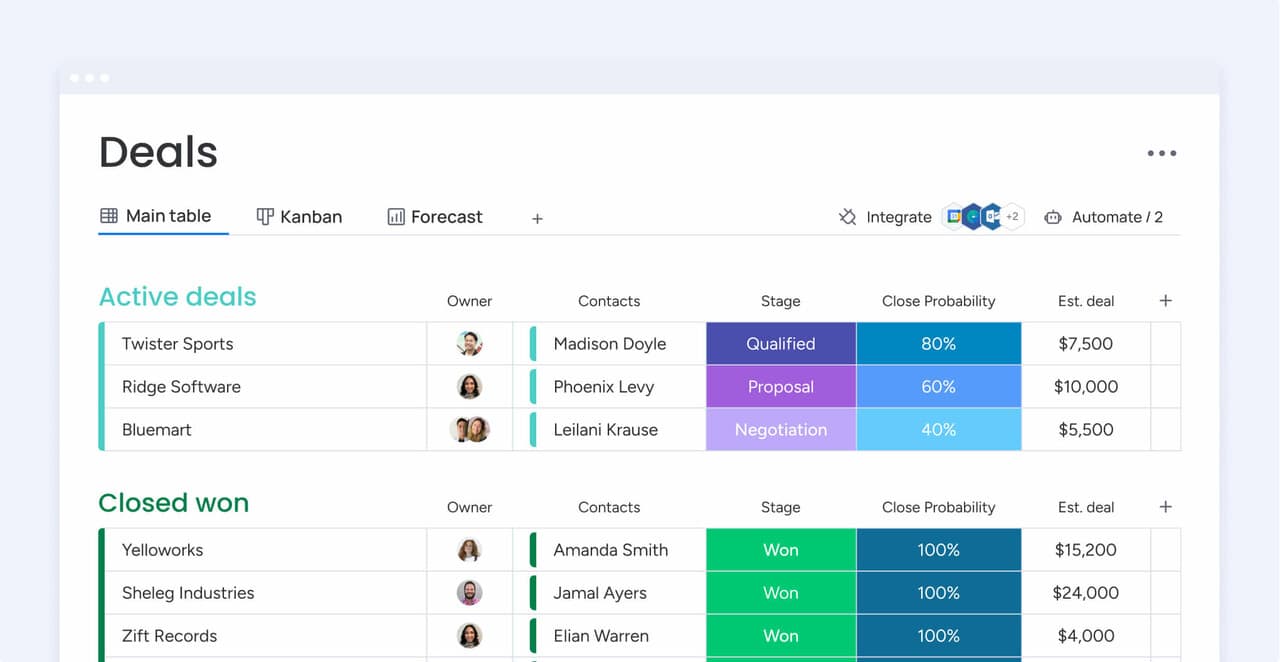
AI data analytics creates measurable wins across the entire organization, not just for data teams.
1. Faster time from raw data to actionable insight
AI shrinks the timeline from data collection to decision-ready insight from days or weeks down to minutes. Automated data preparation, instant pattern recognition, and real-time dashboards eliminate the bottleneck of waiting for an analyst to build a report.
A sales manager who previously waited until Friday for a weekly pipeline report can now see pipeline health updated in real time and receive alerts the moment a deal stalls. Instead of reacting to last week’s numbers, you’re responding to what’s happening right now.
2. Predictions that improve sales and operations forecasting
AI-driven forecasting uses historical patterns and current signals to generate predictions that beat manual estimates. This works across multiple functions:
- Sales: Predicting which deals will close and when
- Operations: Forecasting resource needs for upcoming projects
- Finance: Projecting revenue based on pipeline velocity and conversion rates
Teams can allocate resources proactively rather than reactively, reducing waste and capturing opportunities the team can now act on in time.
3. Personalization at scale across customer touchpoints
AI analytics lets teams tailor communications, offers, and experiences to individual customers based on behavioral data.
AI uses customer segmentation based on engagement patterns, purchase history, and interaction preferences, then applies those segments to outreach strategies. For example, AI might identify that a segment of customers responds to email outreach on Tuesday mornings and automatically adjust campaign timing for that group, improving open rates without any manual scheduling effort.
4. Reduced manual effort in reporting and data preparation
Automated reporting agents can generate, format, and distribute daily or weekly reports without manual intervention, pulling data from multiple sources and compiling it into a structured summary. Team members reclaim hours previously spent on manual data work and redirect that time toward strategic activities like relationship building, deal negotiation, and campaign planning.
5. Anomaly and risk detection before problems escalate
AI continuously monitors data streams and flags unusual patterns before they turn into bigger issues. These patterns might include a sudden drop in lead quality, an unexpected spike in customer complaints, or a project timeline slipping.
Anomaly detection means AI establishes what “normal” looks like across key metrics and immediately spots deviations from that baseline. Instead of discovering a problem in a monthly review, teams receive real-time alerts and can intervene early, when fixes are the most affordable and the customer experience stays smooth.
6. Accessible analytics for non-technical teams
AI removes the technical barrier to data analysis. Anyone can ask questions in plain language and get visual, understandable answers.
This puts data in everyone’s hands. Marketing managers, sales reps, and operations leads can explore data independently without submitting requests to a data team and waiting days for a response. This is particularly valuable for small and mid-sized teams that don’t have dedicated data scientists or analysts on staff, giving every team member the ability to make data-informed decisions in real time.
7. Competitive advantage through data-driven decisions
Organizations that embed AI analytics into their decision-making processes outperform those relying on intuition or delayed reporting. The speed and accuracy of AI-driven decisions create compounding advantages:
- Faster response to market changes
- More precise resource allocation
- Earlier identification of growth opportunities

How teams use AI data analytics across departments
Cross-functional visibility is where AI analytics creates the most value. Platforms that connect data across departments produce richer, more actionable insights than those that keep each team’s data in isolation.
Sales pipeline analysis and lead scoring
AI analyzes sales pipeline data to score leads based on fit, intent, and engagement signals, automatically ranking prospects by their likelihood to convert. It identifies patterns in historical deal data — which lead sources, industries, company sizes, or behaviors correlate with closed deals — and applies those patterns to score new leads in real time.
The workflow impact shows up immediately. Sales reps spend their time on the highest-value opportunities rather than manually qualifying every lead that enters the funnel.
When lead scoring is connected to CRM data in a unified workspace, reps can see scores alongside deal details, communication history, and recommended next steps without switching between systems. This keeps context and action in one place.
Marketing analytics and campaign optimization
AI uses marketing analytics to evaluate campaign performance across channels — including email, paid media, social, and content — to identify what’s working, what’s underperforming, and where to reallocate budget for maximum impact.
It tracks metrics progress against goals (leads, signups, conversions) and surfaces recommendations automatically, so marketing teams can course-correct without waiting for a weekly review. AI-powered competitor research agents can automate competitive analysis by monitoring market trends and consolidating signals into structured snapshots, giving marketing teams context for strategic decisions without manual research sprints.
When marketing analytics data lives alongside sales pipeline data on one platform, you can trace the full journey from campaign impression to closed deal and connect spend to revenue with precision.
Operations forecasting and resource planning
AI helps operations teams forecast demand, plan resource allocation, and spot process bottlenecks before they cause delays. It analyzes historical project data, current workloads, and team capacity to recommend optimal resource distribution, so the right people work on the right projects at the right time.
Risk analysis agents can proactively flag items nearing deadlines and send timely notifications to managers, turning potential delays into early interventions. Operations forecasting gets significantly more accurate when AI can see data from multiple departments, not just operations alone. Cross-functional context reveals dependencies and constraints you’d miss if you only looked at one department’s data.
Customer service insights and resolution tracking
AI analyzes customer service data (ticket volume, resolution times, sentiment trends, and recurring issues) to help service teams improve response quality and speed. Here’s how that works:
- Sentiment detection: Identifies negative trends across tickets and feedback in real time, allowing teams to intervene before customer dissatisfaction escalates into churn
- SLA compliance tracking: Monitors active tickets and flags at-risk cases before breaches occur, giving managers the visibility to reallocate resources proactively
- Cross-functional feedback loops: When service insights feed back into CRM and sales data, the entire organization gains a complete picture of customer health, connecting support interactions with deal history, engagement patterns, and renewal timelines

How AI agents automate analytics workflows
AI agents are autonomous software programs that perform specific tasks around the clock, including the following.
Reporting agents
Reporting agents automatically generate status updates, performance summaries, and executive digests on schedule or when triggered. These agents compile data from multiple sources, write narrative summaries, and distribute them to the right stakeholders without any human intervention.
Reporting agents can:
- Status reporter agent: Automatically generates and sends project status updates highlighting progress, risks, and blockers
- End-of-day recap agent: Summarizes meetings, decisions, and action items and posts them where the team will see them the next morning
- Executive attention digest agent: Monitors multiple high-value boards and compiles a periodic digest of items that need executive attention
This eliminates the “reporting tax”: the hours teams spend each week manually assembling updates that could be generated automatically.
Risk and anomaly detection agents
Risk and anomaly detection agents continuously scan data for unusual patterns and alert the right people before small issues turn into big problems. These agents establish baselines for normal performance and flag deviations like a sudden drop in deal velocity, an SLA breach trend, or an unexpected spike in support tickets.
These agents can:
- Risk analyzer agent: Proactively flags items nearing their deadline and sends timely notifications
- Anomaly and outlier detector: Continuously scans metrics and flags unusual spikes or drops that might indicate emerging issues
- SLA monitor agent: Tracks SLA across active tickets, flags at-risk cases, and proactively alerts managers
These agents work 24/7, providing continuous coverage that extends well beyond what the 9-5 schedule, catching weekend anomalies, overnight data shifts, and gradual trends you’d miss in periodic reviews.
Research agents that monitor trends and competitors
Research agents search online sources to monitor industry trends, competitor activity, and market shifts relevant to your organization. They deliver findings directly into your team’s workspace, turning research into a continuous background process instead of a periodic manual effort. Some examples include:
- Competitor research agent: Tracks key competitors and consolidates signals into a structured snapshot, including pricing changes, product launches, messaging shifts, and hiring patterns
- Market landscape analyzer: Identifies new competitors, emerging technologies, and macro trends that could affect strategy
- Vendor research agent: Analyzes procurement requirements, researches and prioritizes supplier lists
Custom analytics agents
Platforms with AI agent builders allow teams to build custom agents tailored to their specific analytics needs without writing code. The typical process has 3 steps:
- Describe the agent’s role and triggers: Define what the agent should do and when it should act
- Connect the relevant knowledge and data sources: Link the agent to the docs, boards, and systems it needs to access
- Test and refine: Try the agent, make adjustments, and watch how work gets done
How to get started with AI data analytics in 5 steps
You don’t need a massive technology overhaul or a dedicated data science team to get started with AI data analytics. Start with a focused example, prove value quickly, and expand from there. This step-by-step approach reduces risk and builds confidence in AI-driven decision-making.
Step 1: Connect your data sources in one platform
AI analytics starts with getting data from multiple sources into one place. Teams typically need to connect:
- CRM records and sales pipeline data
- Marketing platforms and campaign performance data
- Project management boards and operational databases
- Email, spreadsheets, and communication platforms
Step 2: Define the questions your team needs answered
AI analytics is most effective when directed at specific, high-value questions rather than vague goals like “analyze everything.” Start by identifying 3–5 questions your team currently struggles to answer quickly. These become the foundation for dashboards, reports, and agent configurations.
- Sales: Which deals are at risk of slipping? What’s our projected close rate this quarter? Which lead sources produce the highest conversion rates?
- Marketing: Which channels deliver the highest-quality leads? How are campaigns performing against goals? What are competitors doing differently this quarter?
- Operations: Where are project bottlenecks? Are we on track to meet delivery deadlines? How is workload distributed across the team?
- Customer service: What are the most common support issues? Are we meeting SLA targets? Which accounts show declining sentiment?
These questions give AI a direction and make it easy to measure whether the analytics are delivering value.
Step 3: Set up automated dashboards and reports
Project dashboards should be configured to automatically display live data relevant to the questions defined in Step 2. Key dashboard capabilities to configure include:
- Budget tracking: Monitor spend against allocation in real time
- Goal progress: Visualize progress toward targets across teams
- Schedule timelines: Track deadlines and milestones across projects
- Resource allocation: See how workload is distributed across team members
- Workload distribution: Identify capacity constraints before they cause delays
Dashboards should be shareable so stakeholders across the organization can access the same data without requesting custom reports.
Step 4: Deploy AI agents for continuous analysis
Once dashboards provide visibility, the next step is deploying AI agents to automate the ongoing analytical work. High-impact examples might include:
- A risk analyzer for pipeline deals: Flags at-risk opportunities and alerts account owners
- A status reporter for project updates: Generates and distributes progress summaries automatically
- An anomaly detector for SLA compliance: Monitors service metrics and alerts managers to emerging issues
Test agents with non-critical data first and refine based on results before expanding to broader examples.
Step 5: Measure outcomes and expand across departments
Evaluate whether AI analytics is delivering value by tracking specific metrics:
- Time saved on reporting: Hours reclaimed from manual data work
- Accuracy of predictions versus actual outcomes: Gap between forecasts and results
- Speed of decision-making: Time from insight to action
- Business results influenced by AI-driven insights: Deals closed, campaigns optimized, risks mitigated
Once one department proves the value, share the approach and results with other teams and replicate the process with their specific questions and data sources.
How to build trust and governance into AI analytics
Trust and governance are prerequisites for successful AI analytics adoption. 4 governance foundations every organization should put in place before scaling AI analytics across departments:
Role-based access controls
Role-based access controls ensure that team members only see and interact with data appropriate to their role. Administrators can define exactly which data an AI agent or user can access, and whether they have permission to edit, create, or only read information. This is especially important when AI analytics spans multiple departments, where sales data, HR records, and financial information each require different access levels.
Audit trails and transparency
An audit trail is a complete record of every action an AI agent took, when it took it, and why. Transparency means teams can always see what agents did, why they did it, and what they’ll do next — every decision comes with a visible explanation. This is essential for both internal accountability and external compliance requirements.
Human-in-the-loop validation
Human-in-the-loop is a governance model where AI can analyze and recommend, but a person must approve before high-impact actions are executed. For example, an AI agent that identifies at-risk deals and drafts re-engagement emails can present those drafts for a sales manager’s approval before sending them.
Data privacy and compliance
Organizations should ensure their AI analytics platform encrypts data by default, retains ownership of content provided to and generated by AI, and does not allow third parties to train on their data. Compliance isn’t only a legal requirement — it’s a trust signal that determines whether teams and customers feel confident in AI-driven processes.
What to look for in AI-powered data analytics platforms
The right platform depends on your organization’s size, technical resources, and cross-functional needs. These evaluation criteria help teams select a platform that delivers value quickly without extensive technical expertise.
Cross-functional data access across departments
The most valuable AI analytics platforms provide a unified data layer where information from sales, marketing, operations, service, and other departments is accessible in one structured system.

No-code setup and low learning curve
Platforms requiring extensive technical setup, SQL knowledge, or dedicated data engineers create adoption barriers. “No-code” means the ability to build dashboards, configure agents, and run analyses through visual interfaces and natural language rather than programming. The fastest path to value is a platform that any team member can start using immediately without specialized training.
Enterprise-grade security and governance
Security and governance capabilities should be evaluated based on certifications (SOC 2 Type II, ISO 27001, HIPAA), permission granularity, audit trail completeness, and data privacy controls. As AI analytics scales across departments and handles sensitive customer and financial data, security gaps create compounding risk. The platform should support content ownership, meaning the organization retains ownership of data provided to and generated by AI.
Integration with existing workflows and CRM systems
AI analytics platforms should connect to the systems teams already use — including CRM, email, project management, and communication platforms — through pre-built integrations rather than requiring custom development. Surface-level connections that only pull data are less valuable than deep integrations that allow AI to both read from and act on connected systems.
With monday agents, AI analytics capabilities are embedded directly into the workspace where teams already manage customer relationships, projects, and operations. Insights surface alongside the deals, contacts, and workflows they relate to — so the path from data to decision to action happens in one place.
AI-powered dashboards and real-time reporting
Dashboards on monday AI Workspace automatically display live data with customizable drag-and-drop widgets covering budget, goals, schedules, resources, and workload. They pull data from across the platform — including sales pipeline, marketing campaigns, project boards, and service tickets — providing a unified view that updates in real time. The platform supports 10+ widget types and 15+ board views (including Kanban and Gantt), allowing teams to visualize data in the format most useful for their specific needs.
monday agents for automated analytics across teams
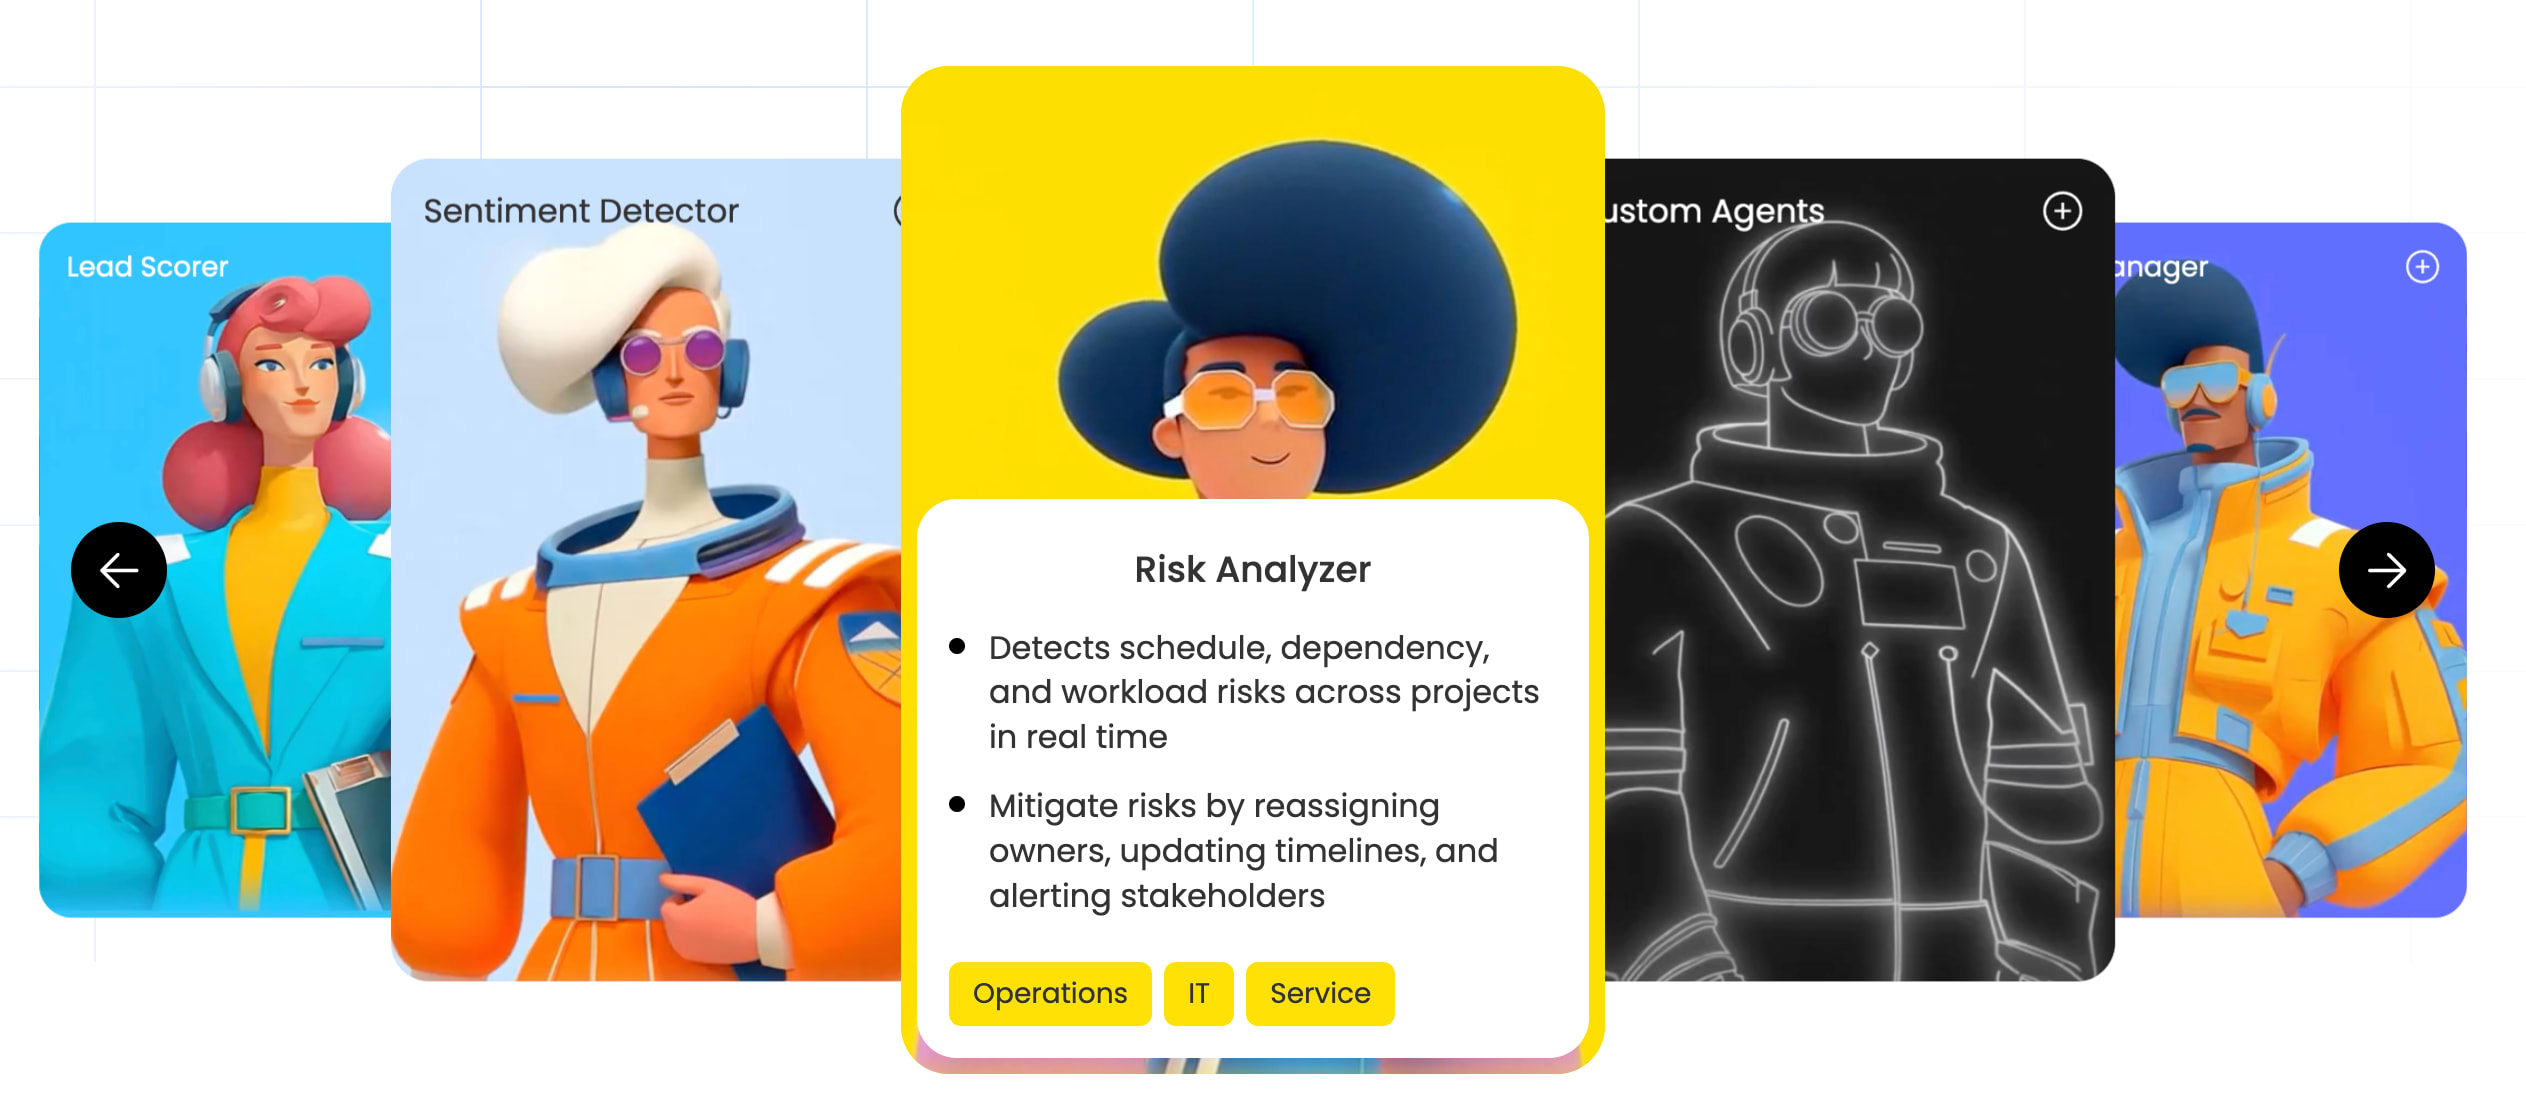
monday agents operate as autonomous AI teammates that execute analytics workflows continuously, grounded in the organization’s actual work data. Here’s how different agent types support analytics workflows:
- Reporting agents: Automatically generate and send project status updates highlighting progress, risks, and blockers
- Insights agents: Flag risks and generate analysis from any data, proactively identifying items nearing deadlines and scanning metrics for unusual spikes or drops
- Research agents: Monitor trends and competitors, consolidating signals into structured snapshots that arrive in the team’s workspace
For teams with unique analytics needs, the three-step agent builder (describe the role, connect knowledge and data, test and refine) allows custom analytics agents to be created without code.
Natural language data analysis with monday sidekick
Built into the platform, monday sidekick is a context-aware AI assistant that allows team members to analyze data through natural conversation. Team members can ask questions like “What’s the status of our Q3 pipeline?” or “Which deals are at risk this week?” and receive instant, visual answers drawn from their actual workspace data.
monday sidekick can summarize updates, analyze sales pipelines, create dashboards from simple prompts, and generate reports — all through natural language, without requiring any technical skills. It connects to existing integrations (Slack, Gmail, Google Calendar) to pull context from multiple sources into a single conversational interface, so the answer reflects the full picture rather than data from a single system.

monday vibe for custom analytics applications
With monday vibe, teams can build fully custom analytics applications using written prompts instead of code. The concept behind it — sometimes called “vibe coding” — means describing what you want in plain language and having AI generate a working application that you can iterate on through conversation.
A team could build a custom inventory tracking app, a customer health scoring dashboard, or a campaign performance tracker tailored to their specific metrics and workflows, all without waiting for development resources. This puts the power of custom analytics in the hands of the people who actually use the data, removing the bottleneck between identifying a need and having a solution that addresses it.
Connecting AI insights to workflows and revenue outcomes
monday agents‘ distinct advantage is that AI analytics insights are directly connected to the workflows where teams take action: deal management, lead nurturing, customer communication, and pipeline progression.
Insights don’t sit in a separate reporting system. They appear alongside the deals, contacts, and projects they relate to, in the same workspace where reps manage their day. This connection closes the insight-to-action gap.
When AI identifies an at-risk deal, the sales rep can see the alert, review the context (communication history, deal stage, engagement signals), and take action — all without leaving the workspace. This integration between analytics and execution is what transforms data insights into revenue outcomes, because the distance between “here’s what the data says” and “here’s what we’re doing about it” shrinks to zero.
Getting started with AI analytics
AI data analytics has shifted from a specialized technical capability to an accessible business advantage. The organizations seeing the greatest impact connect insights directly to the workflows where decisions happen.
Getting started doesn’t require data science knowledge or months of implementation. Connect your data sources, define the right questions, deploy agents to automate analysis, and expand. With monday agents, AI-powered insights and actionable workflows live in one workspace, so teams can move from data to decisions faster.
Try monday agentsFrequently asked questions
How much does AI data analytics cost to implement?
Costs vary widely depending on the platform and scope, but many platforms, including monday.com, offer free plans with no credit card required. This makes it possible for teams to start exploring AI analytics capabilities at zero cost before committing to paid tiers.
Can small teams use AI for data analysis without a data scientist?
Yes. Platforms with natural language interfaces, no-code dashboards, and built-in AI agents are specifically designed for teams without dedicated data scientists. With monday sidekick and the agent builder, any team member can analyze data and automate reporting through plain language prompts.
How long does it take to see results from AI-powered analytics?
Teams using platforms with pre-built integrations and no-code setup can begin generating automated reports and insights within days of connecting their data sources. Predictive accuracy improves over time as the AI processes more historical data.
What data do I need before starting with AI analytics?
Teams can start with whatever structured data they already have, including CRM records, sales pipeline data, project boards, or customer support tickets. Data sources can be expanded incrementally as teams identify new questions to answer.
What is the difference between AI analytics and business intelligence?
Traditional business intelligence describes what already happened through static reports and dashboards. AI analytics adds diagnostic, predictive, and prescriptive capabilities, automatically identifying why something happened, what's likely to happen next, and what actions to take.
How does monday agents use AI for data analytics?
With monday agents, AI analytics is embedded directly into the workspace through real-time dashboards, autonomous AI agents that generate reports and flag risks, monday sidekick for conversational data queries, and monday vibe for building custom analytics applications. All of these capabilities are connected to workflows so insights translate directly into team action.

 Get started