
Gantt charts are an important part of project management. Using horizontal bars, these charts are used to trace project progress over time, helping teams visualize how tasks are interconnected.
Project management software often includes Gantt charts as an option for a project overview, with some tools diving deeper into including additional functionalities. While they’ve been around for years, Gantt charts remain a popular choice for organizing projects across various industries, leading teams to seek out Gantt chart software to fit their workflows.
However, there’s no shortage of choices for Gantt chart tools on the market, which can make narrowing down your selection a little challenging. In this blog post, we’ll cover the best options for Gantt chart software available today, examine their key features, and prices, and look at why customizable platforms like monday work management make for the most reliable choice.
What is a Gantt chart?
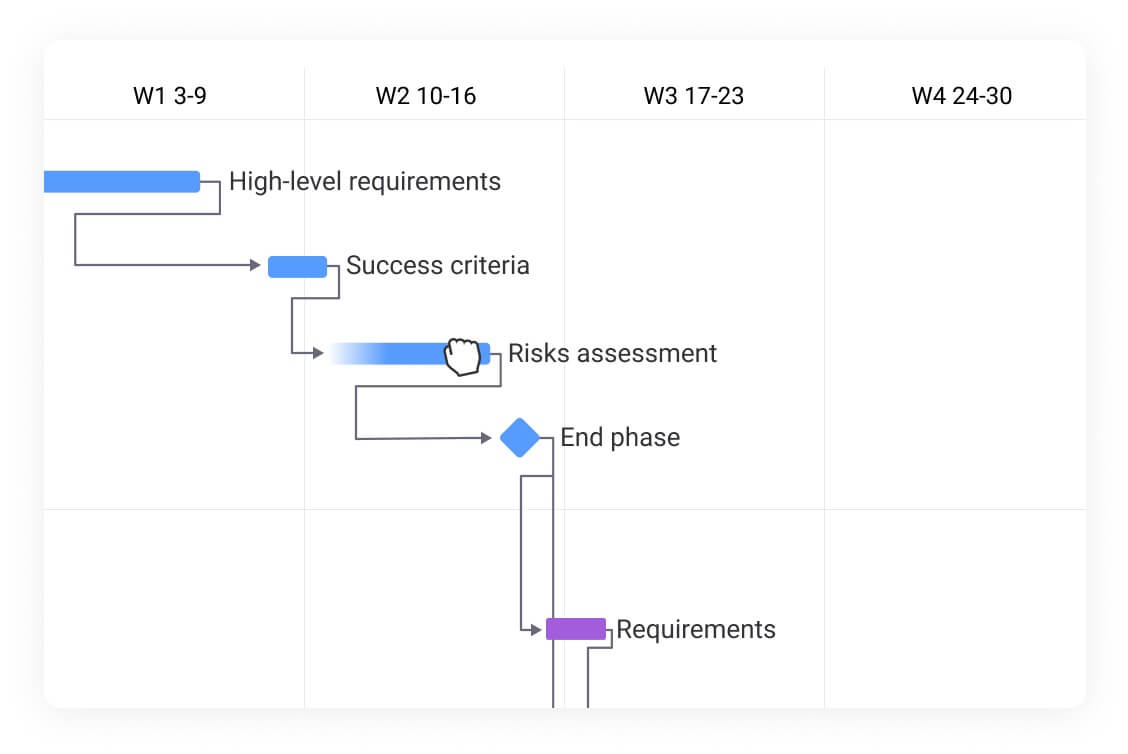
Henry Gantt, an engineer, management consultant, and efficiency expert, created the Gantt chart in the early 1900s. A Gantt chart is a horizontal bar chart displaying project tasks on a timeline, including start and end dates, task duration, task dependencies, and progress.
Today, Gantt charts are mainly used for project planning and scheduling and to help project managers understand a project’s timing and scope. They’re comprised of horizontal progress bars used as a visual way to keep track of project stages in a set timespan.
The success of a Gantt chart lies in its ability to quickly identify task dependencies and project duration. Project managers can see the progress of each task, how they’re related to other tasks, and when they should be completed.
What is Gantt chart software?
Gantt chart software is a type of project management software used to create digital Gantt charts for better collaboration and communication.
Gantt chart software simplifies complex projects by displaying collaborators and task owners in a single timeline-based view, giving you an overview of a project’s duration and tasks.
Gantt charts often use color coding and icons or images to represent or assign tasks. With Gantt chart software, you can:
- Create, manage, and assign tasks
- Plan resource allocation
- Set due dates
- Set up task dependencies
- Track progress against expectations
- View overall project timelines
At a glance: Gantt chart software comparison
If you’re pressed for time, scan the table below to find the right Gantt chart software for your team based on who it’s best for and pricing. If you want to know more about the software, keep reading as we’ll get into more detail.
| Tool | Best for | Starting price |
|---|---|---|
| monday work management | Teams who want a flexible and customizable project management tool with Gantt features and more | $9/seat/month |
| Wrike | Teams of all sizes who need a flexible Gantt chart and project management tool | $8/user/month |
| Smartsheet | Teams looking for a powerful spreadsheet-style tool with refined Gantt chart features | $9/user/month |
| ClickUp | Teams looking for a customizable project management tool with Gantt charts | $7/user/month |
| Hive | Teams looking for an affordable collaborative project management platform | $5/user/month |
| TeamGantt | Teams looking for a simple and straightforward Gantt chart software | $49/month/user |
| Aha! | Teams looking for product planning software alongside Gantt chart functionality | $59/user/month |
| ProjectManager | Teams and project managers looking for a robust project management platform with Gantt capabilities | $13/user/month |
| Paymo | Small businesses looking for a project management tool with Gantt chart features | $5.90/user/month |
| nTask | Teams looking for a budget-friendly and basic Gantt chart platform | $3/user/month |
| ProofHub | Project management and collaboration for teams of all sizes | $79/month |
| Gantter | Teams who want a Gantt tool that integrates seamlessly with Google products | $5/month/user |
| Instagantt | Teams looking for a simple and affordable Gantt chart maker | $12/month/user |
| Tiemchart | Engineering, construction, or consulting firms looking for a Gantt chart tool | Available upon request |
| BigGantt | Jira users who want a powerful Gantt plugin to improve project management | Available upon request |
| OnePager | Teams already using Microsoft Project who want a one-time Gantt chart tool purchase | $499 for a one-time license |
| Apptivo | Businesses looking for a solution that integrations CRM with Gantt chart functionality | $20/user/month |
| Toggl Plan | Teams looking for a simple and visually appealing Gantt chart and time-tracking tool | $8/user/month |
| GanttPRO | Teams of any size looking for professional and comprehensive Gantt chart software | $7.99 user/month |
| Agantty | Easy and clear project management for small and medium teams | €4,90/month/user or €50/year/user |
Features to look for in Gantt chart software
Gantt chart software can come with a lot of bells and whistles, and choosing the right one comes down to what your team needs. Still, there are a few key features you should always look for in Gantt chart software:
- Task scheduling: Visualize and schedule tasks on a timeline with start and end dates
- Dependencies: Link tasks to show dependencies so your entire team knows what needs to be completed before a new task is started
- Collaboration tools: Comments, file sharing, and notifications will help facilitate communication and collaboration in your team
- Progress tracking: Track the progress of tasks in a percentage or other visual metric
- Customization: Customize how you view tasks, such as by status, priority, or team member
- Automation: Software should automatically adjust when changes are made and send automated notifications to relevant team members
While there are many ways to use free Gantt charts, such as in Excel, with a digital template, or manually creating your own, relying on software gives you access to a variety of additional tools and features that help ensure your project is running as efficiently as possible.
Top 20 Gantt chart software for project managers
While Henry Gantt began writing Gantt charts on paper, we have since come a long way with digital Gantt chart software. These platforms allow for real-time collaboration and more efficient tracking of project tasks. Below, we’ll go through some of the most popular Gantt chart software platforms on the market so that you can choose the best one for your next project.
1. monday work management
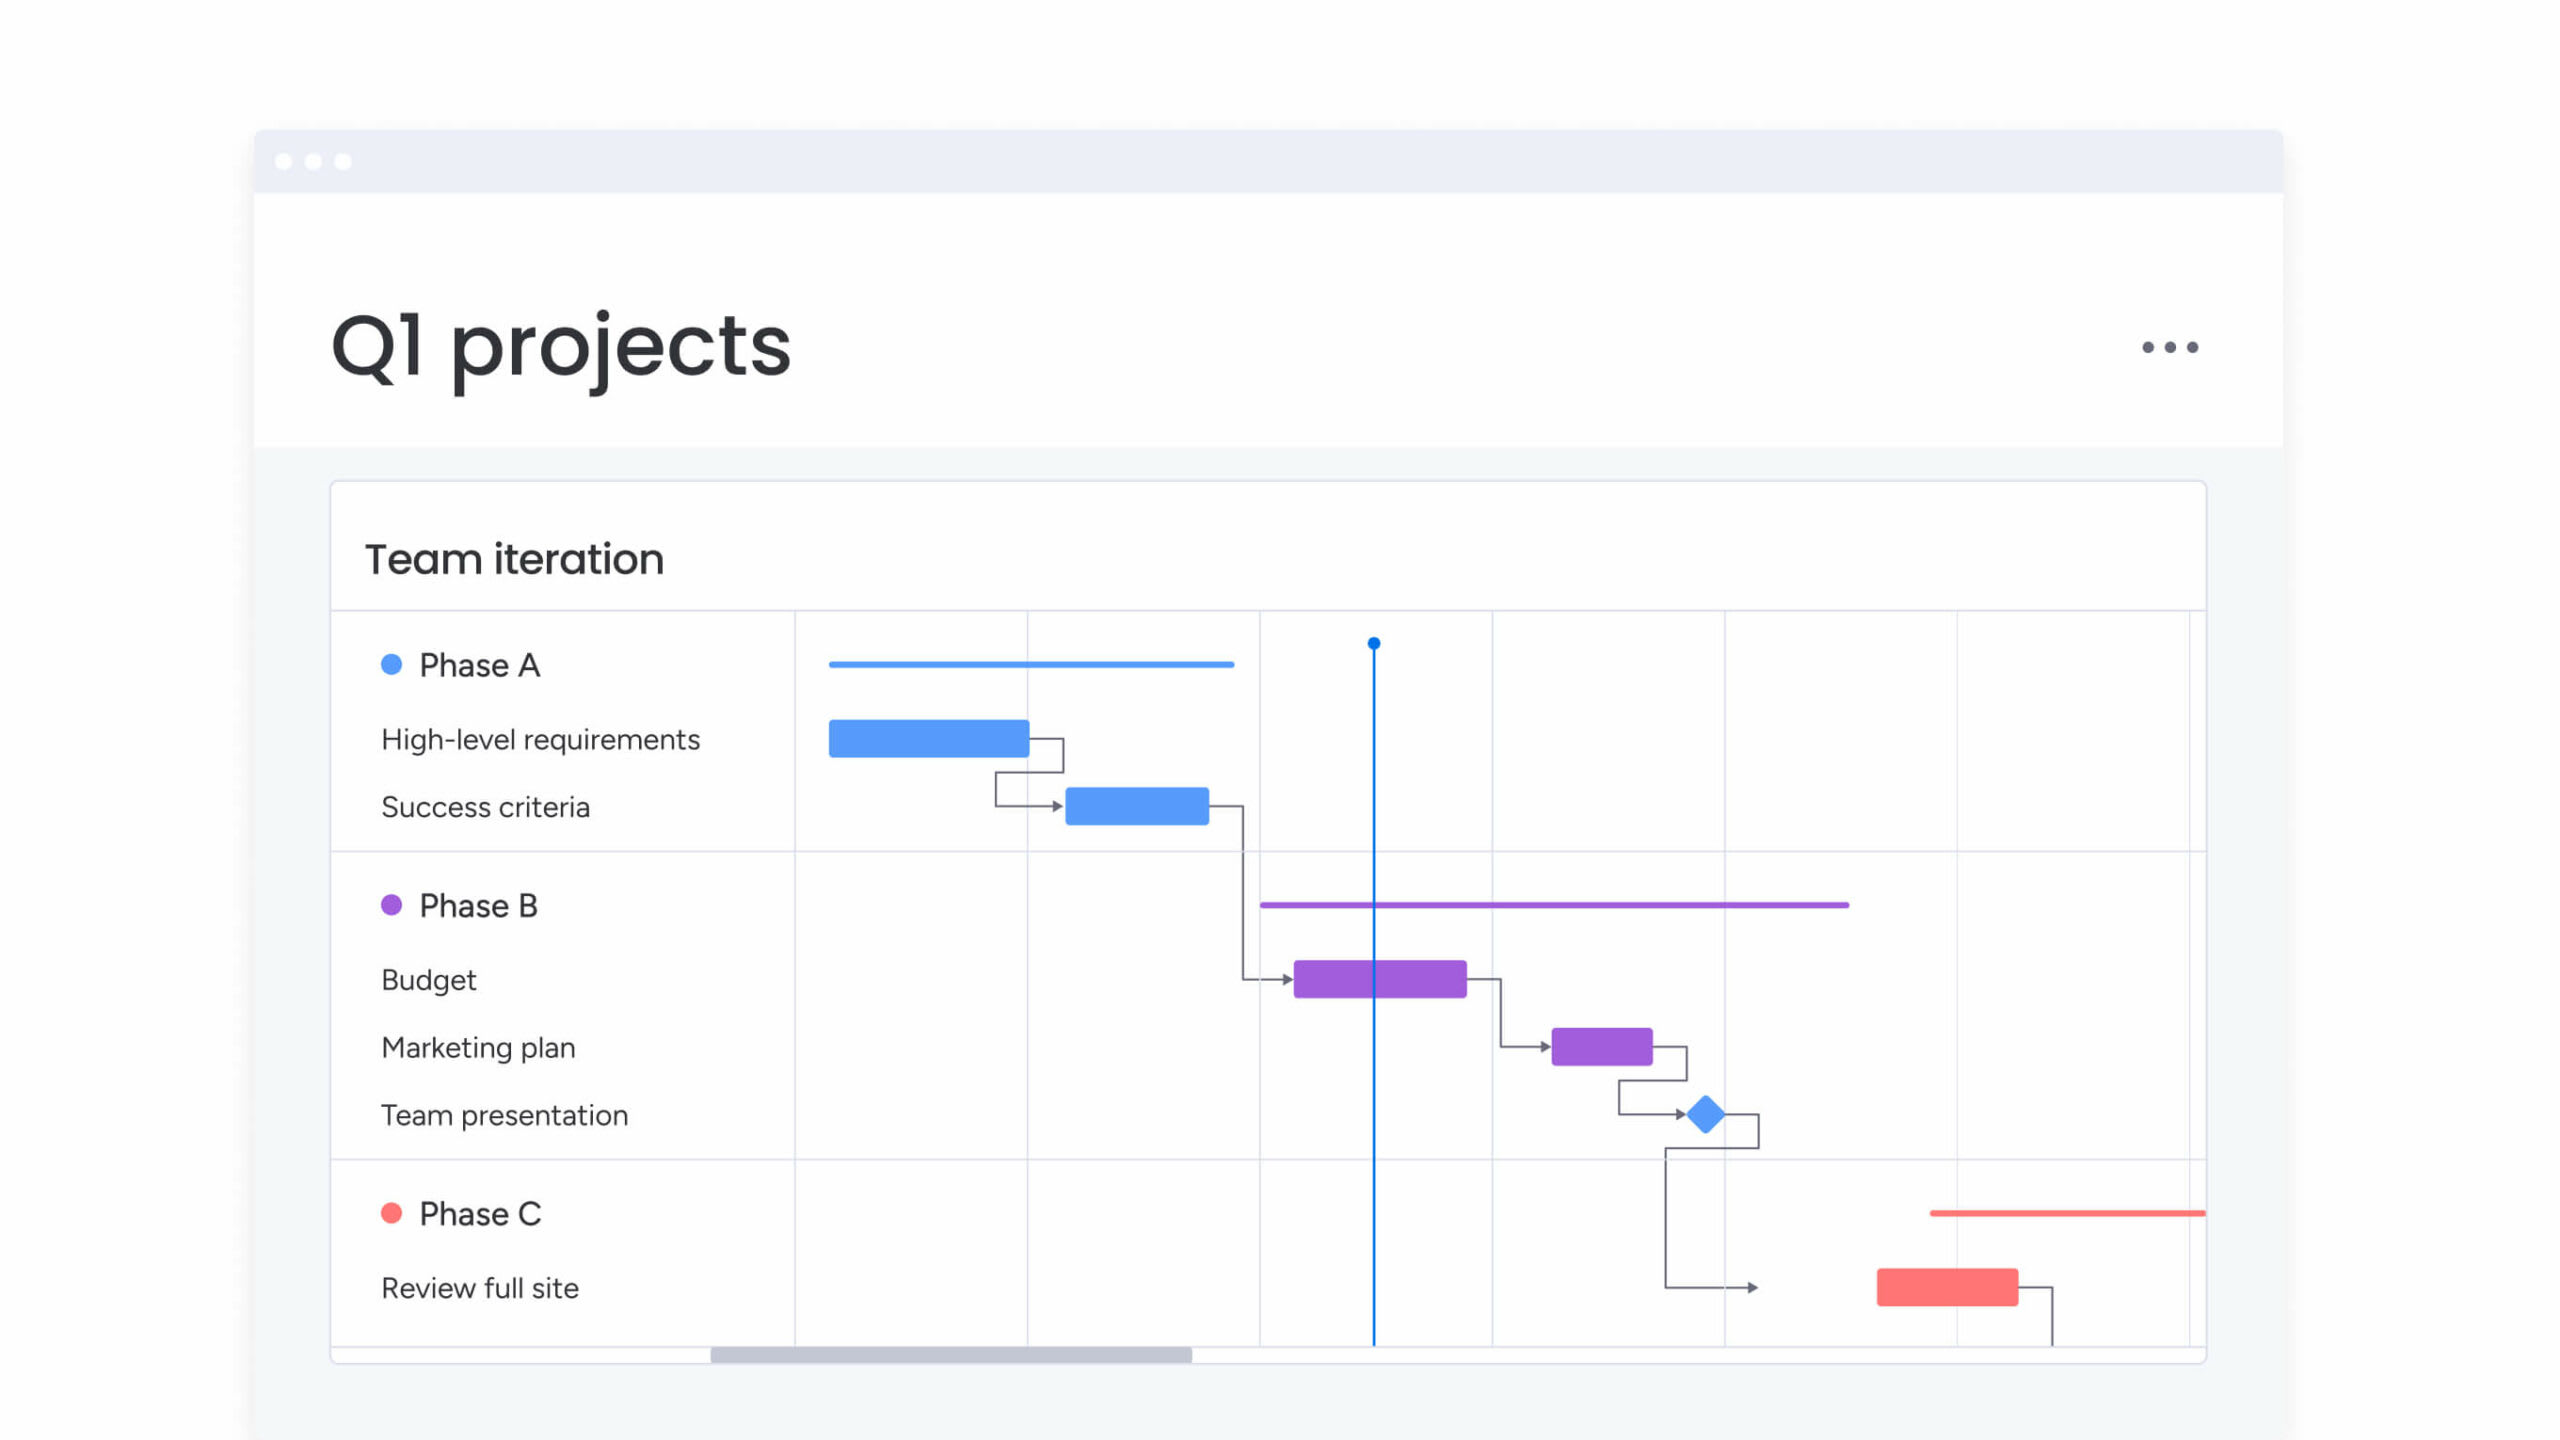
Best for: Teams who want a flexible and customizable project management tool with Gantt features and more
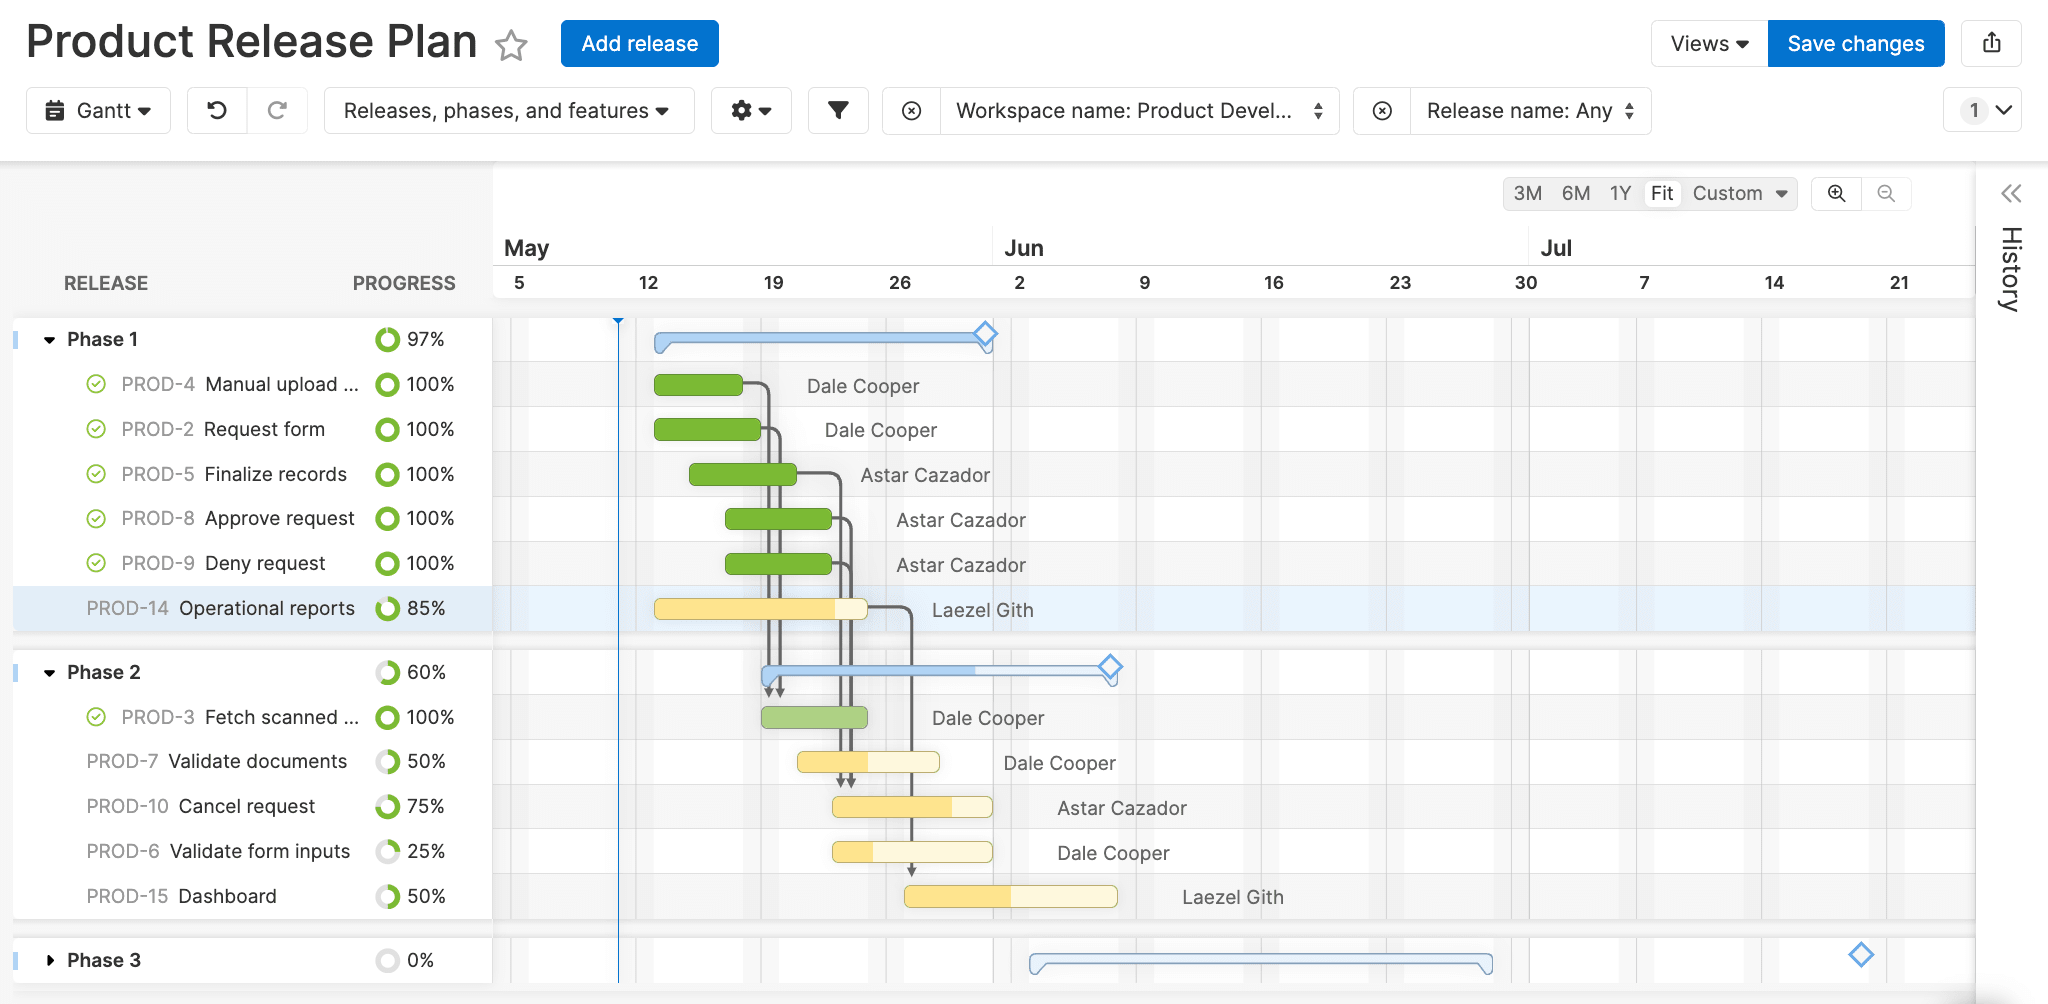
Creating Gantt charts with monday work management is simple, and you can personalize them to your team’s needs in minutes. With 27 different work views, you can start with a dynamic Table view to enter all your relevant project data before seeing your project in different views such as Gantt, Timeline, Calendar, Kanban, or others.
Key monday work management features
- Visually track and manage milestones, dependencies, tasks, and more in one place
- Instantly import data from Excel and visualize it on a Gantt chart for more collaborative work
- 200+ app integrations with your favorite project management and work tools
- Smart no-code workflow automation that you can customize to cut out manual repetitive tasks
monday work management pricing
- Plans starting from $9/seat/month
- Four plans to choose from: Basic, Standard, Pro, and Enterprise
- Free trial available
- Learn more about plans and pricing here
2. Wrike
Best for: Teams of all sizes who need a flexible Gantt chart and project management tool
Wrike is a versatile project management platform with great Gantt chart features that can be fitting for any type of team. With its collaborative features and user-friendly interface, Wrike gives you direct visibility into projects and tasks so you can better reach your goals.
Key Wrike features
- Easily adjust your Gantt chart and reschedule dates and deadlines in bulk
- Share tasks with colleagues with a link to stronger collaboration
- Import data from Excel or MS Projects directly to your Gantt chart
Wrike pricing
- Plans starting from $8/user/month
- Four plans to choose from: Team, Business, Enterprise, Pinnable
- Free plan with limited functionalities for small teams
- Free trial available
- Learn more about Wrike’s plans and pricing here
3. Smartsheet
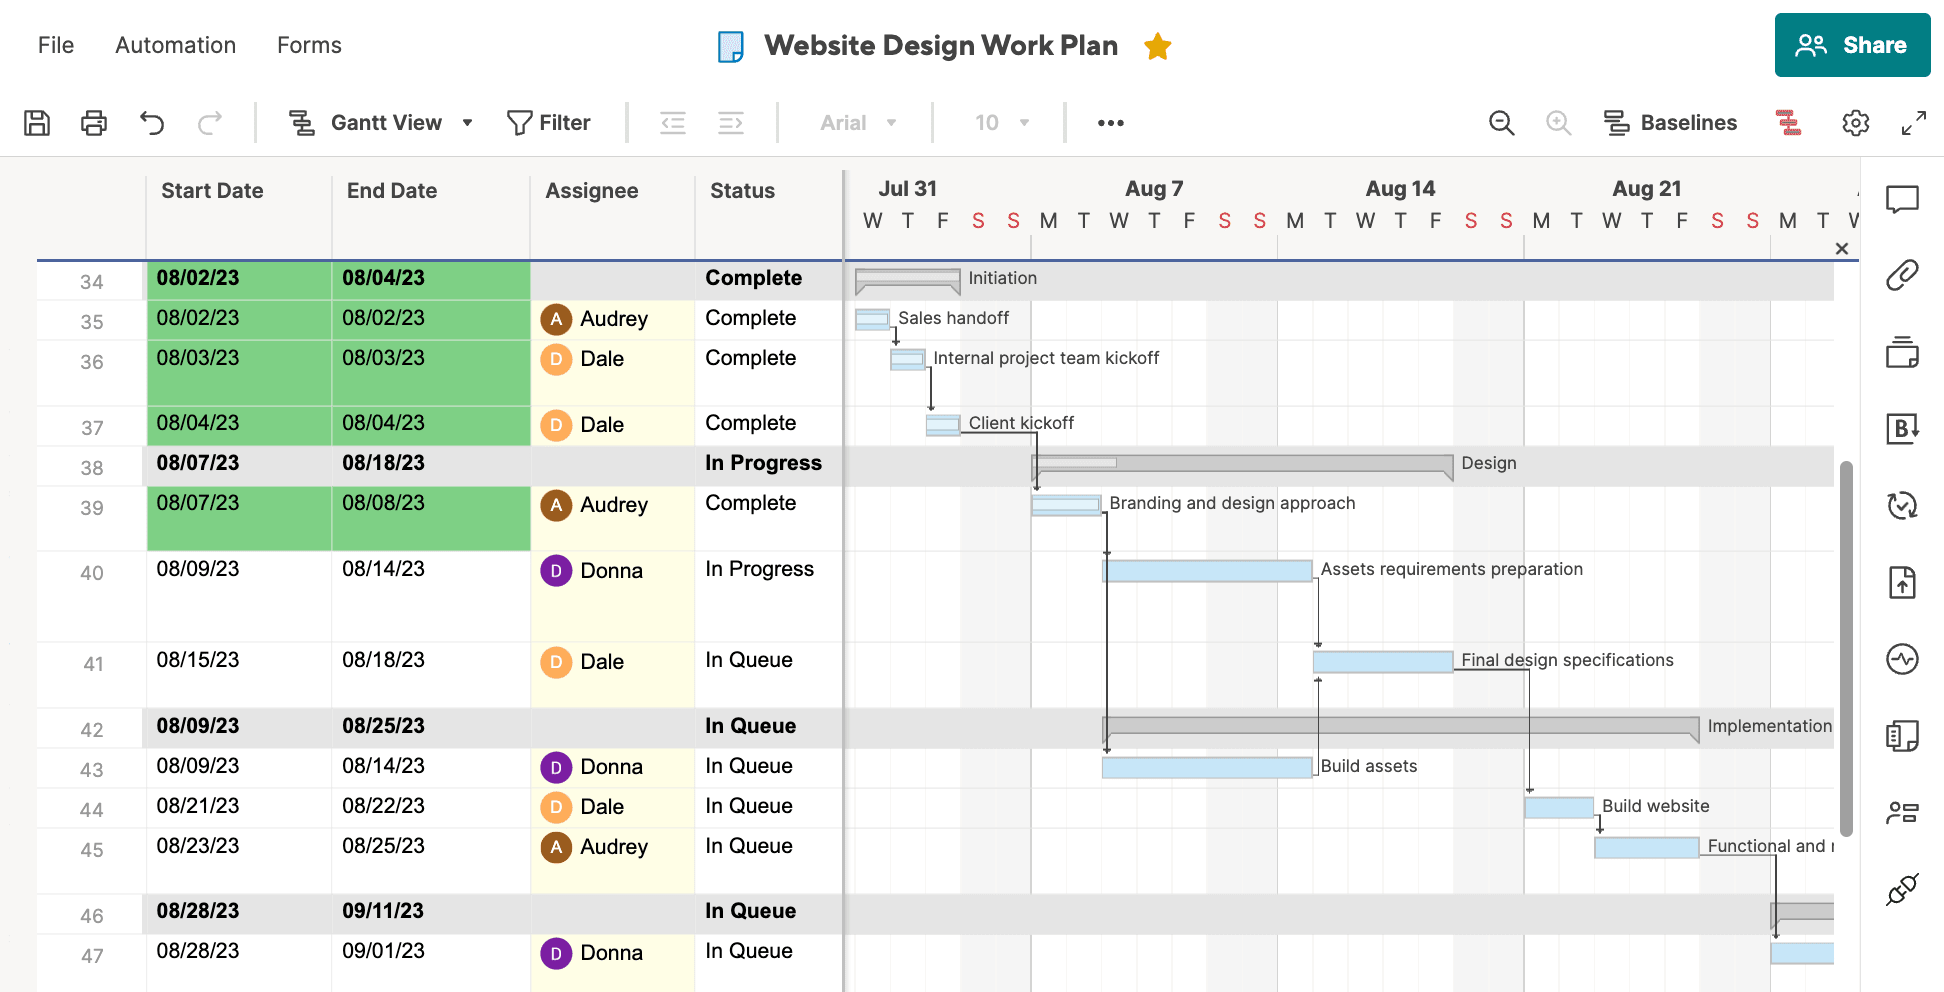
Best for: Teams looking for a powerful spreadsheet-style tool with refined Gantt chart features
Smartsheet is a work and project management platform known for its simple spreadsheet-style software. Despite its simplicity, Smartsheet is robust enough to handle complex projects and processes, making it a scalable tool for teams of any size.
Key Smartsheet features
- Visualize your projects and tasks in a Gantt View that can be edited to your liking
- 100+ apps and integrations with the work tools you’re already using
- Automate versatile workflows for setting notifications, responding to messages, and more
Smartsheet pricing
- Plans starting from $9/user/month
- Three plans available: Pro, Business, and Enterprise
- Free trial available
- Find out more about Smartsheet plans and pricing here
4. ClickUp
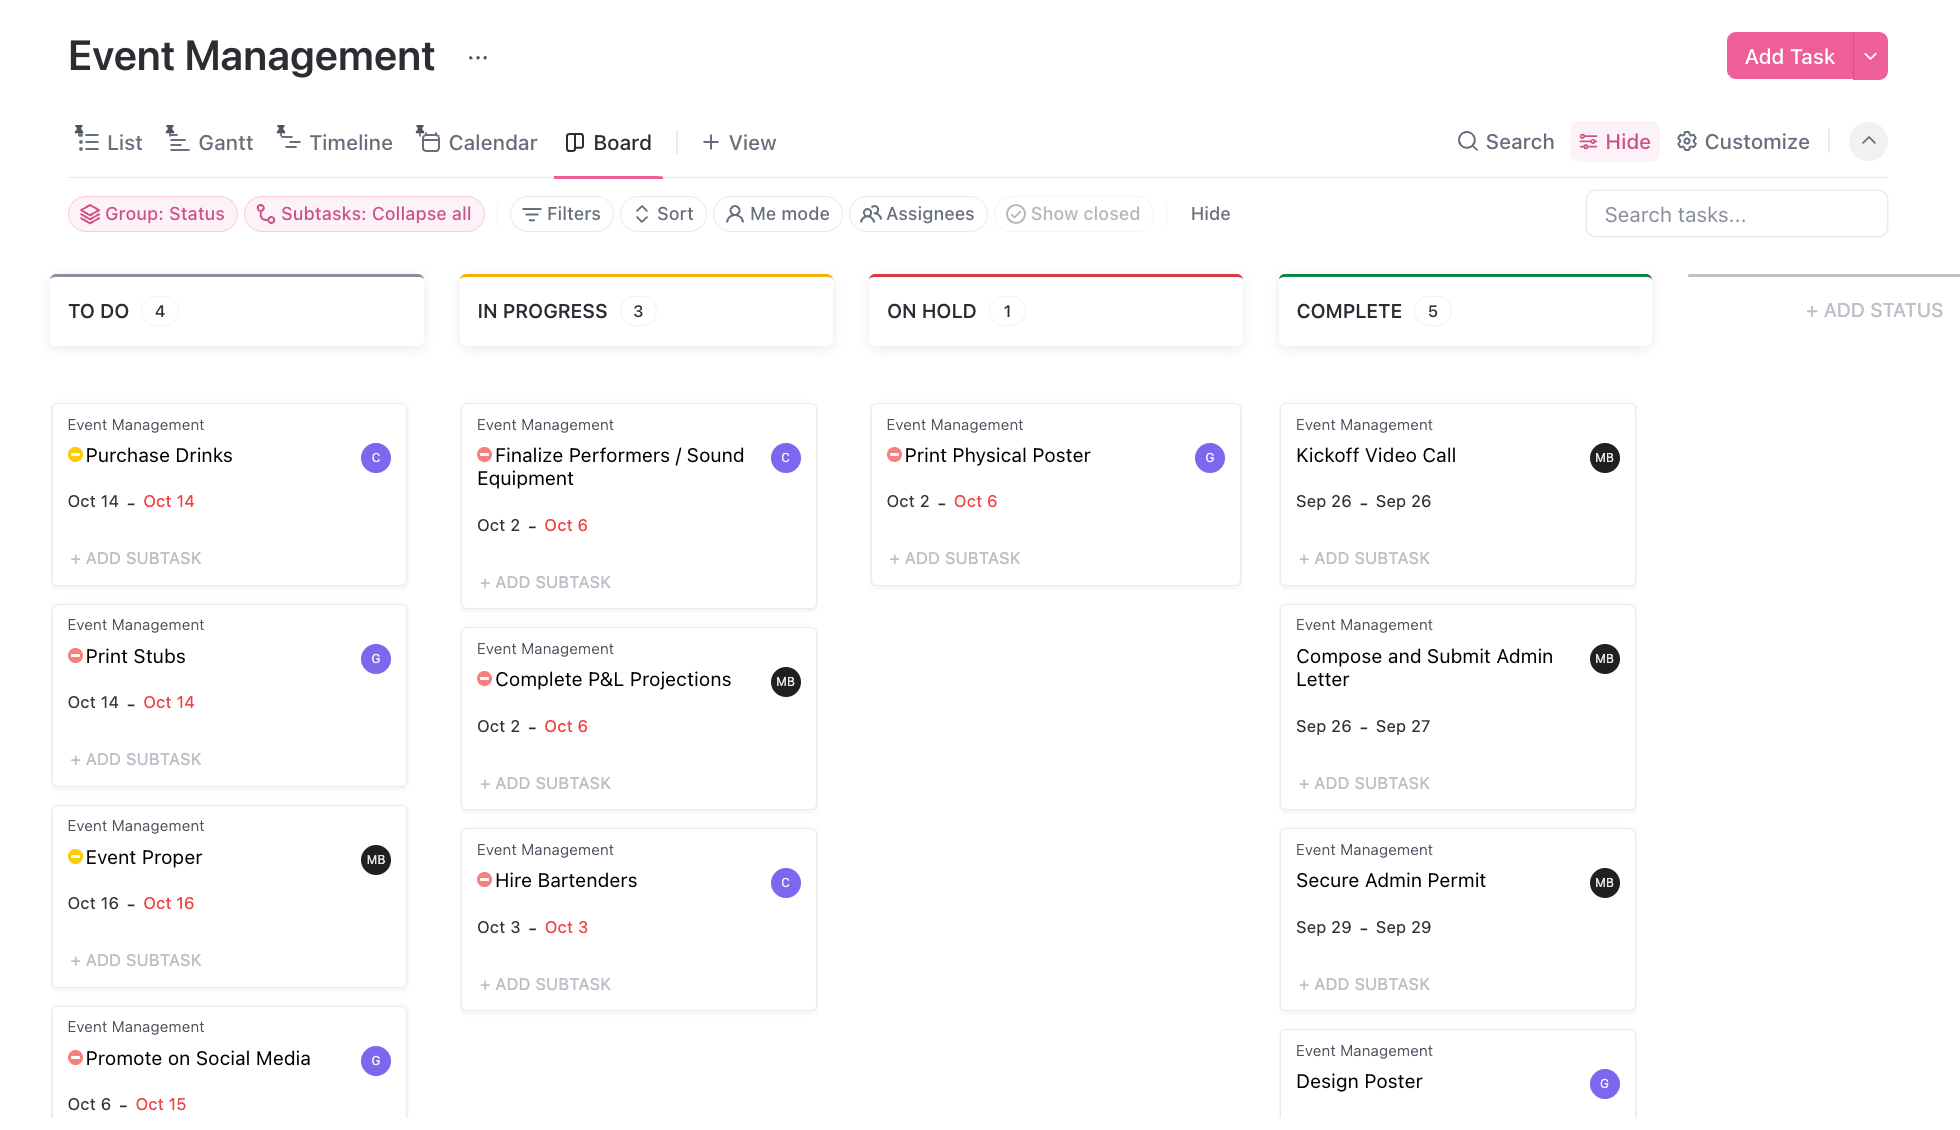
est for: Teams looking for a customizable project management tool with Gantt charts
ClickUp includes Gantt chart functionality as a part of its project management suite. Users can adjust timelines, priorities, and tasks to keep track of projects. As an all-in-one project management tool, ClickUp helps teams streamline workflows and avoid bottlenecks.
Key ClickUp features
- Customize your Gantt chart with dates, priority levels, dependencies, and more
- Identify your project’s critical path to better stick to your timeline
- Slack Time feature shows tasks with flexible schedules right on your Gantt chart
ClickUp pricing
- Plans starting from $7/user/month
- Four plans available: Free, Unlimited, Business, and Enterprise
- Free forever plan with basic features available
5. Hive
Best for: Teams looking for an affordable collaborative project management platform
Combining Gantt charts with powerful project management tools, Hive helps teams work faster. Hive boasts a democratically built platform built by users, offering customizable features along with an adoption guarantee. Hive has a comprehensive Gantt chart view and functionalities for tracking projects.
Key Hive features
- Toggle between Gantt view and others like List, Calendar, Kanban, and more
- Resource management and time-tracking tools to monitor team productivity
- Automate tasks and workflows to cut down on time-consuming manual work
Hive pricing
- Plans starting from $5/user/month
- Three plans available: Starter, Teams, and Enterprise
- Free forever plan with limited features
- Free trial available
6. TeamGantt
Best for: Teams looking for a simple and straightforward Gantt chart software
As its name implies, TeamGantt offers a simple and visual way to plan and manage projects. Features a user-friendly interface and UX, it’s easy to create and adjust project timelines and includes collaboration features that keep your entire team on the same page.
Key TeamGantt features
- Drag-and-drop interface to easily create and adjust Gantt charts
- Aside from Gantt charts, visualize work in a Kanban list, Calendar view, and more
- Built-in resource management feature helps you balance your team’s workload
TeamGantt pricing
- Plans starting from $49/month/user
- Two paid plans available: Pro and Unlimited Everything
- Free plan with basic features for smaller teams
- Free trial available
7. Aha!
Best for: Teams looking for product planning software alongside Gantt chart functionality
Aha! is a product development platform that helps teams bring their product strategy to life. With plenty of features to help drive a product development plan forward, Aha! also includes some core project management functionality, such as Gantt charts to help product teams plan complex deliveries.
Key Aha! features
- Build Gantt charts around your timeline for product launches to streamline release
- Monitor the pace of your product release with burndown charts
- Sync your Gantt chart with development tools like Jira and Azure DevOps
Aha! pricing
- Product management tool from $59/user/month
- Additional tools are available as add-ons, such as Aha! Ideas, Aha! Whiteboards, Aha! Knowledge, Aha! Develop, and Aha! Academy
- Free trial available
- Learn more about Aha! plans and pricing here
8. ProjectManager
Best for: Teams and project managers looking for a robust project management platform with Gantt capabilities
Built for businesses to better manage and plan projects, ProjectManager is a project management software with strong built-in Gantt chart features. As an overall project management platform, ProjectManager combines Gantt charts with task and resource management as well as reporting tools, making it fitting for more complex projects.
Key ProjectManager features
- Get actionable insights on your Gantt chart with reports and real-time dashboards
- Attach comments, files, and documents to any task on your Gantt chart
- Get automatic email alerts when a team member updates a task
ProjectManager pricing
- Plans starting from $13/user/month
- Three plans available: Team, Business, and Enterprise
- Free trial available
9. Paymo
Best for: Small businesses looking for a project management tool with Gantt chart features
Paymo is a project management software with built-in Gantt chart views to help with project planning. With Paymo, you can use the Gantt chart feature to identify project issues make adjustments before issues arise and monitor overall progress with a bird’s eye view.
Key Paymo features
- Schedule tasks on a timeline, assign responsibility, and create dependencies in a few clicks
- Time tracking tools for desktop and mobile to see how long each task is taking
- Real-time collaboration tools like comments, file sharing, design proofing, and more
Paymo pricing
- Plans starting from $5.90/user/month
- Three plans available: Starter, Small Office, and Business
- Limited free account with fewer features
- Gantt chart view only available with a Business plan
- Free trial available
10. nTask
Best for: Teams looking for a budget-friendly and basic Gantt chart platform
nTask offers end-to-end project management with a simple interface ideal for small teams and startups. By integrating tools like task management, time tracking, and meeting management along with Gantt charts, your team can work more productively and efficiently.
Key nTask features
- Add tasks, dependencies responsibilities, related checklists, and more to your Gantt charts
- Real-time notifications on task status, project progress, and budget management
- Integrates with 100+ different applications to better sync data
nTask pricing
- Plans starting from $3/user/month
- Three paid plans available: Premium, Business, and Enterprise
- Free forever plan with limited basic features
- Free trial available
11. ProofHub
Best for: Project management and collaboration for teams of all sizes
ProofHub is an all-in-one project management platform with features for Gantt chart project planning and tracking. It’s designed for different types of teams looking for a centralized hub for task management, collaboration, tracking projects, and more.
Key ProofHub features
- Gantt chart project view to plan projects and tasks on a timeline
- Additional project views such as Calendar, Table, and Board for more visualization options
- Track time spent on tasks with a timer or enter it manually for billable time reports
ProofHub pricing
- Plans starting from $79/month
- Three plans available: Small team, Large team, Large team plus
- No per-user fee, flat pricing
- Free trial available
12. Gantter
Best for: Teams who want a Gantt tool that integrates seamlessly with Google products
Gantter is a software designed to work seamlessly with Google Workspace and G Suite products that can create Gantt charts with a range of Google integrations. This platform is a solid choice for teams with deeply embedded workflows using GSuite, though the learning curve for others may be steeper.
Key Gantter features
- Community-powered AI recommendations for project suggestions
- Built-in analytics and reporting to track project progress
- Automatically generate work breakdown structures to optimize task dependencies
Gantter pricing
- $5/month/user for all plans
- Available in three options: Gantter Cloud, Gantter for Google Drive, and Gantter for Google Workspace
- Free trial available
13. Instagantt
Best for: Teams looking for a simple and affordable Gantt chart maker
Instagantt is an interactive Gantt chart software without any bells or whistles. Its key purpose is to help companies build simple yet intuitive Gantt charts with a drag-and-drop interface without bogging down the platform with extra features.
Key Instagantt features
- Multiple additional work views like Table, Kanban, Workload, and more
- Set task dependencies by clicking and dragging an arrow from one task to another
- Create and export reports based on your Gantt chart data
Instagantt pricing
- Plans starting from $12/month/user
- Two plans to choose from: Individual and Team
- Free trial available
14. Tiemchart
Best for: Engineering, construction, or consulting firms looking for a Gantt chart tool
Tiemchart is an online project management software built around Gantt charts, project costing, billing, and team collaboration. Its simple interface and interactive Gantt charts help you break down projects into actionable plans.
Key Tiemchart features
- Time tracking tools to log tasks, billable hours, and timesheet reports
- Create individual task assignments
- In-built financial tools, including profit reporting, time tracking, and project billing
Tiemchart pricing
- Personal demo with a consultant followed by a free trial
- Plans and pricing available on request
15. BigGantt
Best for: Jira users who want a powerful Gantt plugin to improve project management
BigGantt by BigPicture is a Gantt chart tool with deep Jira integrations, making it ideal for users already planning projects on the platform. Jira users can use BigGantt to view tasks with a work breakdown structure on the Jira issue page and create milestones that synchronize easily.
Key BigGantt features
- Create “what-if” scenarios to test changes on your Gantt chart
- Drag-and-drop interface to make handling Gantt charts quick and easy
- Auto-scheduling to keep your tasks and project on track
BigGantt pricing
- Pricing by request
- Free trial available
16. OnePager
Best for: Teams already using Microsoft Project who want a one-time Gantt chart tool purchase
OnePager is a Gantt chart software designed to work with Microsoft Project with connections to other project management tools like Asana, Project Online, Smartsheet, and more. With OnePager, teams can create project timelines and Gantt charts in minutes that can be used in PowerPoint presentations.
Key OnePager features
- Import and export files to and from multiple platforms like Excel, Adobe Workfront, Jira, and others
- Communicate with your team by grouping and sorting project graphics for subprojects
- Gantt charts are always instantly updated with the latest project data
OnePager pricing
- Pricing starting from $499 for a one-time license
- Three plans to choose from: OnePager Express, OnePager Pro, and OnePager Bundle
- Free trial available
17. Apptivo
Best for: Businesses looking for a solution that integrations CRM with Gantt chart functionality
Apptivo offers a suite of CRM and project management apps, including an intuitive Gantt chart tool that fits with other Apptivo applications. For businesses who want to manage customer relationships alongside project tasks, the Gantt chart feature helps users visualize project timelines and track progress within the context of customer data and interactions.
Key Apptivo features
- Automatically calculate your project schedule with time-tracking tools
- Project billing for easy invoicing based on hours, milestones, or a flat rate
- Implement approvals for tasks from customers or managers
Apptivo pricing
- Plans starting from $20/user/month
- Four plans to choose from: Lite, Premium, Ultimate, and Enterprise
- Free trial available
18. Toggl Plan
Best for: Teams looking for a simple and visually appealing Gantt chart and time-tracking tool
Toggl Plan offers beautiful visuals and project management tools for collaboration, time tracking, and budget management. The platform makes it incredibly easy to create customizable Gantt charts with a drag-and-drop interface. Toggl Plan is a great solution for teams who need a simple Gantt chart tool but may not be robust enough for more complex projects.
Key Toggl Plan features
- Collaborate with team members through notes, comments, checklists, and file attachments
- Share a read-only version of your Gantt chart with stakeholders
- See your team’s availability at a glance including days off, work capacity, and more
Toggl Plan pricing
- Plans starting from $8/user/month
- Two plans available: Team and Business
- Free trial available
19. GanttPRO
Best for: Teams of any size looking for professional and comprehensive Gantt chart software
GanttPRO helps teams plan, organize, track project progress, and assign tasks and responsibilities to ensure they meet deadlines. The tool offers a variety of features including collaboration, task dependencies, time tracking, and integrations with other tools. GanttPro is capable of handling simple tasks or complex projects, making it fitting for a variety of needs.
Key GanttPro features
- Collaborate in real time for better visibility into your projects
- Share private link to your Gantt chart with stakeholders or in a downloadable diagram
- Log the time you spend on tasks and milestones to better track workload and progress
GanttPro pricing
- Plans starting from $7.99 user/month
- Four plans to choose from: Basic, Pro, Business, and Enterprise
- Free trial available
20. Agantty
Best for: Easy and clear project management for small and medium teams
Agantty is a cloud-based project management tool that offers a simple Gantt chart interface. With a single account, you can administer unlimited tasks and teams to keep track of all your projects in one place. It’s open-source, so a good fit if you’re willing to dig in and customize the software to your needs.
Key Agnatty features
- Drag-and-drop Gantt chart format that makes tasks easy to organize into groups
- Create as many teams as you need and invite unlimited members to join
- High safety standards with servers located in Germany
Agnatty pricing
- €4,90/month/user or €50/year/user
- Free trial available
Other Gantt chart tools to consider
Aside from the more widely-known Gantt chart tools above, there are several other options available that may also cater to specific needs. Below are some extra Gantt chart tools that are lesser-known or aren’t as heavy in Gantt chart capabilities but may still be a good fit for your project management needs:
- LiquidPlanner: A predictive project management software that adjusts timelines based on priority and available resources and adapts to changes to avoid risk and uncertainty
- TeamBoard: An all-in-one solution for project management with Gantt charts, scheduling, and resource management for teams using Jira
- Nifty: This project management tool includes Gantt charts, milestone tracking, team collaboration tools, and more and is suitable for improving project visibility
- Zoho Projects: As part of the Zoho suite of products, this tool includes robust for visualizing projects on Gantt charts and integrates seamlessly with other Zoho apps
- Ganttify: This project management solution instantly creates custom Gantt charts in seconds based on your existing projects from platforms like Basecamp, Todoist, or Trello
- ProProfs Project: An online project management tool with a Gantt chart view for tracking project progress as well as collaboration and time tracking tools to manage your team
How do you choose the right Gantt chart tool?
Choosing the right Gantt chart tool comes down to deeply understanding your team’s unique needs alongside the complexity of your projects. Before you even consider using a free trial from a specific Gantt chart solution, first follow the steps below to make sure you’re clear on your needs for new software so that you can find a tool that closely aligns with your goals.
- Assess project complexity: Determine the size and complexity of your projects overall. For simple projects, a basic tool without tons of additional features may be enough, but if you’re regularly working on more involved projects with many subtasks, dependencies, and team members, consider a more robust option.
- Identify collaboration needs: Consider how your team collaborates. If your projects need heavy collaboration along with many integrations, look for a tool that has enough features and integration capabilities.
- Check integration requirements: Evaluate the tools your team uses regularly and consider whether your team will need to use them in tandem with a Gantt chart tool. When shopping around for software, look for the ones that offer seamless integrations with those tools.
- Consider your budget: Review your monthly and annual budget and look for tools that align with those constraints. That said, it’s also important to consider value, since while some options may seem cheaper, they may not have the functionalities you need, which could mean a more costly switch over to a new platform in the future.
- Test out different options: Most Gantt chart tools offer free trials, so make a shortlist of the platforms that fit your needs and budget and involve your team in testing them out then make a decision that best fits your team preferences and project requirements.
Pros and cons of using a Gantt chart
Gantt charts aren’t the only option for visualizing project tasks and progress. In project management, there are many other work views and methods that teams employ to manage their work. For some teams, Gantt charts are the best option, while for others they’re not the right fit. Here’s a look at some of the pros and cons of Gantt charts so you can decide if this is the right direction for your needs.
Gant chart pros
- Visual clarity: Gantt charts offer a clear visual representation of project tasks on a timeline while also showing dependencies. This makes it easier to see progress at a glance and better understand where bottlenecks are occurring
- Improved planning: When you map out tasks, deadlines, and milestones, projects can be planned more effectively. It’s easier to forecast timelines and resources when everything is laid out clearly on a Gantt chart
- Enhanced collaboration: Gantt charts make communication and collaboration easy by keeping all team members on the same page. This transparency keeps everyone aligned and helps members better understand their responsibilities and how their work impacts forthcoming tasks
- Task prioritization: Seeing tasks in a sequence can help teams prioritize work. By focusing on critical tasks that impact a project’s timeline, you can improve your team’s overall efficiency and productivity
Gantt chart cons
- Can be complex for larger projects: When Gantt charts become too loaded with tasks, subtasks, dependencies, and responsibilities, they can become difficult to manage. Charts may become difficult to read at a glance and maintain, leading to confusion
- Time-consuming updates: As your project evolves, Gantt charts need regular updates to reflect changes in timelines, resources, or tasks. If not updated regularly, this can become disordered for team members and lead to miscommunication
- Rigid structure: Gantt charts are often thought of as being too rigid. Once a project plan is set, it can be cumbersome to make updates when the chart is regularly updated, making it not the most ideal option for projects that require flexibility
- Too strict on deadlines: Gantt charts can sometimes overemphasize deadlines, which can detract from your team’s focus on delivering quality work. This can lead to unnecessary stress and compromise the overall success of a project
7 Tips to make your Gantt charts more efficient
Once you’ve chosen the right platform for your business to design your Gantt charts, your work has just begun. Aside from filling out the chart with tasks, deadlines, and dependencies, there are other ways to be mindful when it comes to making the most out of your software. Below are a few tips and best practices to make using your Gantt charts as efficient as possible.
1. Always start with a clear plan
Before diving straight into creating a Gantt chart once you’ve chosen a software, make sure you have a clear project plan to implement. This will help you avoid wasting time and resources and ensure you have a clear idea of project scope, deliverables, and how to format your chart to reach your goals.
2. Break down projects into manageable chunks
Don’t overwhelm your Gantt chart with tons of large tasks. Instead, break down each phase of a project into smaller, more manageable tasks and subtasks. Make sure you’re also applying dependencies correctly so it’s clear to everyone which tasks need to be completed first.
3. Maximize your use of available features
Whether it’s milestones, time tracking, or communication tools, these features are there for a reason and will help you organize your workflow. Incorporate milestones to signify important deadlines, rely on communication features to keep your team on the same page, and track time to ensure the project schedule is followed.
4. Set automations to take care of repetitive tasks
Functions such as notifications, status changing, or moving completed tasks to the next relevant team member may seem quick and easy, but when there are a lot of them keeping track of them all can be time-consuming and cumbersome. Automations help you keep things moving at a good pace so that you don’t need to waste resources handling manual and repetitive tasks.
5. Integrate other work tools
Most Gantt chart software can be integrated with your existing tools. To make all your work processes smoother, make sure your software is integrated with other platforms like development tools, accounting software, or customer service platforms to keep all project data centralized.
6. Incorporate buffer time
If your project timeline allows for it, it’s a good idea to include buffer time between tasks to account for potential delays or unexpected roadblocks. This will help keep your project flexible so that if one task has a minor setback, the entire project’s timeline isn’t derailed.
7. Regularly review and update your chart
Set a time at a regular interval, whether it’s weekly, monthly, or quarterly, to review your Gantt chart and see if it can be cleaned up for greater accuracy and clarity. Involve other tea members in this process and get feedback on improvements that can be made over time.
Easily create complex Gantt charts with monday work management
As we’ve seen above, there’s no shortage of Gantt chart software options on the market. However, if you’re working on multiple projects, require plenty of flexibility, and don’t want to lose out on powerful features, you may want to consider a tool such as monday work management, which allows you to create a Gantt chart in minutes that can handle even the most complex project.
With monday work management, getting started is easy since there are so many templates that allow you to import project data directly from Excel or another platform. In addition to robust Gantt charts full of functionalities to help you keep projects on track, monday work management is full of other helpful project management features. Let’s take a look at a few of them.
Dozens of different work views
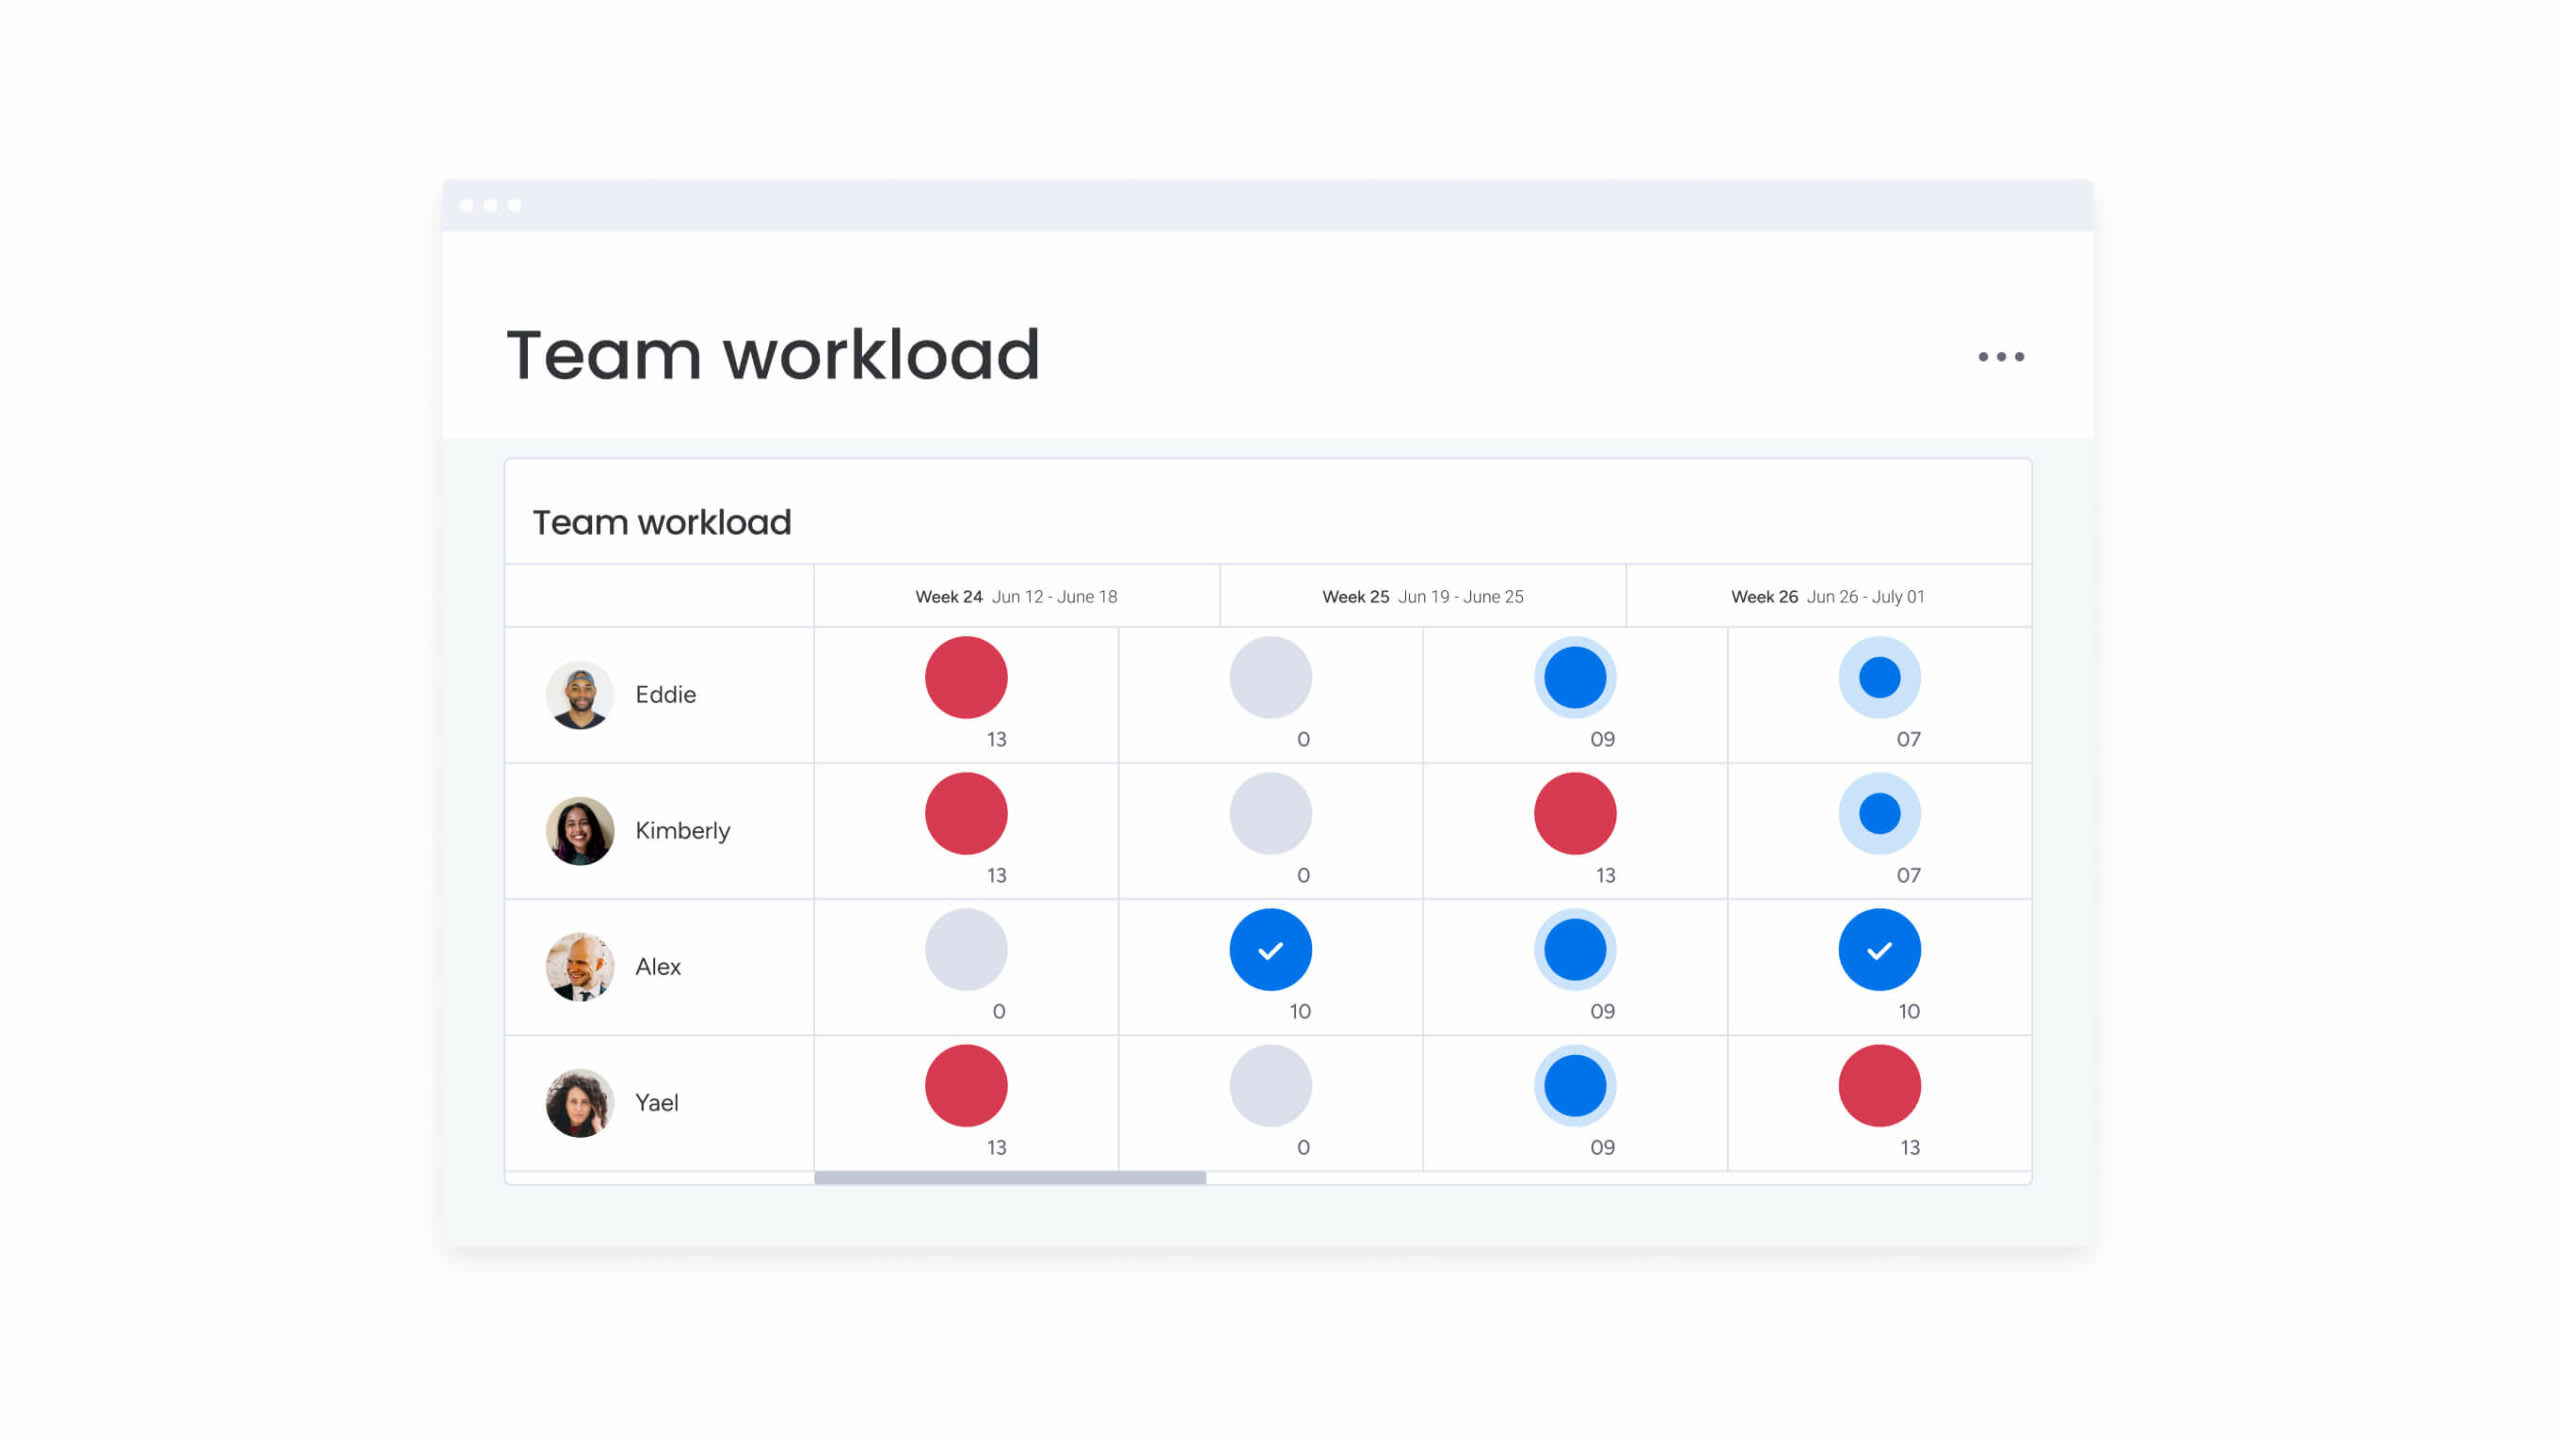
Each member of your team can work their way with monday work management’s 27 different work views. Aside from a Gantt chart, you can choose to view your project on a Kanban board, in a timeline, on a calendar, by workload, and more. Toggle between different views in just a click so your project management stays flexible.
No-code automations
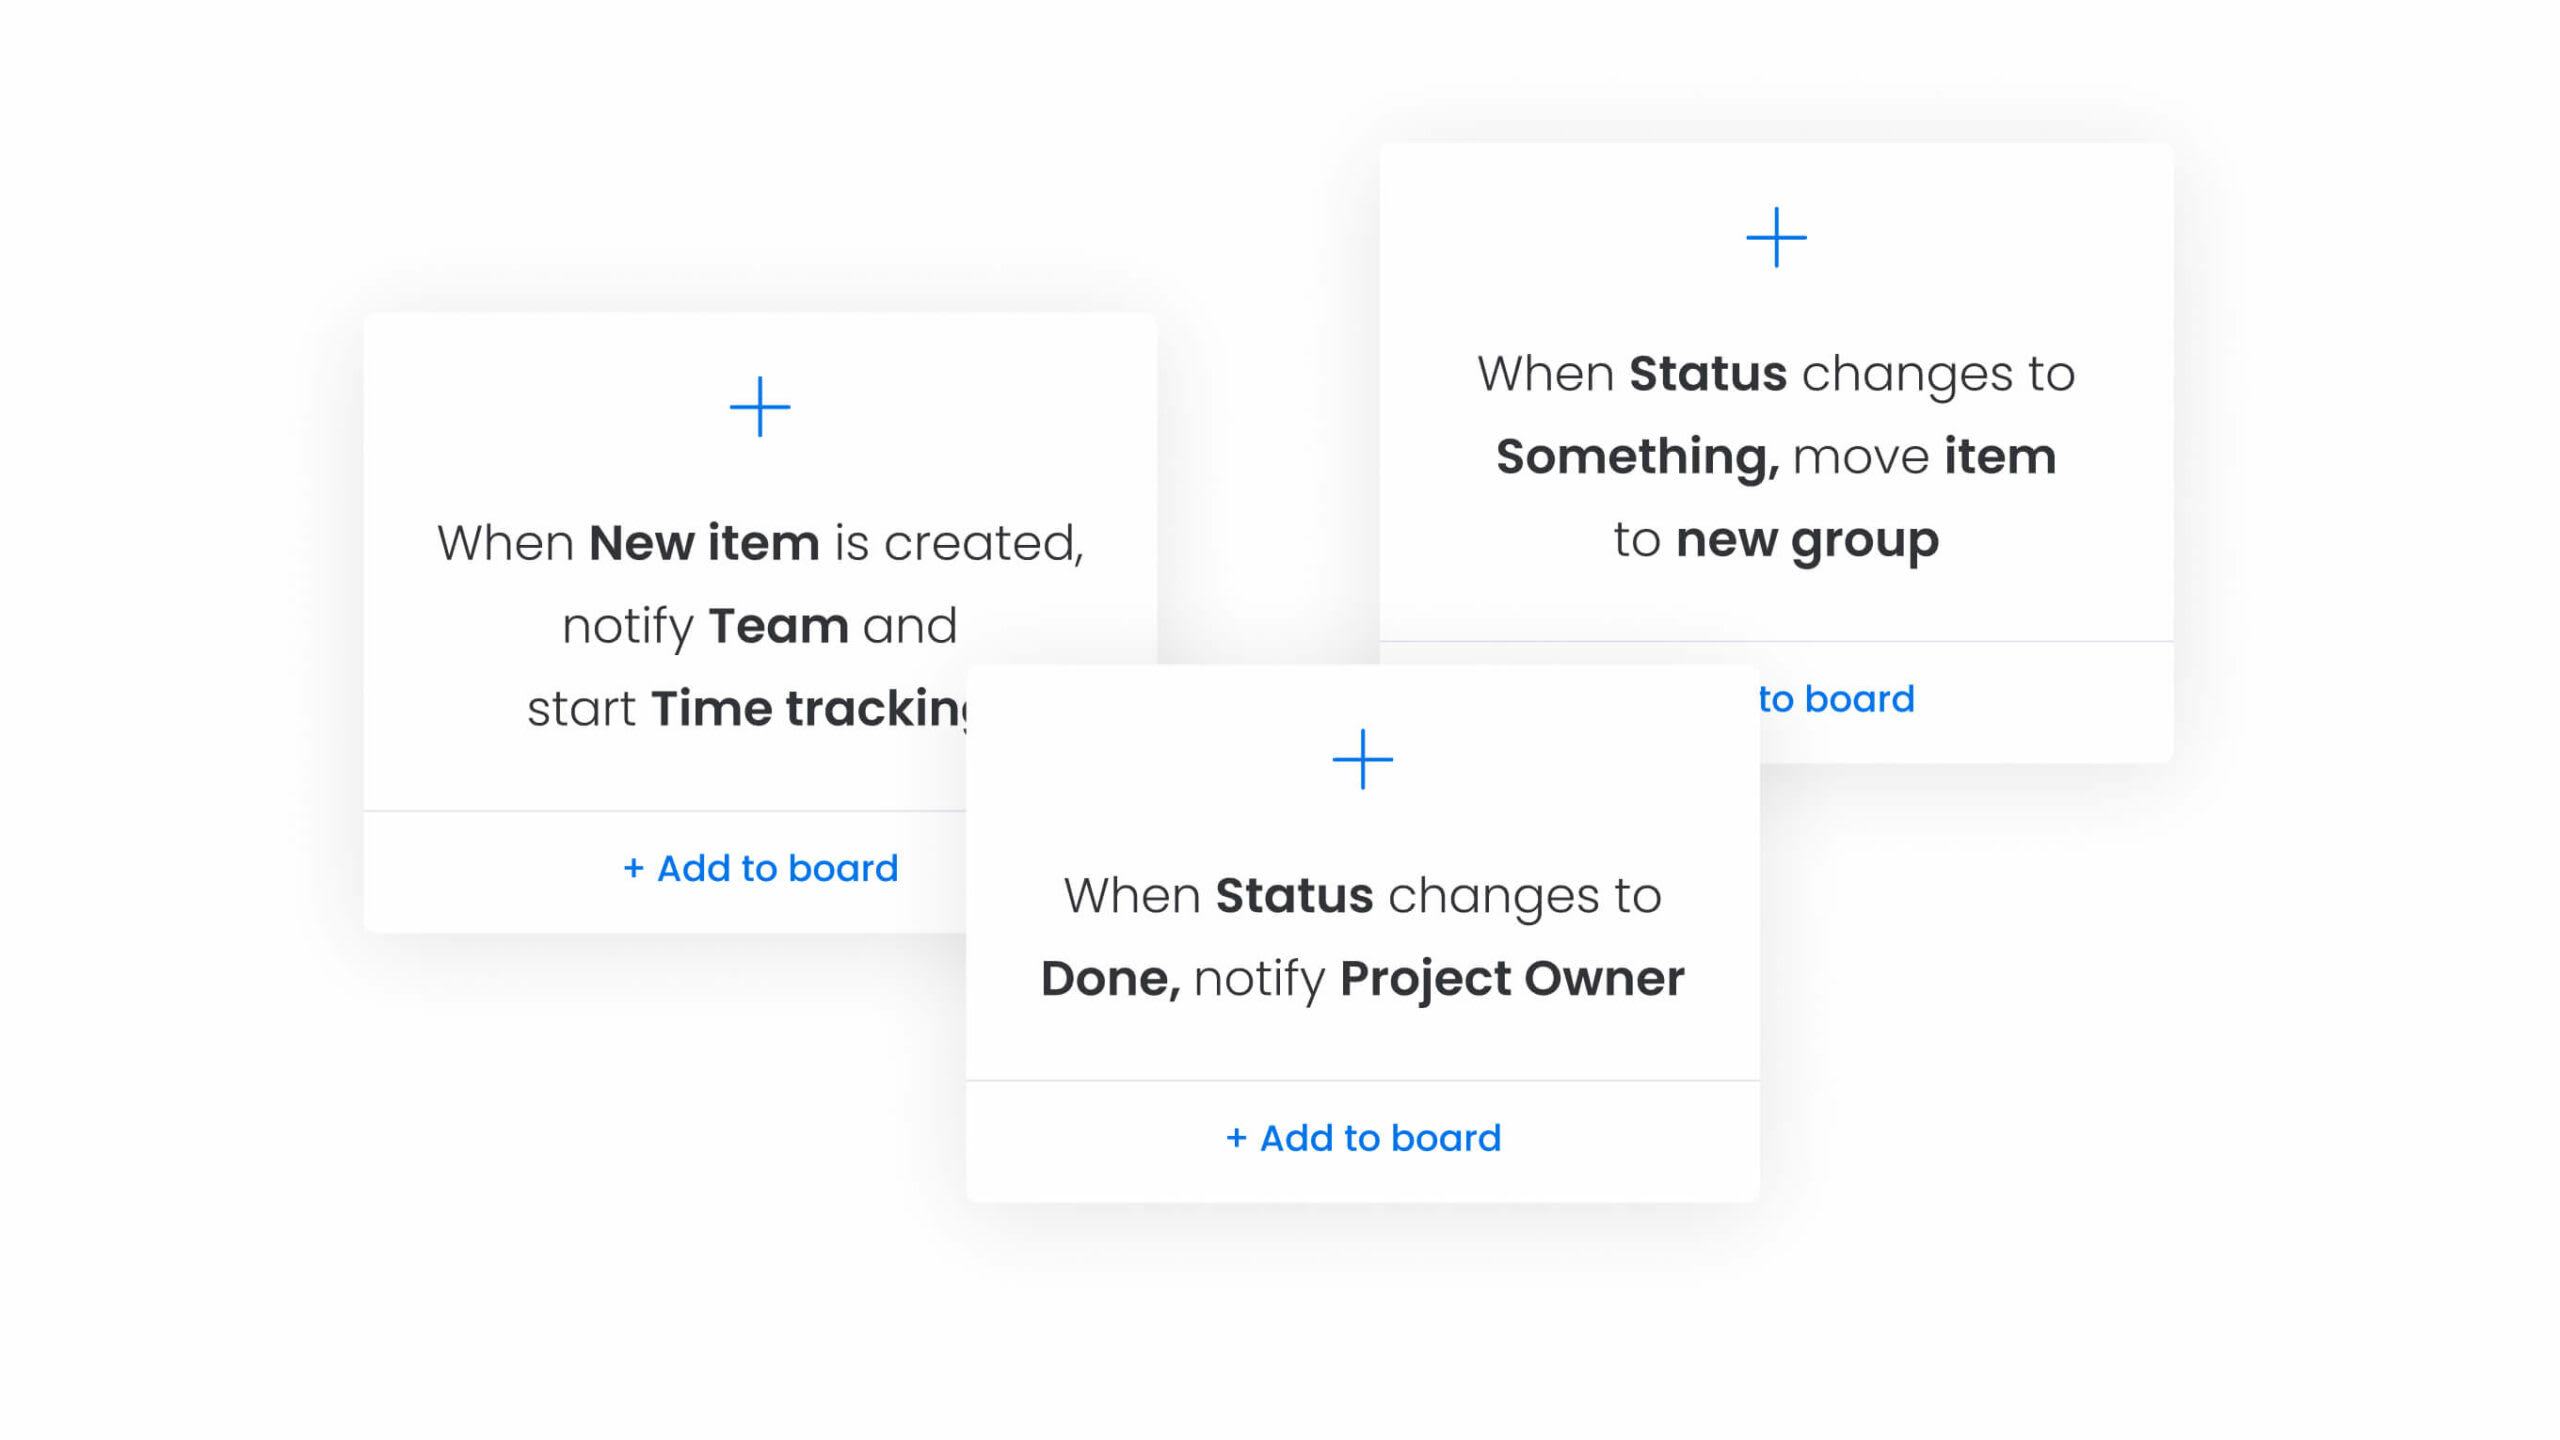
With monday work management, building the automations you want to improve your workflow can be done in seconds. Build your own no-code automations in seconds by setting the parameters you want to get notifications, send reminders, move tasks to different boards, and more.
Connect all your tools in one place
There are over 200 integrations to choose from to synchronize data from your Gantt chart with your existing work platforms. Choose from the most popular work tools like Google apps, Slack, DropBox, Zoom, MailChimp, Microsoft Teams, and others so you can continue working with the tools you love.
Get startedTake your project management to the next level with monday work management
Whether you’re looking for a simple Gantt chart creator or an in-depth work OS with customizable Gantt capabilities, monday work management has something for every team. The platform is simple enough to handle the most basic projects and robust enough to tackle the most complex projects. With monday work management, you can scale the platform to your needs, so your project management tool grows alongside your team.
FAQs
What is the best Gantt chart software?
The best Gantt chart software depends on your specific project requirements, the size of your team, and your budget. We recommend that go with a solution like monday work management that includes features such as the ability to add project milestones, task dependencies, and customizable templates to streamline your processes.
What can I use instead of a Gantt chart?
If Gantt charts don’t provide the best overview of your project, there are some alternatives you can try. For example, a Kanban board, project map, or timeline view can be a good way to track tasks, deadlines, and project progress.
Can you make a Gantt chart in Excel?
Making a Gantt chart in Excel is possible, but requires manual adjustments and lacks advanced features of Gantt chart software, like time tracking and automations.
Does Excel have a project plan template?
Yes, you can find different project plan templates in Excel, however, while these templates can be customized they don’t offer additional features like project management software does.
When should you avoid using a Gantt chart?
If you’re looking for a project management tool for just a couple of tasks or to plan out resources specifically, Gantt charts may not offer what you need. These charts of often rigid and are better suited for multi-task projects.