


A late or skipped task can throw your entire project schedule out of whack. If a developer misses a handoff, for example, testing starts late, and you can’t launch until that testing is complete. Each of these task dependencies hold the key to project success. And a Gantt chart with dependencies lets you see and understand how they all fit into the bigger project picture.
This guide defines Gantt chart dependencies in more detail, walks through the four dependency types with examples, explains why they drive your schedule, and shows how to visualize them step by step. We’ll also look at how monday.com’s AI Work Platform automates dependency tracking so your timeline updates itself when plans change.
Key takeaways
- Dependencies define the order of work by describing which tasks rely on other tasks to start or finish.
- There are four dependency types: finish to start, start to finish, start to start, and finish to finish.
- Dependencies shape your project schedule, because a delay on one linked task can push every task that follows it.
- A Gantt chart visualizes dependencies as arrows between task bars, making the critical path easy to spot.
- monday.com’s AI Work Platform automates dependency management, reschedules linked tasks when a predecessor slips, and flags at-risk work before deadlines are missed.

What is a Gantt chart with dependencies?
A Gantt chart is a visual timeline that helps you manage tasks and plan projects. Made up of horizontal bars, it represents tasks stretched across a timeline, with each end of the task bar depicting a start and end point for its task. Gantt charts give stakeholders a clear view of how long each task takes and how those timelines impact the larger project scope.
A Gantt chart with dependencies captures the essence of an entire project and its timetable by showing the relationships between each and every task. This makes identifying potential roadblocks and forecasting resources much more efficient. Project managers and teams can easily see how each task flows into the next one and what resources are necessary to keep things moving. This is especially important for complex projects involving large teams and successive task completions.
The value increases as your projects scale. On a five-task plan, you can hold the sequence in your head. On a fifty-task plan spanning several teams, the dependencies are the only reliable record of what waits on what. When someone asks whether a missed vendor delivery threatens the launch, the linked chart answers in seconds instead of a round of emails, because the relationship is already drawn.
How do you show dependencies on a Gantt chart?
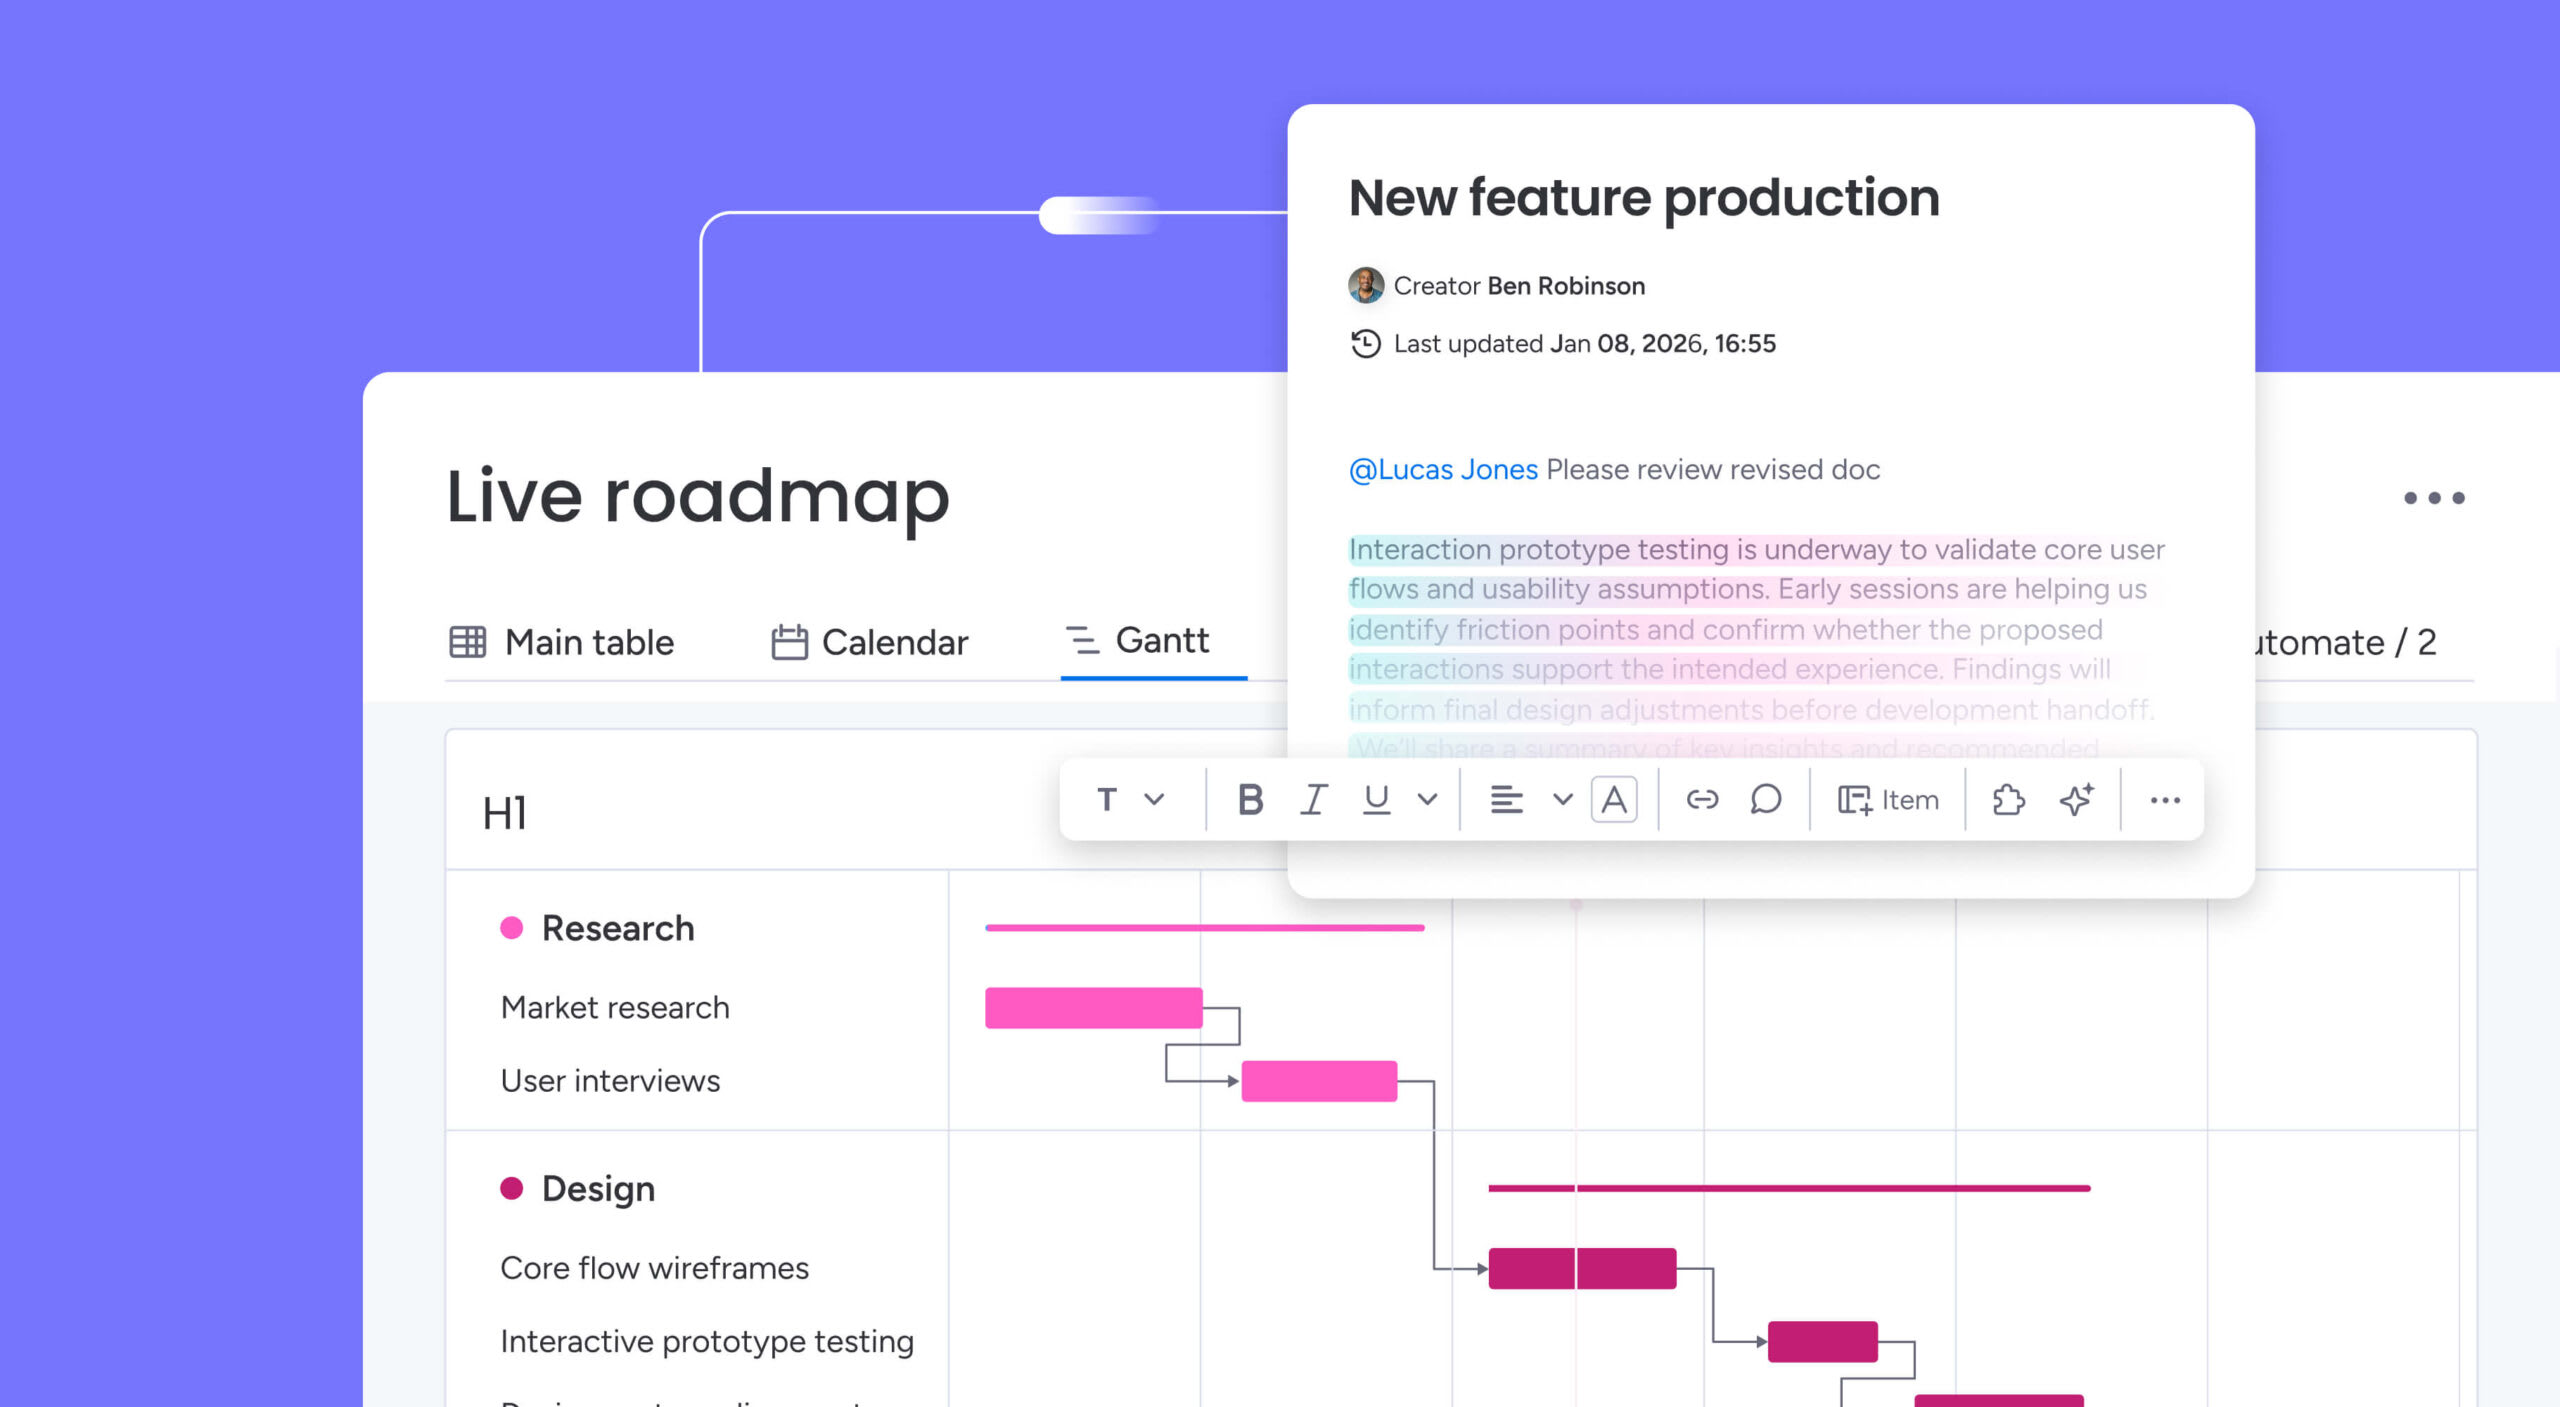
Dependencies appear as arrows linking task bars, drawn from the predecessor (the task that comes first) to the successor (the task that waits on it). The direction and connection point of each arrow tell you the dependency type, so anyone reading the Gantt chart can see the sequence at a glance without reading a single row of task notes.
The difference between a Gantt chart and its static bar chart alternative is that the Gantt chart with dependencies tells you why they happen in that order, which means you can trace a delay backward to its cause and forward to everything it affects.
What are project dependencies?
Project dependencies describe the relationships between tasks and activities within a project. Imagine for a second that you’re making a peanut butter sandwich. It doesn’t matter if you have the peanut butter and a knife, if you don’t have the bread to spread it on. In fact, every task you encounter, whether in your personal life or the workplace, has a dependency. Now, let’s put that same principal to work in terms of projects.
Dependencies are present in almost every aspect of project management. For example, a stakeholder must approve the output of a project task before the team can work on the next task.
If any tasks in the critical path are delayed or modified, it can impact the entire project, from budget to deadlines. This is why organizing project dependencies is so important. The critical path is the longest chain of dependent tasks in your plan, so it sets the shortest possible time to finish the project and shows you exactly which delays you can’t afford.

4 types of Gantt chart dependencies
Project dependencies are basically scheduling dependencies that define the timing relationship between two tasks. Before you map them, it helps to know the two roles every dependency involves: the predecessor is the task that has to happen first, and the successor is the task that depends on it. Every dependency type below describes a different way those two tasks connect. The common types are:
- Finish-to-Start: This is the most common type of Gantt chart dependency. In the finish-to-start scenario, an initial task must be completed before the next task can begin. For example, a contract must be signed between parties before work on a project can begin.
- Start-to-Finish (SF): Task B must begin before task A is completed. For example, if your workplace is replacing its old security system (Task b), the old system needs to be removed (Task B) before the new system can be installed.
- Start-to-Start (SS): Task B can’t begin until task A has also started. For example, if your IT department needs to roll out new software to all computers in the network (Task A), they’ll need to test that software. They can’t test it before it’s rolled out, but they have to have the means to test it available before the rollout completes.
- Finish-to-Finish (FF): In finish-to-finish, a team can finish task B only after task A has been finished. In this case, it’s possible for the two tasks to run in parallel, but the second task (in this example, task B), is only able to be entirely complete until after task A is completely done.
Each type answers a slightly different scheduling question, so it helps to picture where each shows up. Finish to start governs sequential work like design before build. Start to start suits tasks that ramp up together, such as coding and writing test cases. Finish to finish fits work that must wrap up in sync, like data migration and final validation. Start to finish is the rarest, and it usually appears when a new process can’t close out until its replacement is running. Choosing the right type keeps your timeline honest instead of forcing every task into a single rigid line.
Real projects rarely run on perfectly back-to-back tasks, so two more terms round out how dependencies behave. Both describe the timing gap or overlap between a predecessor and its successor:
- Lead time: Lead time lets a successor task start before its predecessor fully finishes, creating a deliberate overlap. For example, a writer can start drafting a section while research on later sections is still wrapping up.
- Lag time: Lag time adds a required delay between two linked tasks. For example, after you paint a wall, you build in a day of drying time before the next task can begin.
Pro tip: want to use Gantt charts to the fullest? Check out our guide on the best Gantt chart software.
Categories of project dependencies
Each type of project dependency also falls into a specific dependency category. The most common categories are:
- Logical dependencies: Logical dependencies are the natural flow of tasks required to complete a project — the critical path. They’re the starting point and the output for all previous tasks. Going back to the peanut butter sandwich analogy, you can’t make the sandwich unless you have all the necessary ingredients and tools, such as bread, peanut butter, and a knife.
- Resource dependencies: These dependencies describe the shared project resources necessary to complete a project. When two activities share a resource dependency, each depends on the other for completion.
- Preferential dependencies: Occasionally there are tasks that, when completed, add to the overall value of the project but aren’t mission-critical. These are known as preferential dependencies. For example, you may choose to implement a new calendar app for project planning, but it’s use won’t make or break the system already in place.
- External dependencies: Lastly, tasks that depend on variables or resources that the team has no control over are described as external dependencies. For example, a clothing store depends on the manufacturer or supplier to deliver the clothes to the store before they can display the clothes and offer them for sale.
Why task dependencies are vital for project scheduling
Task dependencies decide the order your work must run in, and that order determines whether your schedule holds. Get the sequence right and the plan flows. Miss a link and one late task drags everything behind it out of position.
Scheduling discipline is still a common gap. Only 36% of organizations always or mostly complete their projects on time, according to Wellingtone, and plans that never model task dependencies are the likeliest to skip. Mapping which tasks can’t start until others finish is exactly the discipline a strong project schedule depends on.
If you’re managing a project with multiple people involved, Gantt charts are useful tools. Since they let you see all of a project’s tasks in one place, they’re great for monitoring the efforts of individual team members. By accounting for every activity, start and end date, and output, you can more readily adjust resources to keep your project humming along.
Mapping dependencies well solves several planning problems at once:
- Bird’s-eye view for stakeholders: A dependency-linked chart lets higher-ups who aren’t in the day-to-day see how the project is progressing against the timeline.
- Fewer planning errors: Laying out predecessors and successors spots impossible sequences before work starts, not after a deadline slips.
- Scheduling accuracy: Linked tasks show realistic start and finish dates instead of optimistic guesses that ignore what has to come first.
- Easier rescheduling: When one task slips, dependencies show every downstream task that moves with it, so you can adjust the whole chain at once.
- Smarter resource reallocation: Seeing which tasks block others tells you where to shift people and budget to keep the critical path moving.
The cost of skipping this work shows up in project outcomes: missed deadlines, rushed handoffs, and rework. Wellingtone’s annual State of Project Management research tracks these delivery challenges across the industry year after year. Dependencies won’t fix every risk, but they remove one of the most avoidable ones: teams starting work that isn’t ready or missing a handoff that should have been obvious on the timeline.
Mapping dependencies also strengthens the case you make to leadership. A clear, visual timeline shows executives how the work connects, making it easier to justify more resources and win support for realistic deadlines, all in a single tool.
How to show dependencies in a Gantt chart in 5 steps
Showing dependencies in a Gantt chart is a repeatable part of solid project scheduling. Here are the five steps to complete the sequence.
- List your tasks and durations: Break the project into individual tasks and estimate how long each one takes. These become the horizontal bars on your timeline.
- Identify predecessors and successors: For each task, decide what has to happen before it and what waits on it. This is where you map the relationships.
- Choose the dependency type: Assign finish to start, start to start, finish to finish, or start to finish to each link so the timing rule is explicit.
- Draw the linking arrows: Connect each predecessor bar to its successor bar. The arrows make the sequence visible and show where delays would ripple.
- Set lead or lag and review the critical path: Add any overlaps or buffers, then trace the longest chain of linked tasks to confirm your true finish date.
Example: Say you’re launching a landing page. You list four tasks: write copy, design the page, build it, and run QA. Copy is a predecessor to design, design is a predecessor to build, and build is a predecessor to QA, so you’d link them finish to start down the line. If you let the designer start wireframes while copy is still in review, that overlap is lead time. If QA needs a day for staging to settle before testing, that’s lag. Trace the longest linked chain and you’ve found the critical path that sets your true launch date.
Drawing and updating these links by hand gets slow as projects grow. A modern tool like monday.com’s AI Work Platform auto-draws the arrows as you set relationships and auto-reschedules dependent tasks when a date changes, so the chart stays accurate without manual redrawing.
Managing Gantt chart dependencies with monday.com's AI Work Platform
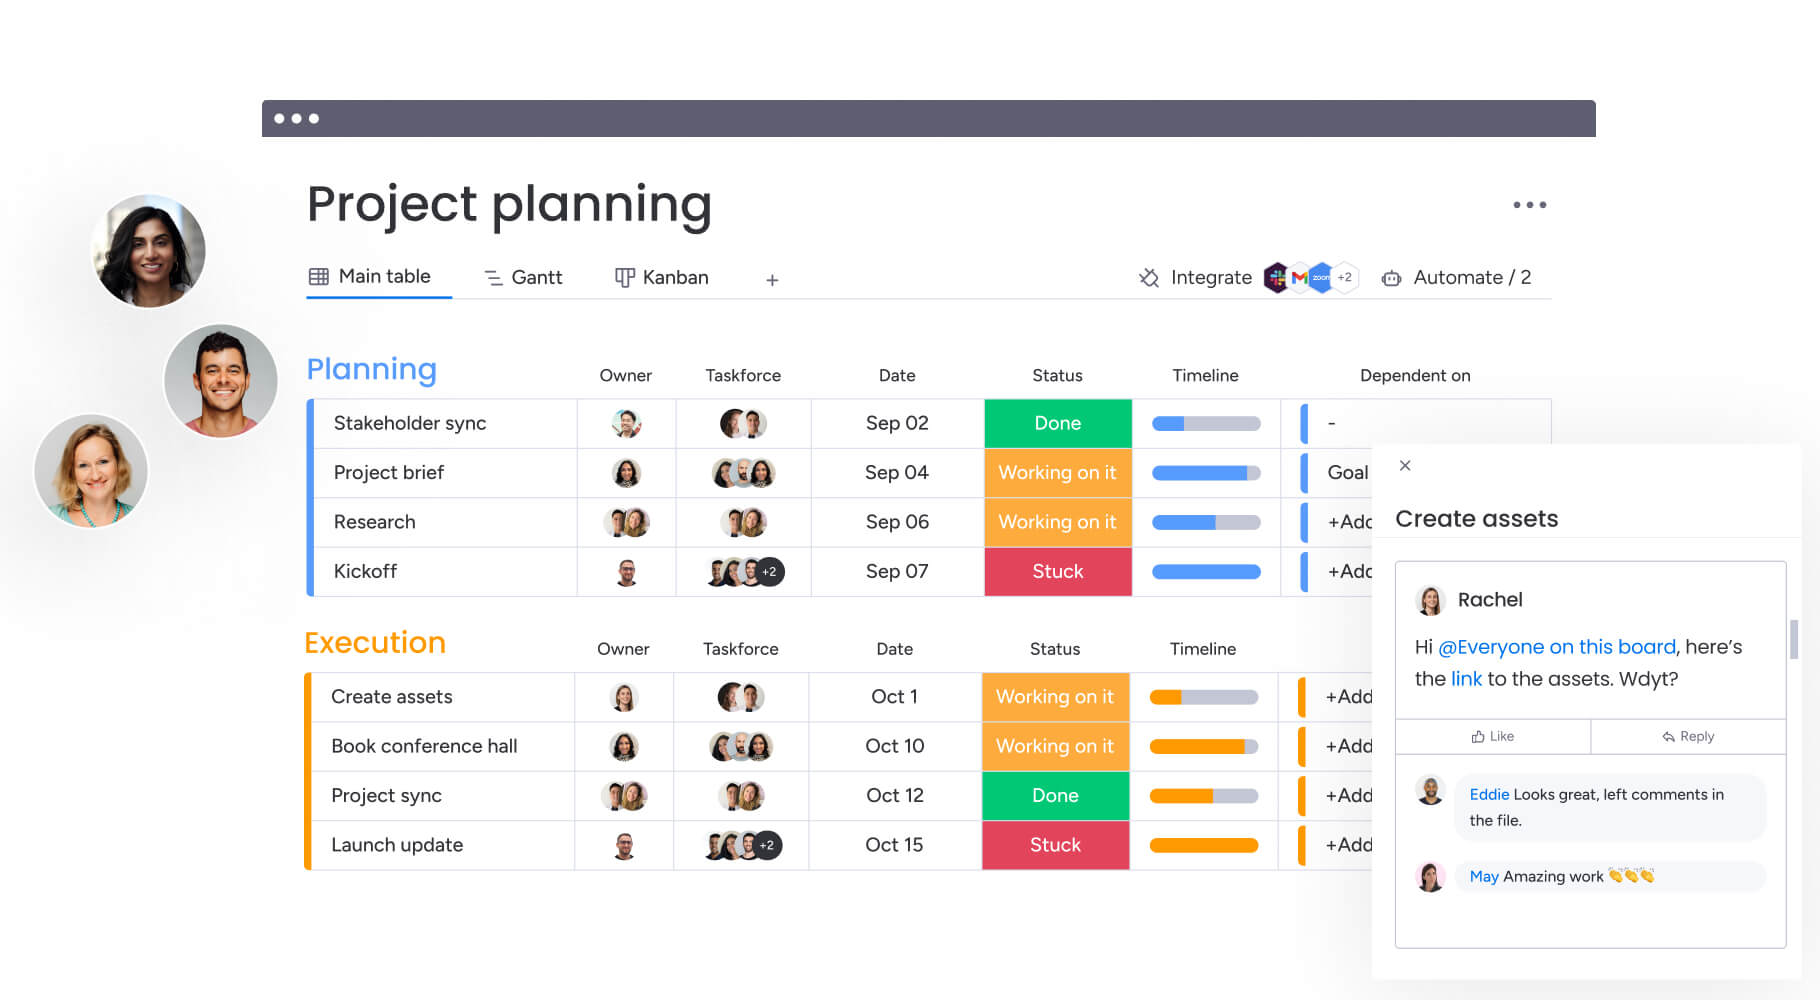
The hardest part of managing dependencies is keeping them current. monday.com’s AI Work Platform treats your Gantt chart as a living document that updates itself when work changes, so dependencies stay accurate without manual maintenance. It lets you:
- See every task relationship in one visual timeline with the Gantt view, which shows tasks, milestones, and the links between them in one place.
- Spot bottlenecks before they spread using the Dependencies feature, which identifies tasks that fall behind schedule and block others.
- Know exactly which delays threaten your deadline through a critical path overlay that highlights the chain setting your finish date.
- Track drift from your original plan with a baseline that compares what you promised against progress.
- Mark the checkpoints that matter most using milestones to anchor your timeline.
- Switch perspectives without rebuilding your data across multiple views, including Gantt, Kanban, Workload, Calendar, and Timeline, all pulling from one board.
- Let the platform handle handoff notifications through no-code automations that alert the next owner when a predecessor completes or slips, so nobody waits on work they didn’t know was ready.
- Give stakeholders a single source of truth with Dashboards that roll portfolio timelines and risk alerts into one view.
- Catch risks before they become blockers using the AI risk analyzer and monday agents, which proactively flag tasks nearing their deadlines.
- Lean on AI assistants to manage dependencies for you through monday MCP, which securely reads and updates task relationships on your behalf.
- Build custom trackers from a simple prompt with monday vibe, whether you need a dependency map or an OKR dashboard.
Here’s how dependency management compares across a manual spreadsheet, a generic project management tool, and monday.com’s AI Work Platform.
| Capability | Excel / manual | Generic PM tools | monday.com's AI Work Platform |
|---|---|---|---|
| Dependency types supported | Manual notation only | Usually finish to start | All four types with lead and lag |
| Auto-reschedule on delay | No, edited by hand | Sometimes | Yes, linked tasks shift automatically |
| Critical path overlay | No | Varies by tool | Yes, built into the Gantt view |
| Baseline vs. actual | No | Limited | Yes, planned vs. actual tracking |
| Automated notifications | No | Basic | Yes, no-code automation recipes |
| AI risk flagging | No | Rare | Yes, AI risk analyzer and agents |
Turn task dependencies into on-time delivery
A Gantt chart with dependencies is a map that tells you which tasks hold the schedule together and which delays you can’t afford to ignore. Once you can see those chains clearly, keeping a project on time becomes far more manageable.
Understanding the four dependency types, the roles of predecessors and successors, and the critical path gives you the language to build that map. Visualizing it in a Gantt chart, then letting monday.com’s AI Work Platform reschedule linked tasks and flag risks for you, turns dependency tracking from a manual chore into a plan that keeps itself current.
FAQs about Gantt chart dependencies
Can you show dependencies in Excel?
Yes, you can show dependencies in Excel, but it requires advanced spreadsheet manipulation. Excel's 2D bar chart lets you create basic Gantt timelines, though linking tasks and updating dependencies in realtime is manual. A purpose-built tool handles dependency tracking more easily.
What are some project dependency examples?
Project dependency examples include software sign-off, where a manager must approve the build before delivery; training the trainer, where instructors complete their own training before teaching others; and system switching, where a new tool launches and is verified before the old one shuts down.
What are project assumptions?
Project assumptions are factors treated as certainties without proof that impact your plan. For example, you might assume your starting team members stay for the entire project. If someone transfers away, the plan must adjust to account for that change.
What is a dependency chart?
A dependency chart is a visual tool that maps relationships between tasks, showing which ones rely on others through connected nodes or linking arrows. A Gantt chart with dependencies is one of the most common dependency chart formats.
How does monday.com's AI Work Platform handle Gantt chart dependencies?
monday.com's AI Work Platform handles Gantt chart dependencies by visualizing them in a Gantt view, auto-rescheduling linked tasks when predecessors slip, overlaying the critical path, and using its AI risk analyzer to flag tasks nearing deadlines before delays spread.

 Get started