


Most sales leaders know their pipeline number by heart, but few can confidently say whether it’s actually enough to hit quota. Pipeline coverage gives you that answer. It’s the ratio of your total qualified pipeline value to your revenue target, showing you exactly whether you have enough deals in motion to close your number.
This guide shows you how to calculate your ideal coverage ratio based on your win rate, track both weighted and unweighted metrics for complete visibility, and use coverage data to forecast accurately, coach effectively, and allocate resources with confidence. You’ll get a practical framework that works whether you’re building coverage tracking from scratch or refining what you already do.
Key takeaways
- Pipeline coverage ratio shows whether you have enough qualified deals to hit your revenue target by dividing total pipeline value by quota.
- Your ideal coverage ratio depends entirely on your win rate; teams closing 25% of deals need 4:1 coverage, while teams closing 50% only need 2:1.
- Unweighted coverage reveals pipeline volume while weighted coverage shows the probability-adjusted value of deals actually closing.
- Pipeline coverage and velocity work together to predict success since a full pipeline that moves slowly can miss targets just as easily as a thin one.
- Real-time tracking by rep, team, and segment with automated alerts helps you identify coverage gaps early and take action before quarter-end using tools like monday CRM.
What is sales pipeline coverage?
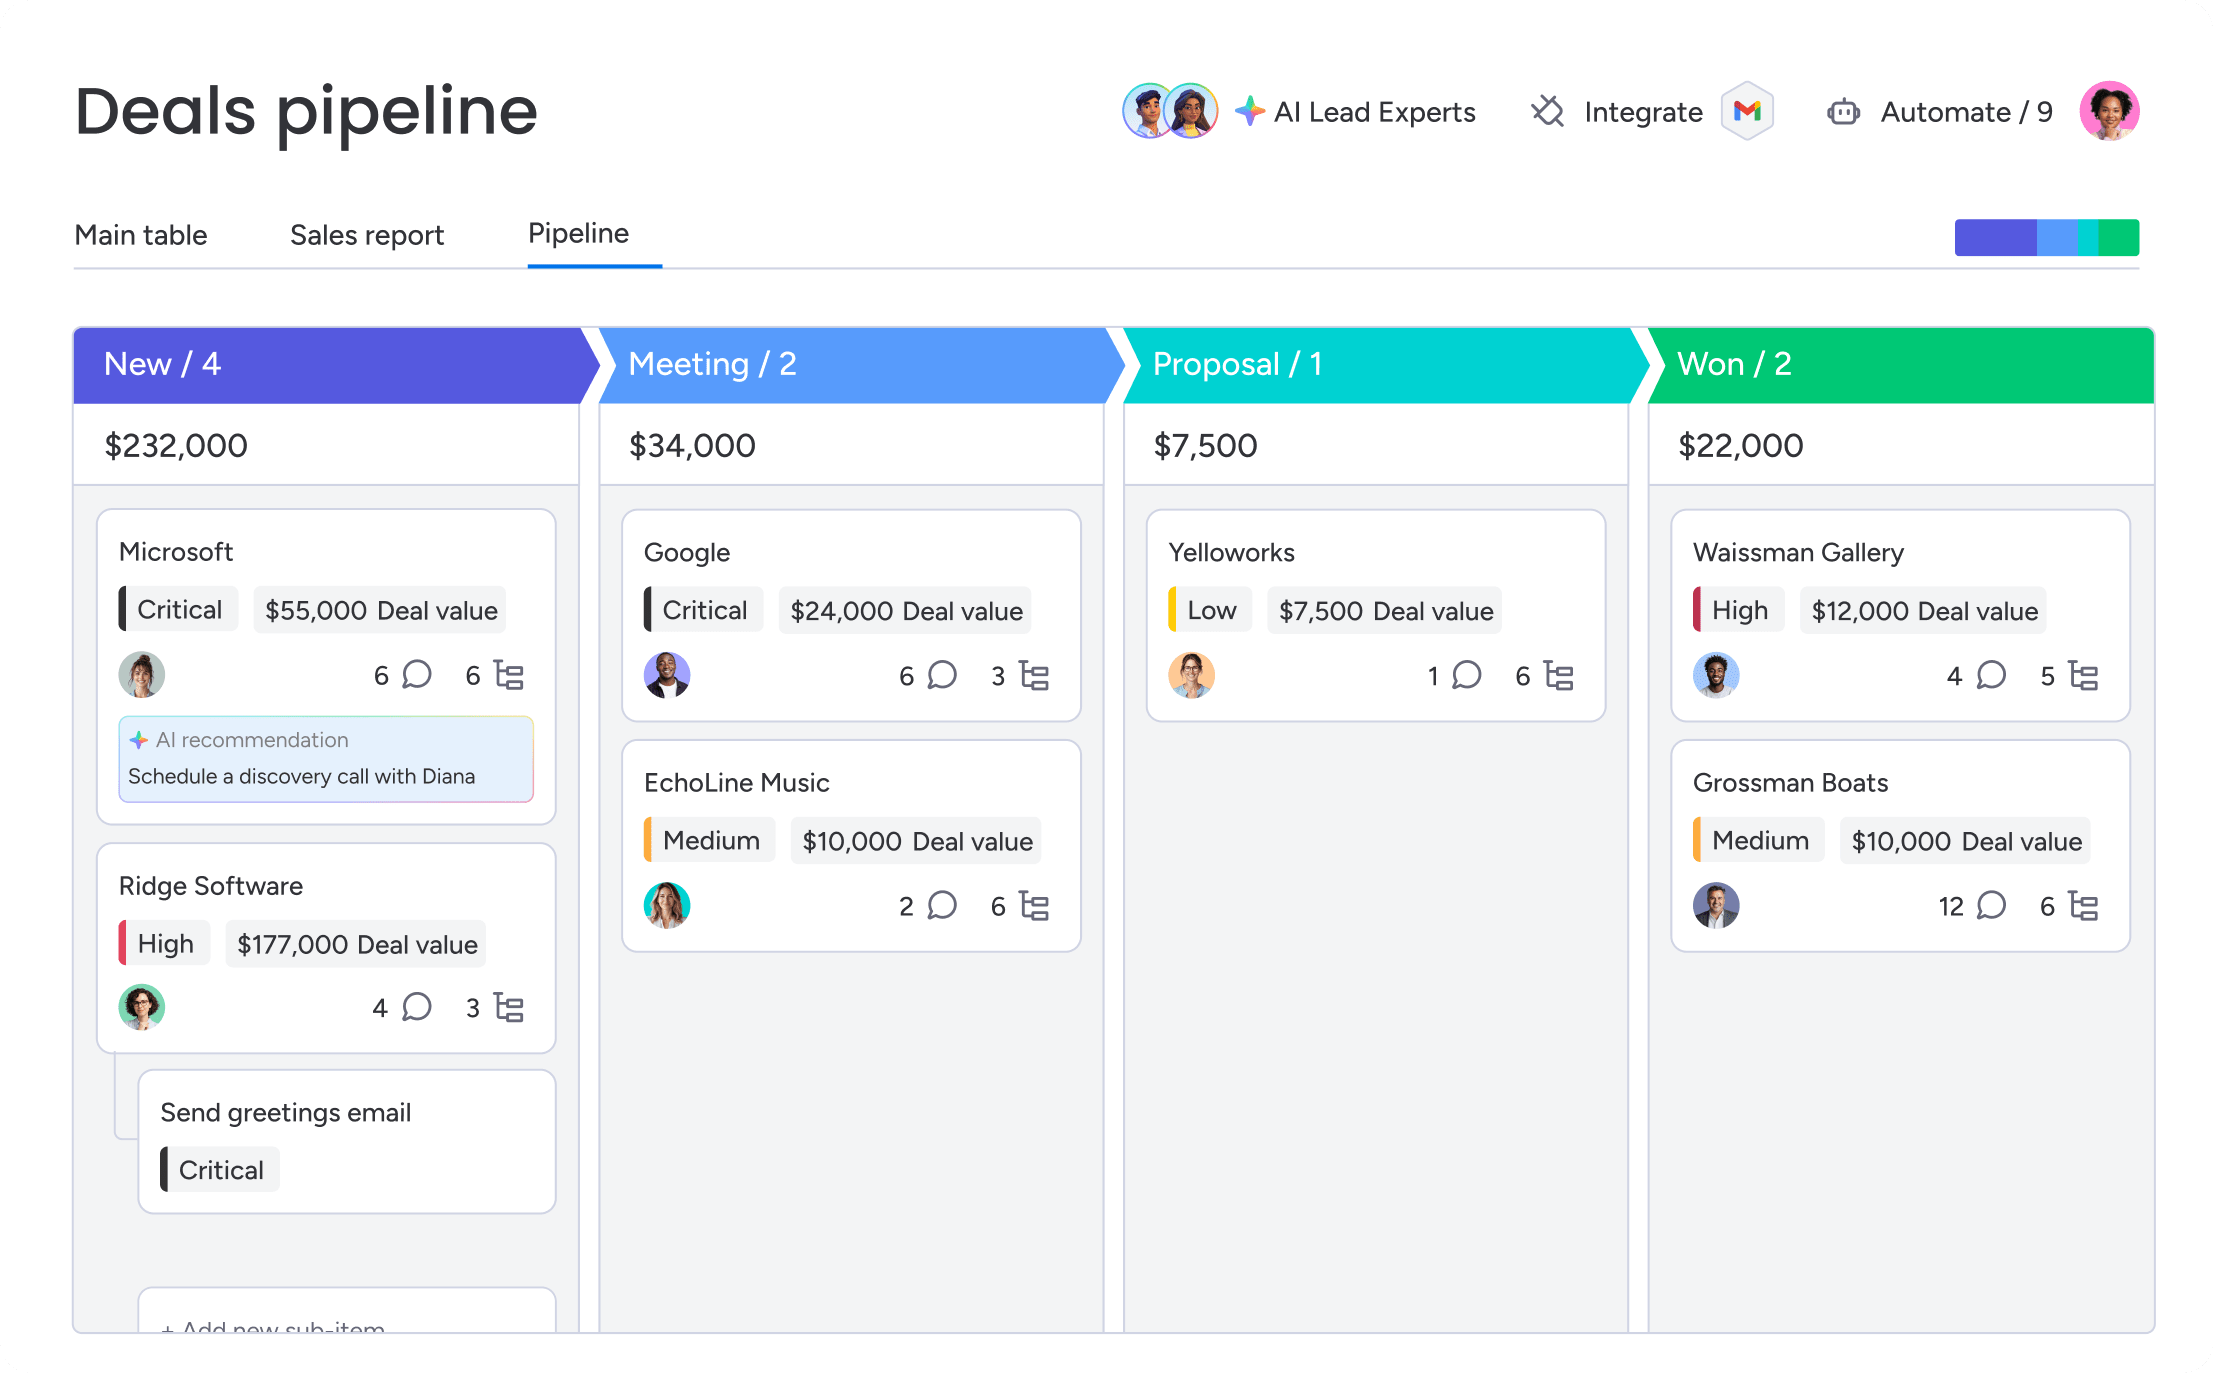
Sales pipeline coverage is the ratio of your total qualified pipeline value to your revenue target for a specific period. Think of it as your revenue safety net, telling you whether you have enough deals in motion to hit your number, even when some inevitably fall through.
Without pipeline coverage, you’re flying blind. You might see $500K in opportunities and feel confident about hitting your $200K target. But if your team typically closes only 25% of deals, you actually need $800K in pipeline to feel secure. That gap between perception and reality? That’s what pipeline coverage reveals.
If you’re juggling forecasts, resource planning, and board decks, pipeline coverage turns guesswork into a number you can trust. It’s the metric that answers the question every sales leader faces: “Will we hit our number this quarter?”
How to calculate pipeline coverage
Calculating pipeline coverage requires just 3 numbers: total qualified pipeline value, revenue target, and a simple division. The formula looks like this:
Pipeline Coverage Ratio = Total Qualified Pipeline Value ÷ Revenue Target
Here’s what goes into each part — and how to make sure your numbers actually mean something.
What counts as qualified pipeline value
Qualified pipeline value means the deals that actually count — the ones that meet your real criteria. These deals should be:
- Actively worked: Opportunities with recent engagement and clear next steps
- Properly qualified: Deals that passed your qualification framework (BANT, MEDDIC, or similar)
- Time-bound: Opportunities expected to close within your measurement period
Here’s what counts and what doesn’t:
| Include in pipeline | Exclude from pipeline |
|---|---|
| Opportunities in active sales stages | Unqualified leads |
| Deals with verified budget and authority | Closed-lost opportunities |
| Opportunities with close dates in period | Stale deals with no recent activity |
| Deals meeting qualification standards | Nurture accounts on hold |
Pipeline hygiene matters here. Inflated deal values or stale close dates? They’ll wreck your coverage ratio and kill your forecast accuracy.
How to set a revenue target that matches your pipeline
Your revenue target? That’s what your team needs to close in the period you’re measuring. Monthly, quarterly, annual — whatever you pick, make sure it matches your pipeline timeframe.
Your target has to match your pipeline timeframe. If you’re measuring Q2 pipeline coverage, use Q2 quota. Mix timeframes and your numbers won’t mean anything.
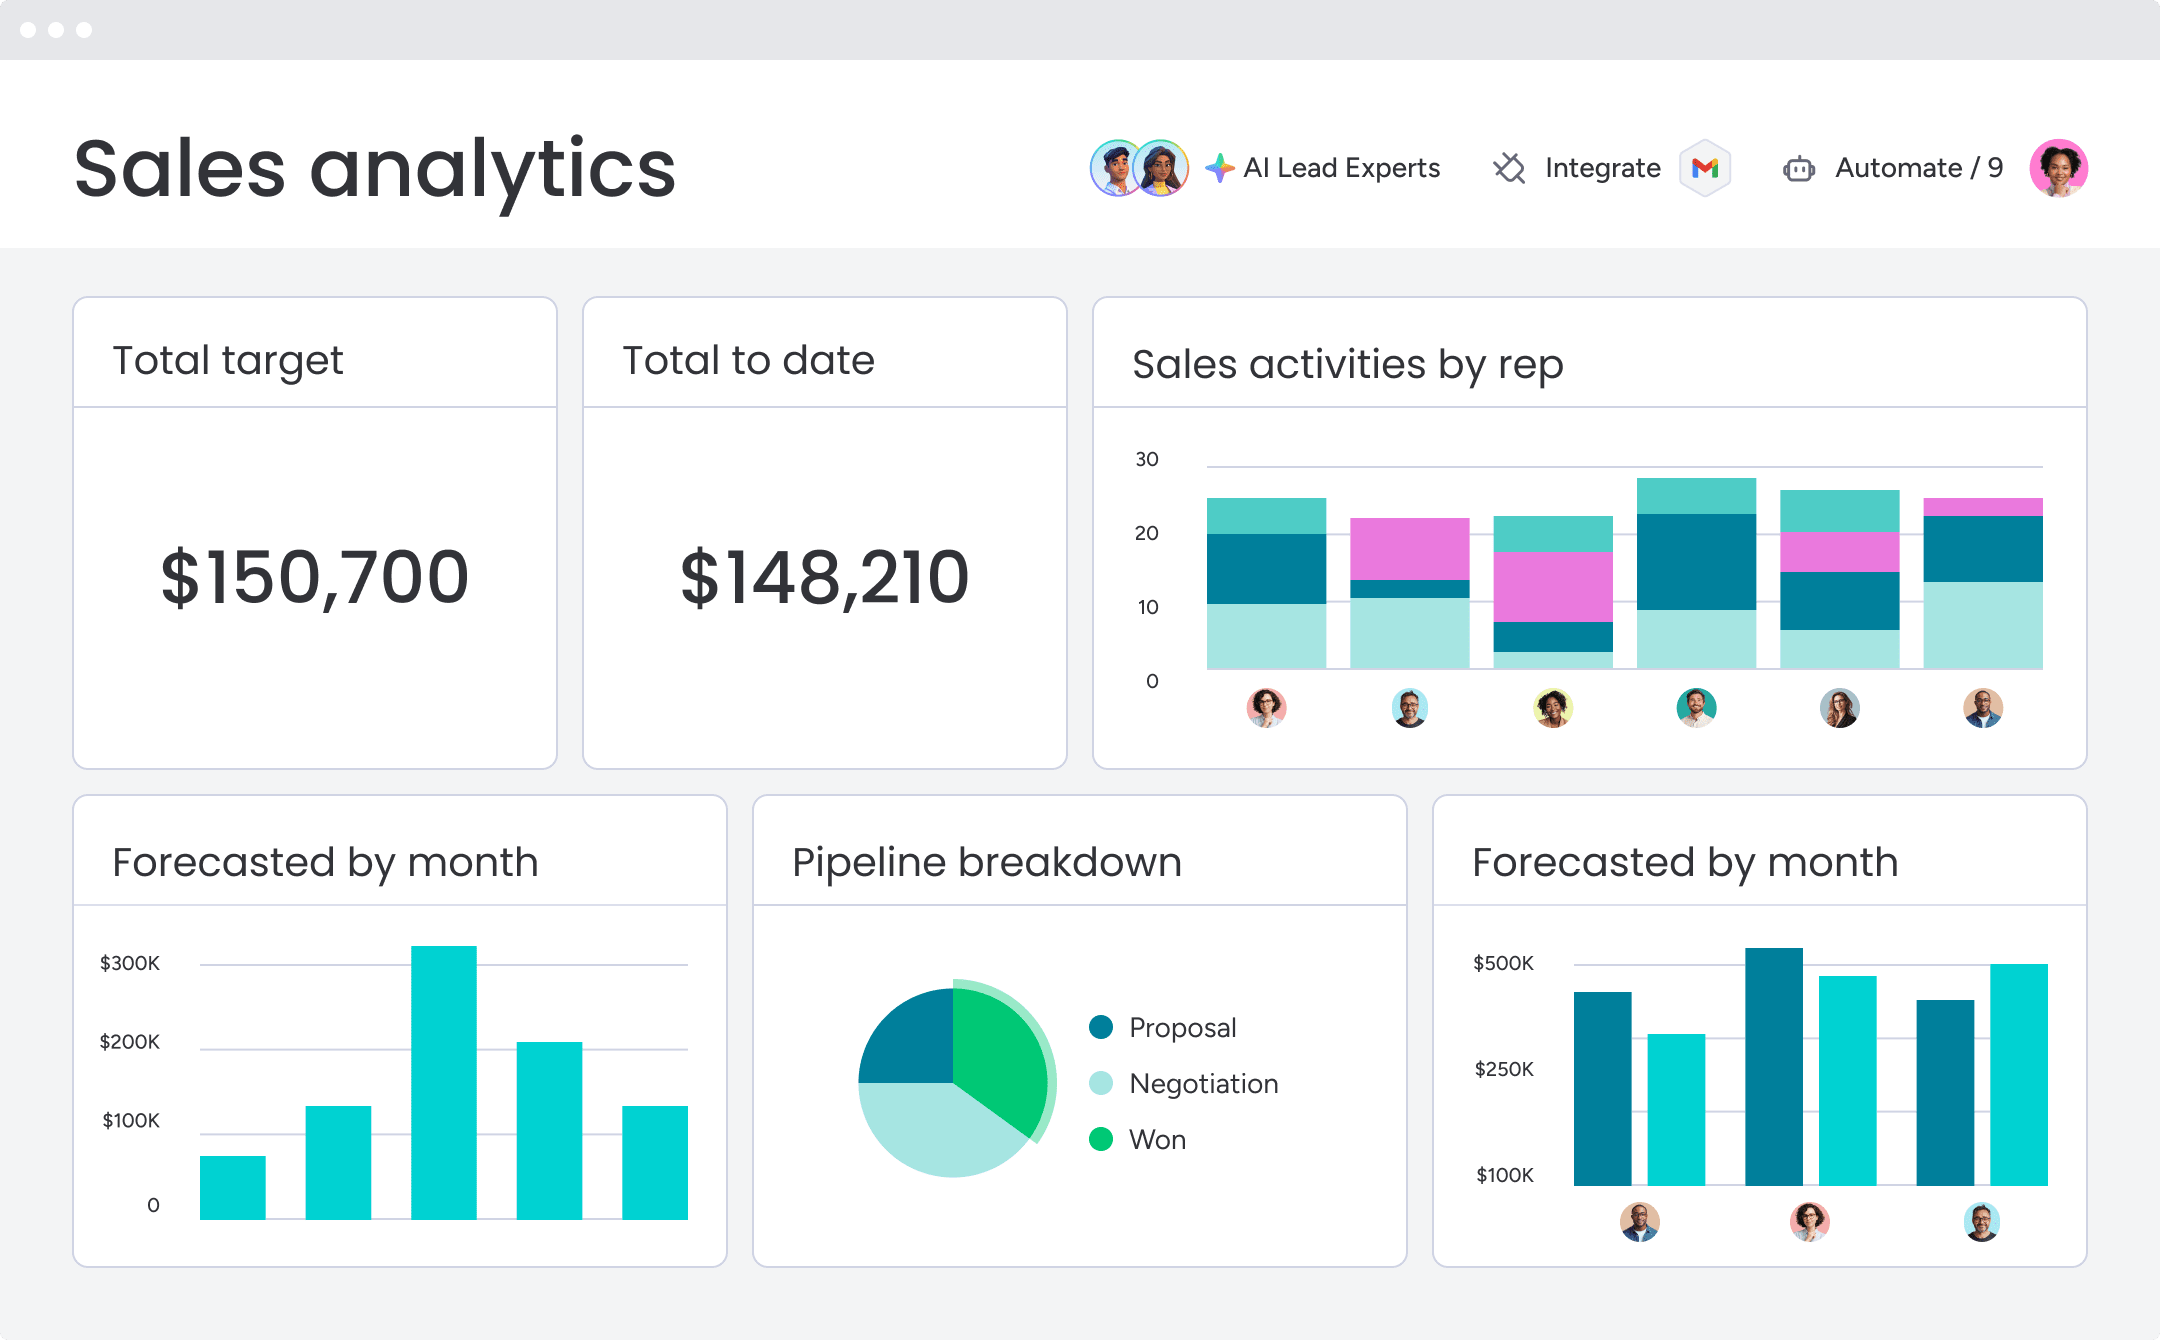
The pipeline coverage formula in action
Once you have your pipeline value and revenue target, the calculation is straightforward. Here’s how it works in practice, from setup to a ratio you can actually use:
- Choose your reporting period: Select the timeframe you’re measuring. Most B2B teams use quarterly coverage as their primary metric, though fast-moving teams might track monthly coverage for tighter control.
- Calculate total pipeline value: Pull every qualified opportunity that should close in your timeframe. Add up their total value — but only count deals that meet your qualification bar.
- Apply the formula: Divide your pipeline value by your revenue target. For example: $600K pipeline ÷ $200K quota = 3.
- Express as a ratio: Convert your result to the standard “X:1” format. A result of 3 becomes a 3:1 coverage ratio, meaning you have $3 in pipeline for every $1 of quota.
What is a good pipeline coverage ratio?
There’s no universal “good” ratio — it depends entirely on your win rate. The formula for your ideal coverage is simple:
Ideal Coverage Ratio = 1 ÷ Win Rate
Here’s how different win rates translate to coverage needs:
| Win rate | Ideal coverage ratio | Logic |
|---|---|---|
| 20% | 5:1 | Need 5 deals to close 1 |
| 33% | 3:1 | Need 3 deals to close 1 |
| 50% | 2:1 | Need 2 deals to close 1 |
Two other things shape your ideal ratio:
- Sales cycle length: Longer cycles need higher ratios because deals have more time to stall or fall apart. A 30-day cycle might work fine with 2:1 coverage, while a 6-month enterprise cycle might require 5:1 or higher.
- Pipeline quality: Well-qualified opportunities with strong engagement need lower coverage ratios than poorly qualified deals. Regular pipeline reviews improve sales opportunity management by identifying which opportunities are real versus wishful thinking.
Weighted vs. unweighted pipeline coverage: Which should you track?
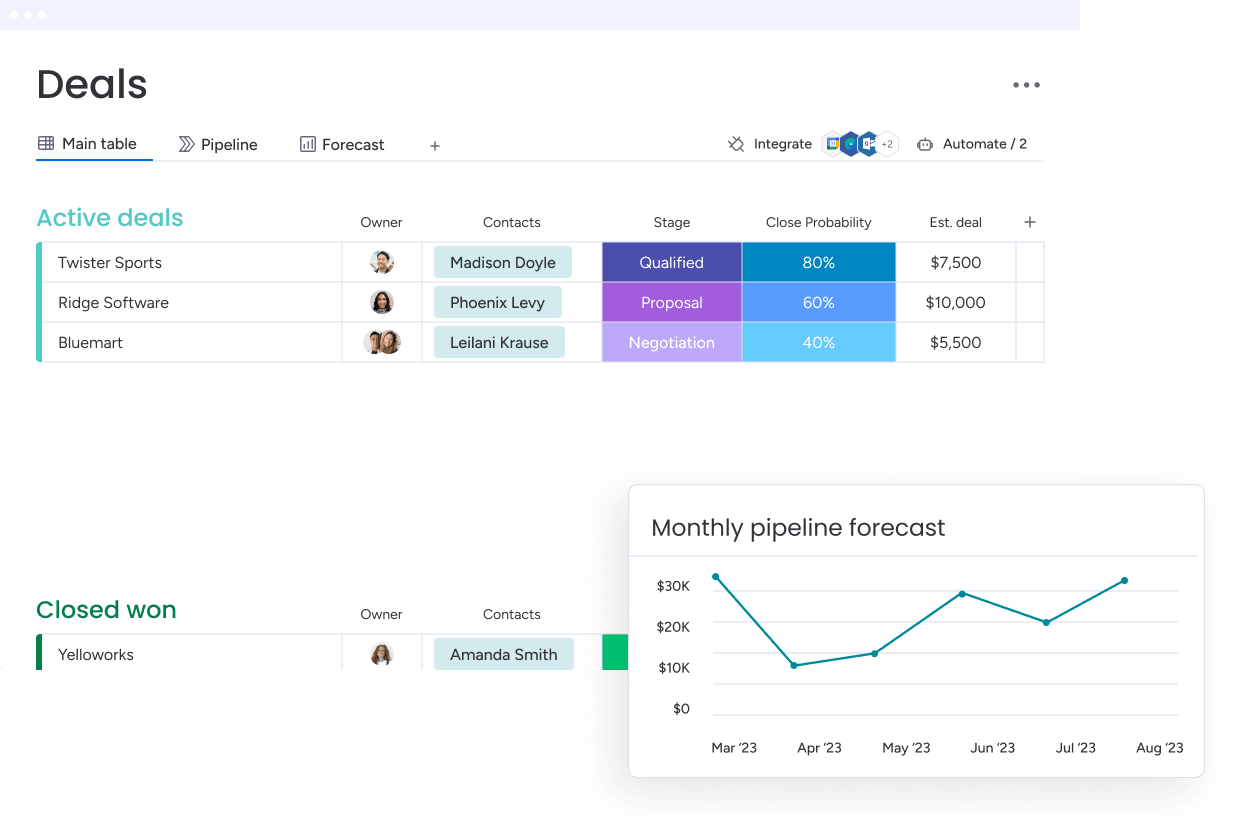
Not every dollar in your pipeline carries the same likelihood of closing. A $100K deal in early B2B sales pipeline stages carries different weight than a $100K deal in contract negotiation. That’s where weighted coverage comes in. Know the difference, and you’ll pick the right lens for each decision.
Unweighted pipeline coverage: Best for volume checks
Unweighted coverage counts all opportunities at full value, regardless of stage. It’s simple to calculate and easy to explain — but it can make your position look better than it is. This approach works best for:
- Quick health checks: Getting a fast read on pipeline volume
- Short sales cycles: When deals move quickly through stages
- Pipeline generation goals: Setting targets for new opportunity creation
Weighted pipeline coverage: Best for realistic forecasting
Weighted coverage adjusts each opportunity’s value based on its probability of closing. A $100K deal at 20% probability contributes $20K to weighted pipeline. You get:
- Realistic forecasting: A more accurate prediction of actual revenue
- Stage-based insights: Understanding where value sits in your pipeline
- Risk identification: Spotting when too much pipeline sits in early stages
Track both — most revenue teams do better when they can see both angles. Unweighted coverage shows volume; weighted coverage shows likelihood. Together, they show you everything you need to know.
Try monday CRM sales pipelineHow pipeline coverage changes by segment and role
Coverage needs change depending on who you’re looking at. What works for enterprise sales won’t work for SMB, and individual rep coverage differs from team coverage. Know the right benchmarks for each segment and role, and your targets stay realistic.
Coverage benchmarks by market segment
Different segments need different coverage ratios:
- Enterprise deals: Longer cycles and lower win rates mean 4:1 to 6:1 coverage.
- Mid-market: Balanced cycles typically need 3:1 to 4:1 coverage.
- SMB: Faster decisions allow for 2:1 to 3:1 coverage.
How individual rep coverage drives coaching decisions
Reps need to see their own coverage numbers to manage their pipeline well. A rep with 1.5:1 coverage against a 30% win rate is at serious risk of missing quota. They need to focus on pipeline generation now.
Individual coverage numbers also show you where to coach. When one rep keeps healthy coverage and another doesn’t, you can spot what’s working and share it with the team.
How pipeline coverage reveals hidden risks
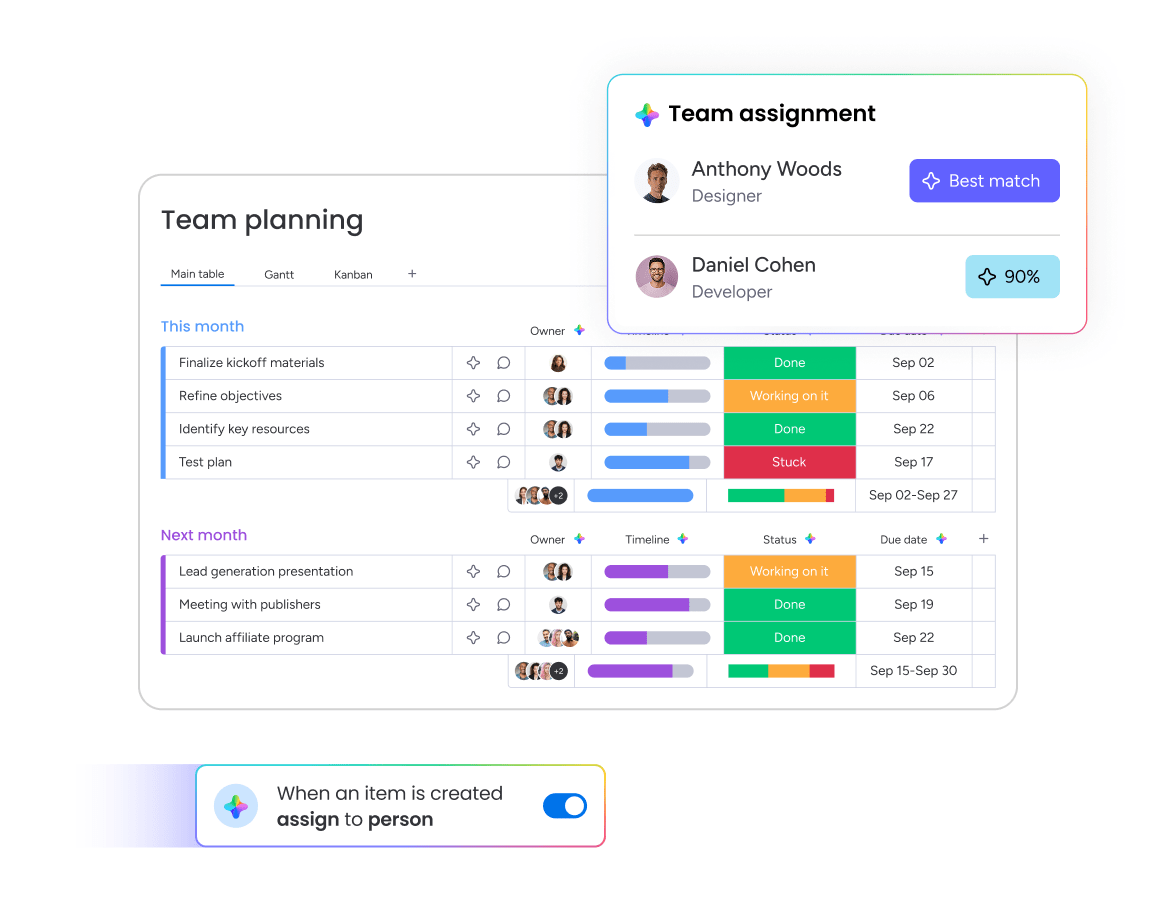
Pipeline coverage does more than predict revenue. It uncovers risks and opportunities you’d miss until it’s too late. Here are 3 signals worth watching closely.
1. Forecast confidence
Your coverage ratio drives how confident you can be in your forecast. When your coverage ratio exceeds what your historical win rate requires, you can forecast with greater confidence. Act now by ramping up prospecting, accelerating deals, or adjusting your forecast.
2. Resource allocation
Coverage guides where to focus your team’s energy:
- Low coverage: Prioritize top-of-funnel activities and pipeline generation
- Adequate coverage: Balance prospecting with deal progression
- High coverage: Focus on advancing and closing existing opportunities
3. Early warning indicators
Sudden coverage drops signal problems before they impact results. Maybe marketing leads dried up, a competitor entered your market, or your qualification process needs adjustment. Catch these signals early with coverage tracking and you’ll have time to fix them.
Improving pipeline coverage strategically
Building healthy coverage requires more than just “more pipeline.” You need to focus on quality, timing, and execution. These three approaches fix the real problem, not just the symptoms.
Prioritize qualified pipeline over raw volume
Not all pipeline is equal. Focus your generation efforts on a strong lead management process so opportunities match your ideal customer profile and meet clear qualification criteria. Ten well-qualified opportunities beat fifty unqualified leads every time.
Define what “qualified” means for your organization. Document your criteria, train your team, and audit regularly. That way your coverage reflects real opportunities, not wishful thinking.
Use stage-based exit criteria to keep pipeline honest
Clear definitions for sales pipeline stages prevent deals from artificially inflating your pipeline. Each stage needs specific exit criteria before a deal can move forward. This might include:
- Discovery complete: Pain identified, budget confirmed, decision process understood
- Proposal delivered: Solution presented, pricing discussed, timeline agreed
- Negotiation: Terms under discussion, legal review started, close date confirmed
Speed up deal velocity to reduce coverage pressure
Sometimes the answer isn’t more pipeline but faster pipeline. Cut your sales cycle by even 10% and you’ll need less coverage. Remove friction from your sales process, automate admin work, and keep your follow-up consistent.
Revenue teams can leverage sales pipeline software to trigger follow-up tasks when deals stall, send automated check-ins at key intervals, and alert managers when high-value opportunities need attention.
Using AI to enhance pipeline coverage tracking

AI transforms pipeline coverage from a backward-looking metric to a forward-looking predictor through AI sales pipeline management. Instead of calculating coverage manually and hoping for the best, AI helps you spot trends and take action before problems arise. These capabilities make the biggest difference.
- Automated risk detection: AI spots patterns across your pipeline and flags deals at risk of slipping or stalling. It might notice that deals without executive engagement rarely close, or that opportunities in negotiation for over 30 days typically die. That keeps your coverage expectations realistic.
- Predictive coverage modeling: Don’t wait for month-end. AI projects future coverage based on your current velocity, historical conversion rates, and seasonal patterns. You get weeks or months to adjust instead of finding out too late.
- Intelligent pipeline hygiene: AI keeps your pipeline clean, flagging stale opportunities, suggests close date updates, and spots duplicates or miscategorized deals. Clean data means accurate coverage calculations you can actually trust.
Pipeline coverage and pipeline velocity: Why you need both
Coverage tells you if you have enough pipeline. Velocity tells you if it’s moving fast enough. You need both for complete visibility. A full pipeline that moves slowly can miss targets just as easily as a thin one.
Consider these scenarios:
| Scenario | Coverage | Velocity | What it means |
|---|---|---|---|
| Team A | 4:1 (strong) | 180 days (slow) | Strong pipeline, but deals may not close in time |
| Team B | 2.5:1 (moderate) | 45 days (fast) | Faster deal flow can offset lower coverage |
A team with high coverage but slow velocity might still miss their number if deals don’t close in time. On the flip side, a team with moderate coverage but fast velocity might overperform. Track both metrics to understand your true position.
How to turn pipeline coverage into action
Pipeline coverage is only valuable if it drives action. Here’s how to make the metric work for real impact: set thresholds, connect data to coaching, and act on what you see.
Set coverage thresholds that trigger specific team actions
Set minimum coverage thresholds that trigger specific actions:
- Below 2:1: Immediate pipeline generation focus required
- 2:1 to 3:1: Maintain current prospecting while advancing deals
- Above 4:1: Shift focus to deal progression and closing
Build automated coverage alerts so problems surface in real time
Don’t wait for quarterly reviews to spot coverage problems. Set up alerts for when coverage drops below thresholds, when weighted and unweighted coverage diverge, or when reps fall below minimums.
Connect coverage data directly to rep coaching conversations
Use coverage data to guide coaching conversations. Low coverage usually means prospecting problems. High coverage with low conversion? That’s a qualification or closing issue. Let the data guide where each rep needs support.
Track pipeline coverage with confidence using monday CRM
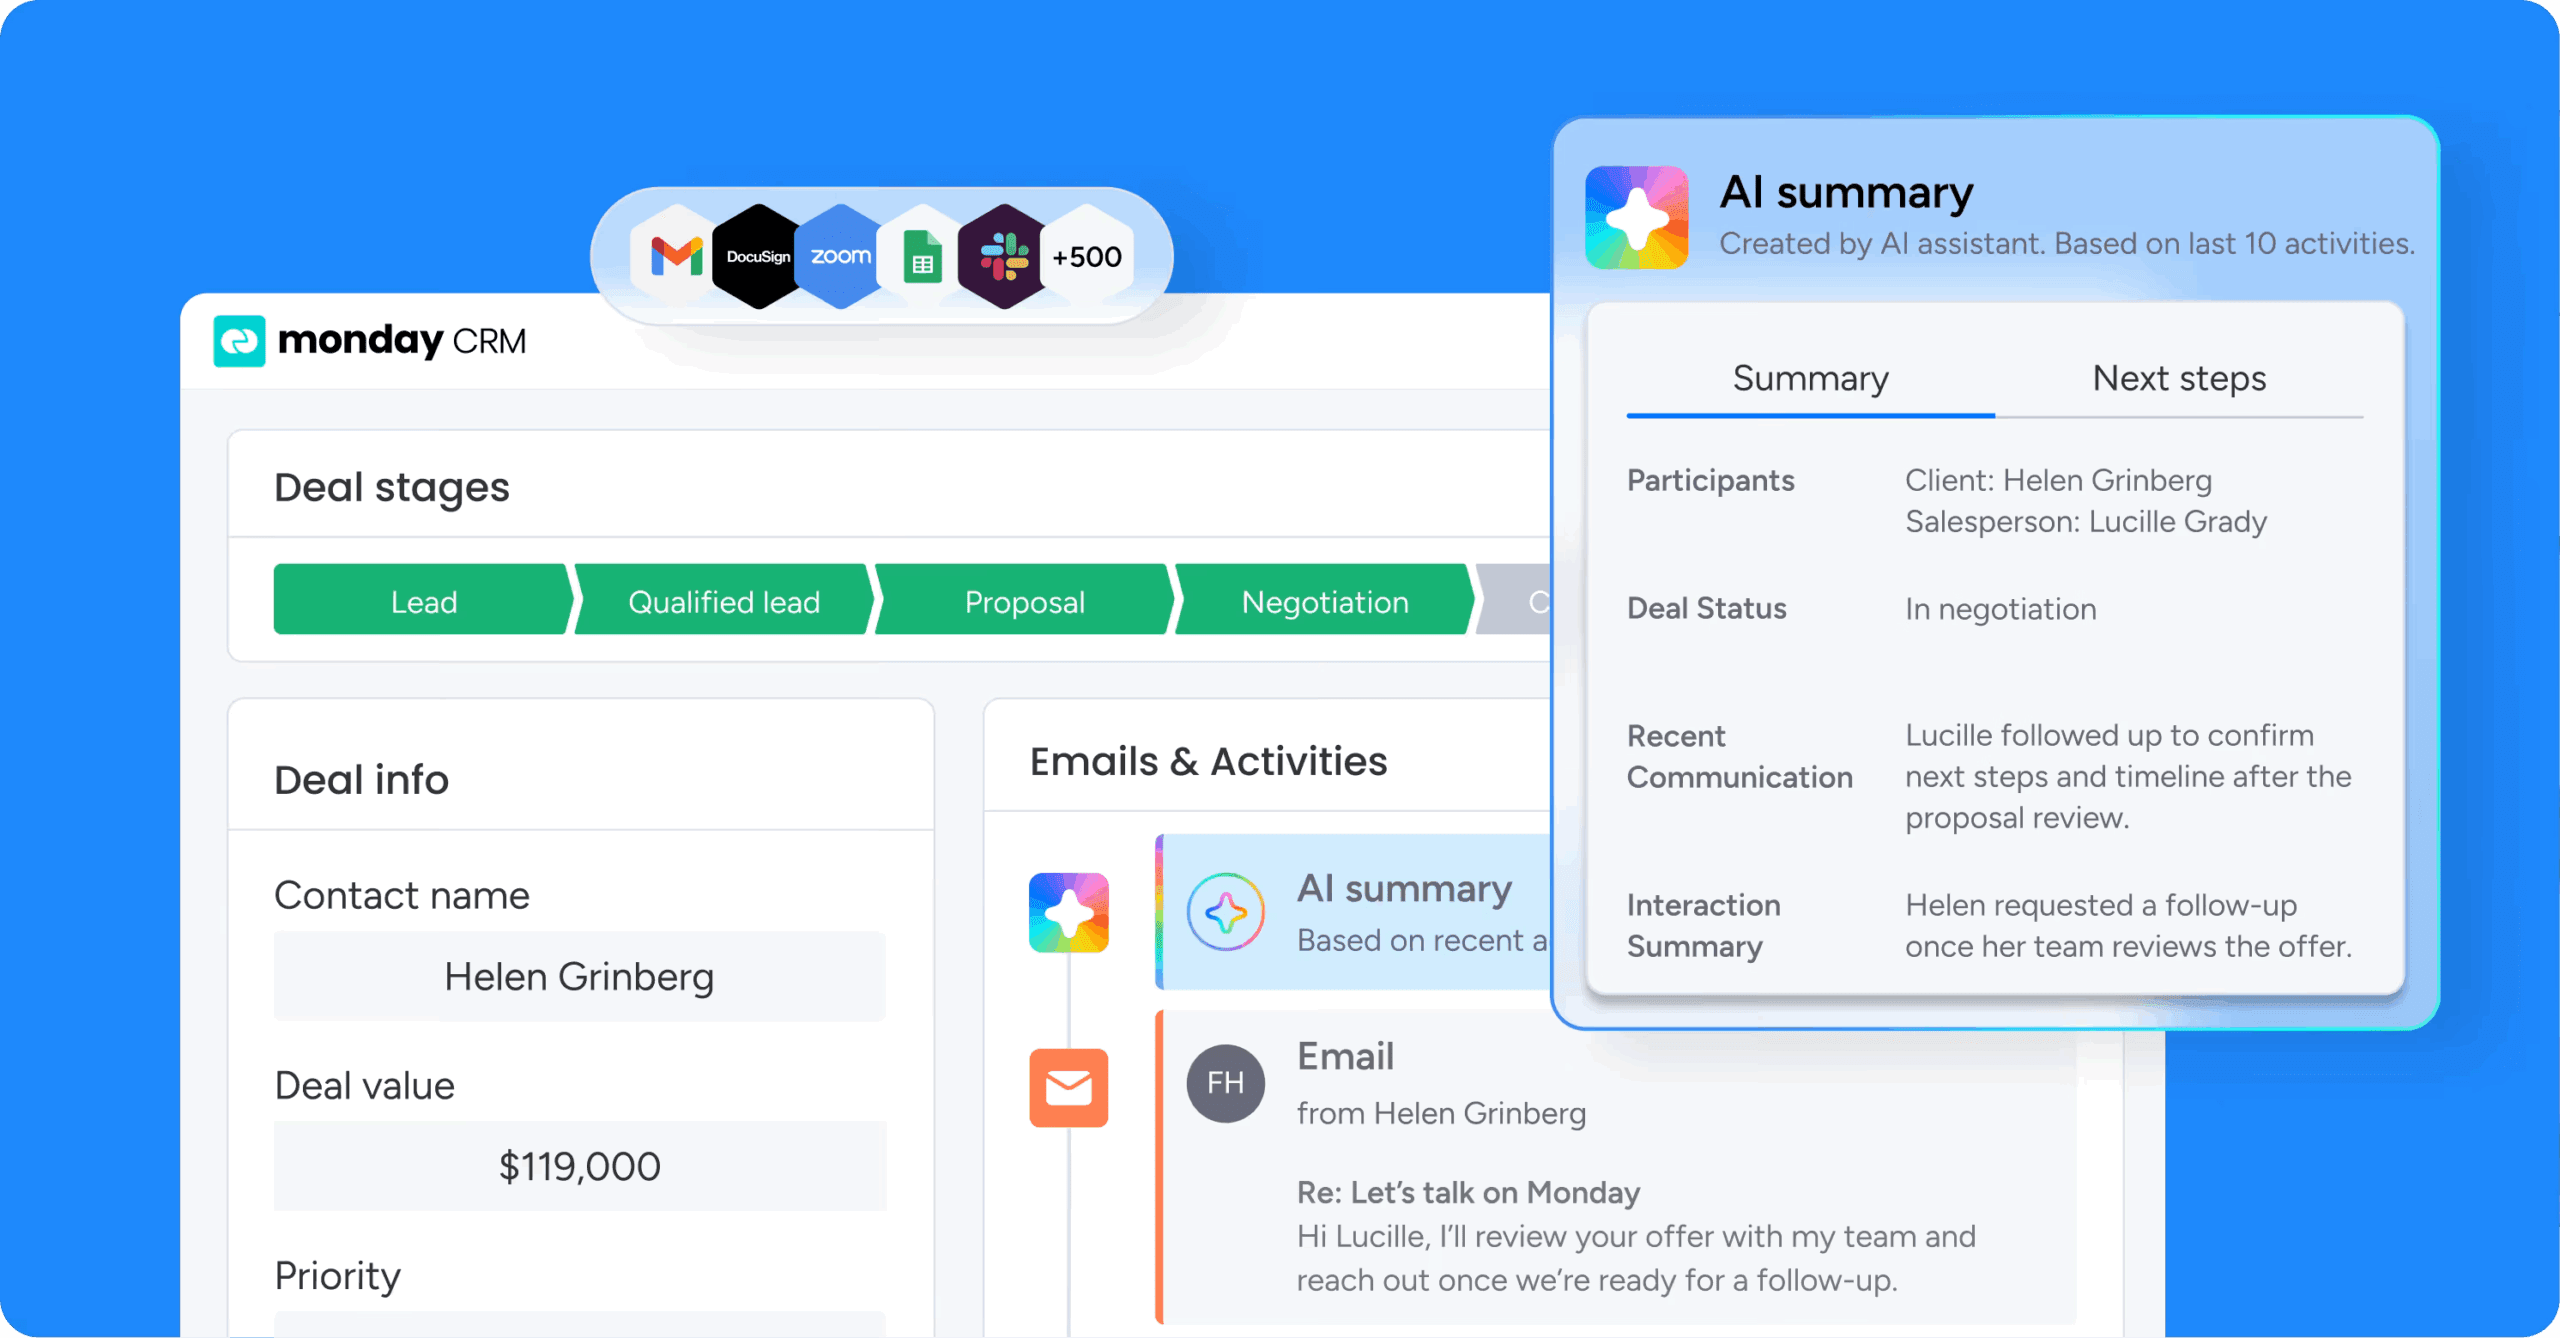
Managing pipeline coverage manually across spreadsheets and disconnected tools means you’re always looking backward. monday CRM gives you real-time visibility into your coverage ratios, automated alerts when coverage drops, and AI-powered insights that help you act before problems impact your number.
- Real-time coverage dashboards: Build custom sales dashboard templates that track coverage by team, rep, and segment simultaneously, making it easy to spot where coaching or support is needed most.
- Automated coverage alerts: Set threshold-based notifications that trigger when coverage drops below your target ratio, giving you time to course-correct before quarter-end.
- AI-powered pipeline insights: Leverage AI to identify at-risk deals, predict future coverage based on velocity trends, and automatically flag stale opportunities that inflate your numbers.
- Weighted and unweighted views: Toggle between raw pipeline volume and probability-adjusted coverage to see both the full picture and realistic forecast.
- Stage-based tracking: Monitor where pipeline value sits across your sales pipeline stages to identify bottlenecks and optimize deal flow.
With monday CRM, your coverage tracking becomes a strategic advantage rather than a monthly reporting exercise. You get the visibility, automation, and intelligence to manage pipeline proactively — so you can forecast with confidence and hit your targets consistently.

“With monday CRM, we’re finally able to adapt the platform to our needs — not the other way around. It gives us the flexibility to work smarter, cut costs, save time, and scale with confidence.”
Samuel Lobao | Contract Administrator & Special Projects, Strategix
“Now we have a lot less data, but it’s quality data. That change allows us to use AI confidently, without second-guessing the outputs.”
Elizabeth Gerbel | CEO
“Without monday CRM, we’d be chasing updates and fixing errors. Now we’re focused on growing the program — not just keeping up with it."
Quentin Williams | Head of Dropship, Freedom Furniture
“There’s probably about a 70% increase in efficiency in regards to the admin tasks that were removed and automated, which is a huge win for us.“
Kyle Dorman | Department Manager - Operations, Ray White
"monday CRM helps us make sure the right people have immediate visibility into the information they need so we're not wasting time."
Luca Pope | Global Client Solutions Manager at Black Mountain
“In a couple of weeks, all of the team members were using monday CRM fully. The automations and the many integrations, make monday CRM the best CRM in the market right now.”
Nuno Godinho | CIO at Velv
“monday.com provides developmental flexibility, operational efficiency, and data transparency — all in one place. We became a company that moved from chasing data to leading with it.”
Hyunghan Lee | Team Lead, Sandbox Network
"monday.com brought every part of our business into one connected space. The harmony between work management and CRM has become our operating system — giving us the clarity and confidence to scale.”
Jennifer Chinburg | Executive Vice President of Corporate Development & Brand, Chinburg Properties
“We just weren’t getting value from our old CRM. With monday.com, it's a thousand times better. Our sales teams are more informed, more consistent, and far more connected."
James Arnold | Chief Operating Officer, CenversaTurn pipeline coverage into your competitive advantage
Pipeline coverage is more than a reporting metric; it’s a decision-making system. When you track it consistently, you move from reactive firefighting to proactive pipeline management. That shift alone changes how confidently you can forecast, allocate resources, and lead your team.
The teams that win aren’t always the ones with the most pipeline. They’re the ones who know exactly what their pipeline means and act on it early. Combining coverage with velocity, weighted metrics, and AI-driven signals gives you a complete picture of where you stand and what to do next.
If you’re ready to stop guessing and start managing your pipeline with real precision, monday CRM gives your team the dashboards, automations, and AI capabilities to make it happen.
Try monday CRM AI sales pipelineFAQs
What's the difference between pipeline coverage and sales forecast?
Pipeline coverage measures the ratio of total qualified pipeline to revenue target, showing whether you have enough opportunities to hit your goal. Sales forecast predicts the specific revenue you'll close based on deal probability and timing. Coverage is about volume and safety margin; forecast is about specific revenue prediction.
How often should I calculate pipeline coverage?
Calculate pipeline coverage weekly for operational decisions and monthly for strategic planning. Weekly calculations help you spot trends early and take corrective action. Monthly calculations provide stability for resource planning and forecasting. High-velocity teams might even track daily during critical periods.
Can pipeline coverage be too high?
Yes, excessive pipeline coverage (above 6:1 for most teams) might indicate poor qualification, unrealistic opportunity values, or deals stuck in early stages. High coverage without corresponding closed revenue suggests your team needs to focus on advancing and closing deals rather than generating more pipeline.
Should I use the same coverage ratio for all products?
Different products typically need different coverage ratios based on their win rates, sales cycles, and average deal sizes. A high-velocity, low-price product might need 2:1 coverage, while a complex enterprise solution might require 5:1. Calculate coverage separately for each major product line or segment.
How do I improve coverage without sacrificing quality?
Focus on improving lead qualification criteria to ensure only real opportunities enter your pipeline. Accelerate existing deals through better follow-up and engagement rather than just adding more. Implement clear stage-gate criteria so deals progress based on real buyer actions, not hope. Regular pipeline reviews help maintain the balance between quantity and quality.
What if my coverage looks good but I keep missing quota?
Good coverage with missed quotas usually indicates inflated opportunity values, incorrect close dates, or lower-than-expected win rates. Audit your pipeline for accuracy, paying special attention to deal values and timing. Review your historical win rate to ensure your coverage target matches reality. Check if deals are getting stuck in specific stages, indicating process bottlenecks rather than coverage issues.
