Leadership updates don’t fail because teams aren’t working. They fail because progress gets buried in detail. Gantt charts, dependency maps, and task lists might keep execution on track, but they rarely give decision-makers a clear answer to one simple question: are we hitting the outcomes that matter?
A milestone chart cuts through that noise. Instead of tracking every activity, it highlights the critical checkpoints that signal real progress — approvals, launches, testing completion, and strategic go-live dates. It shifts the focus from effort to achievement.
In this guide, you’ll learn when to use a milestone chart, how it differs from a Gantt chart, and how to build milestone views that support executive visibility, accountability, and strategic alignment across teams.
Key takeaways
- Milestone charts prioritize outcomes over activity: Focusing on major checkpoints helps teams communicate real progress instead of reporting on task volume or effort.
- Executive-friendly timelines improve decision-making: Clean milestone views allow leaders to assess project health and risks in seconds without navigating operational detail.
- Clear ownership strengthens accountability: Assigning a single champion to each milestone ensures responsibility for delivery, communication, and issue resolution remains explicit.
- Strategic alignment improves when milestones connect to goals: Linking milestones to OKRs and business objectives ensures project execution directly supports organizational priorities.
- Work management platforms enable scalable milestone tracking: Solutions like monday work management connect milestone visibility to live workflows, automations, and AI-powered risk insights without manual reporting.
What is a milestone chart?
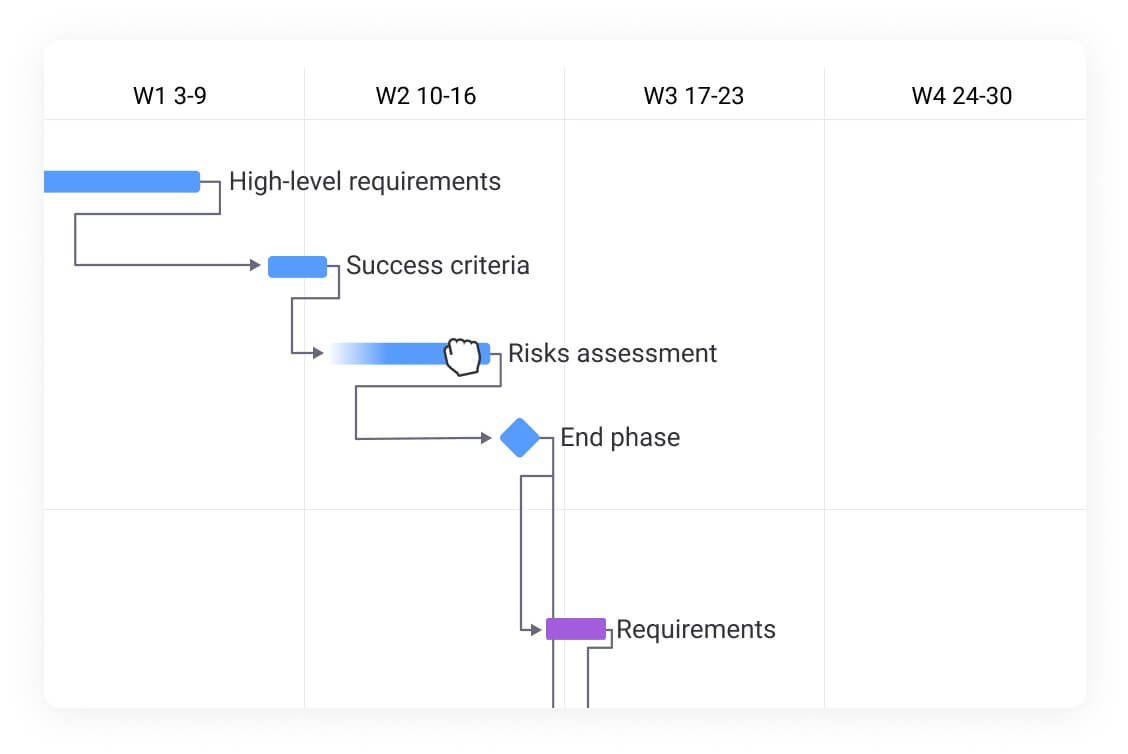
A milestone chart is a visual timeline that highlights critical checkpoints and achievements within a project or workflow. Unlike detailed schedules that list every task, milestone charts zero in on the big wins that show you’re actually moving forward. They’re your go-to communication tool for keeping stakeholders informed without drowning them in details.
Think of milestone charts as your strategic roadmap. They highlight critical dates like design phase completion, regulatory approval, or product launch. By isolating these key moments, teams create a shared definition of success and a timeline for delivery.
This crucial visibility prevents projects from appearing healthy on the surface while hiding delays and issues underneath. Essentially, it forces teams to validate progress at specific checkpoints that require genuine completion.
Defining milestones vs tasks
Milestones and individual work items serve different functions within project management. Work items represent the specific actions required to move a project forward, while milestones represent the culmination of that work. Get this distinction right, and you’ll maintain a strategic view of any project.
| Feature | Task | Milestone |
|---|---|---|
| Scope | Individual action item required to execute work | Major achievement marking phase or deliverable completion |
| Duration | Has start and end dates; takes time to complete | Zero duration; represents a specific point in time |
| Stakeholder interest | Primarily relevant to execution team and project manager | Highly relevant to executives, clients, and cross-functional stakeholders |
| Measurement | Measured by effort (hours, days) and resource utilization | Measured by binary status (met/missed) and deliverable quality |
When to use milestone charts for maximum impact
Milestone charts excel when strategic oversight and communication take precedence over micro-management. They provide the necessary context for high-stakes decision-making and cross-functional alignment.
Milestone charts work best in these scenarios:
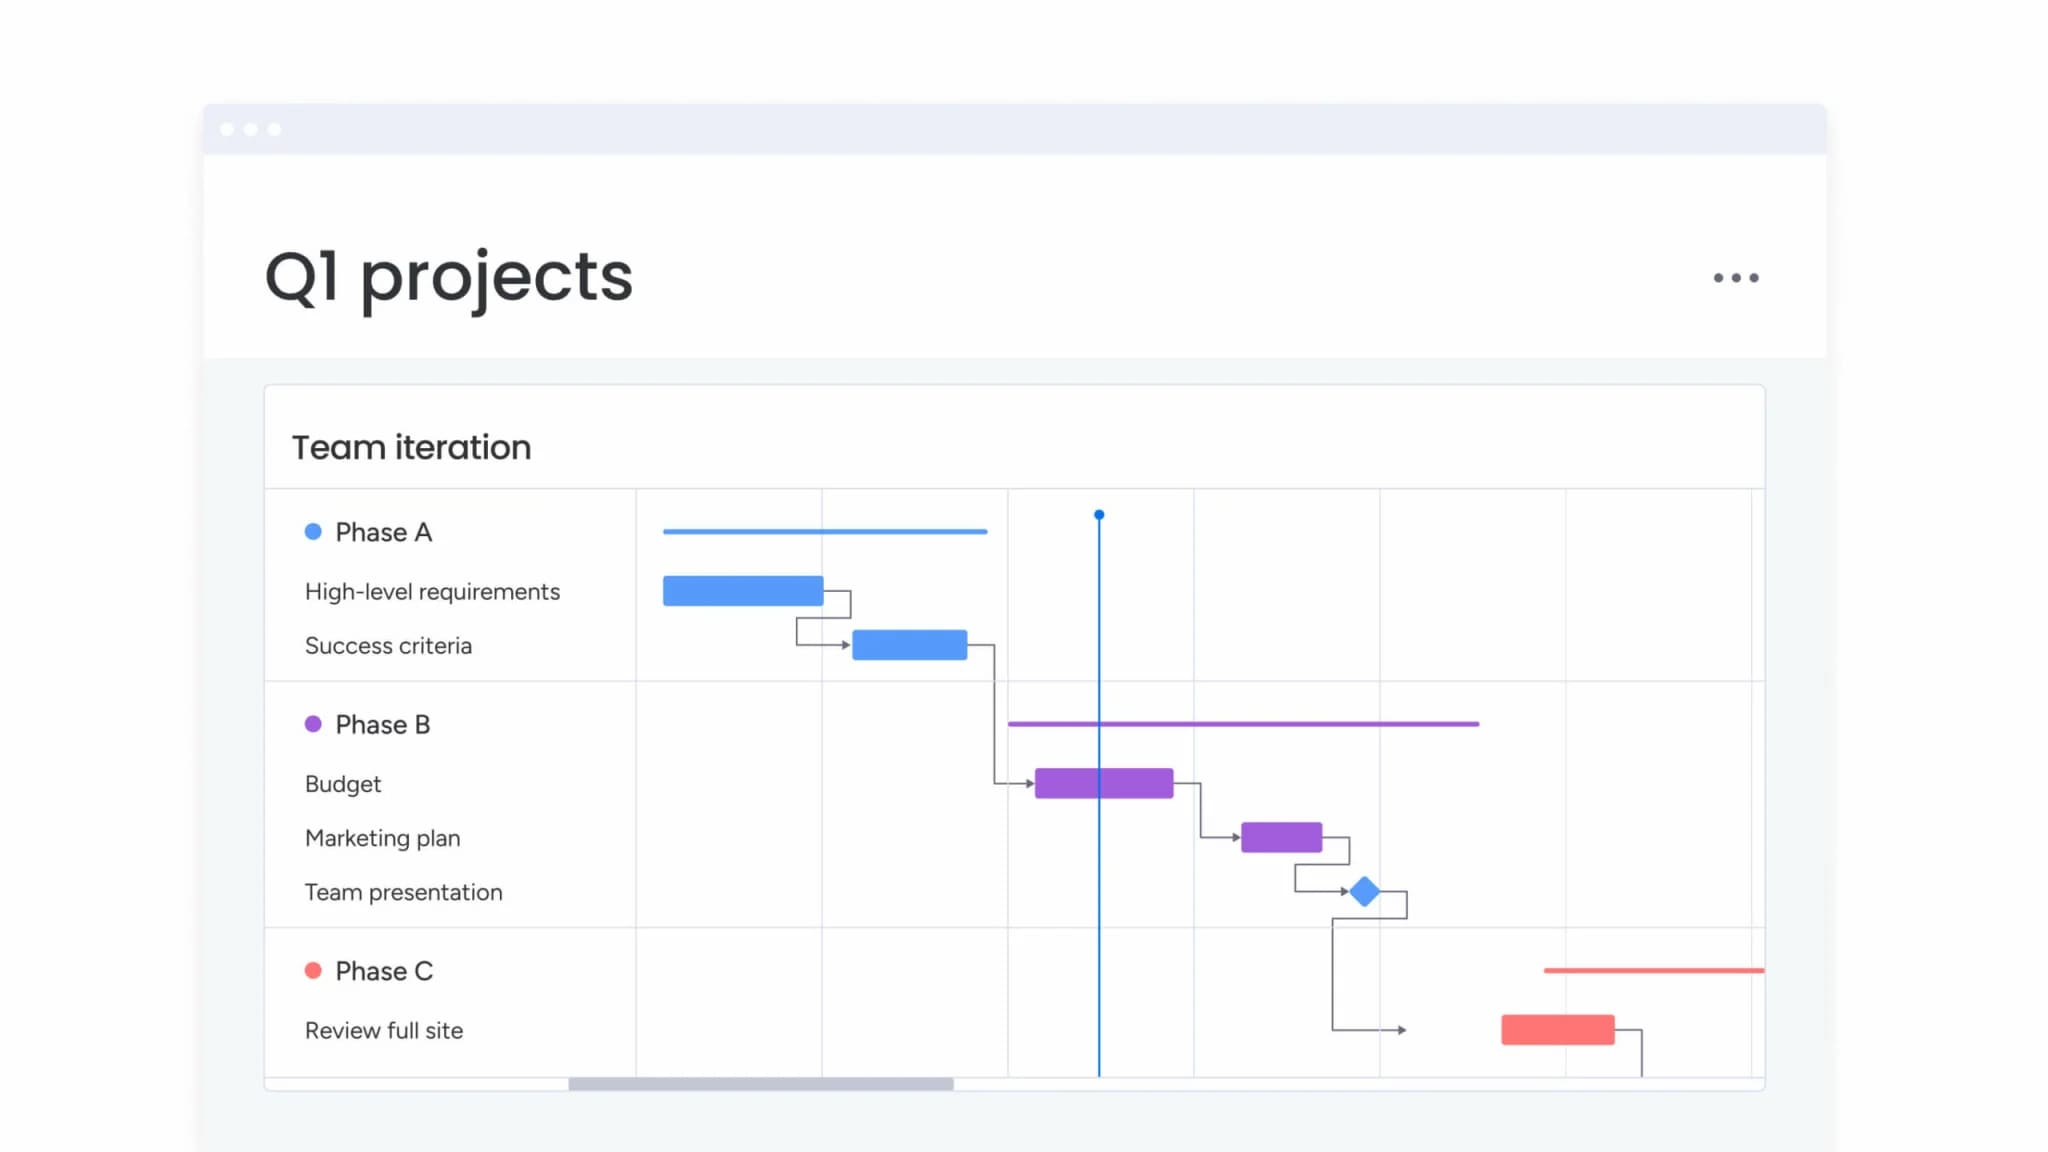
- Complex multi-phase projects: Initiatives with distinct stages, such as software development lifecycles or construction projects, require clear demarcation between phases using a project timeline. Milestone charts visualize these transitions, ensuring prerequisites are met before subsequent work begins.
- Cross-departmental initiatives: When multiple teams contribute to a single goal, detailed task lists become unwieldy. Milestones provide a common language and timeline that aligns marketing, engineering, and sales teams without forcing them to navigate each other’s daily workflows.
- Executive reporting: Senior leadership rarely has bandwidth to review Gantt charts with hundreds of lines. Milestone charts distill project health into a single view so executives can check progress, spending, and deadlines in seconds.
- Client-facing roadmaps: Sharing internal task lists with clients often leads to micromanagement or confusion. Milestone charts give clients a clean, high-level view that manages expectations and builds trust without exposing your internal chaos.
- Regulatory compliance tracking: Projects in regulated industries often depend on specific approvals or audits. Milestones act as permanent records of compliance events, making sure every required check is done and documented before you move forward.
Milestone chart vs Gantt chart: making the right choice
Choosing between a milestone chart and a Gantt chart depends on your audience’s needs and the level of detail required. Both visualize time, but they’re built for completely different audiences.
A Gantt chart is a planning instrument designed for the people doing the work, while a milestone chart is a communication instrument designed for the people overseeing the value.
| Dimension | Milestone chart | Gantt chart |
|---|---|---|
| Primary focus | Key achievements and major dates | Task dependencies, duration, and resource scheduling |
| Target audience | Executives, stakeholders, clients | Project managers, team leads, execution teams |
| Visual complexity | Low; clean timeline with distinct markers | High; cascading bars, dependency lines, resource assignments |
| Update frequency | Weekly or bi-weekly status checks | Daily operational updates |
| Strategic value | High; focuses on outcomes and value delivery | Moderate; focuses on output and schedule adherence |
Visual complexity and audience needs
Milestone charts are designed for speed and immediate comprehension. Either the status is clear at a glance or the chart fails its purpose. Functioning as an executive dashboard, the milestone view strips away operational detail to answer a single strategic question: whether initiatives remain on track.
Gantt charts serve a different role within the organization: they provide execution teams with a detailed planning framework that visualizes sequencing, dependencies, and workload distribution.
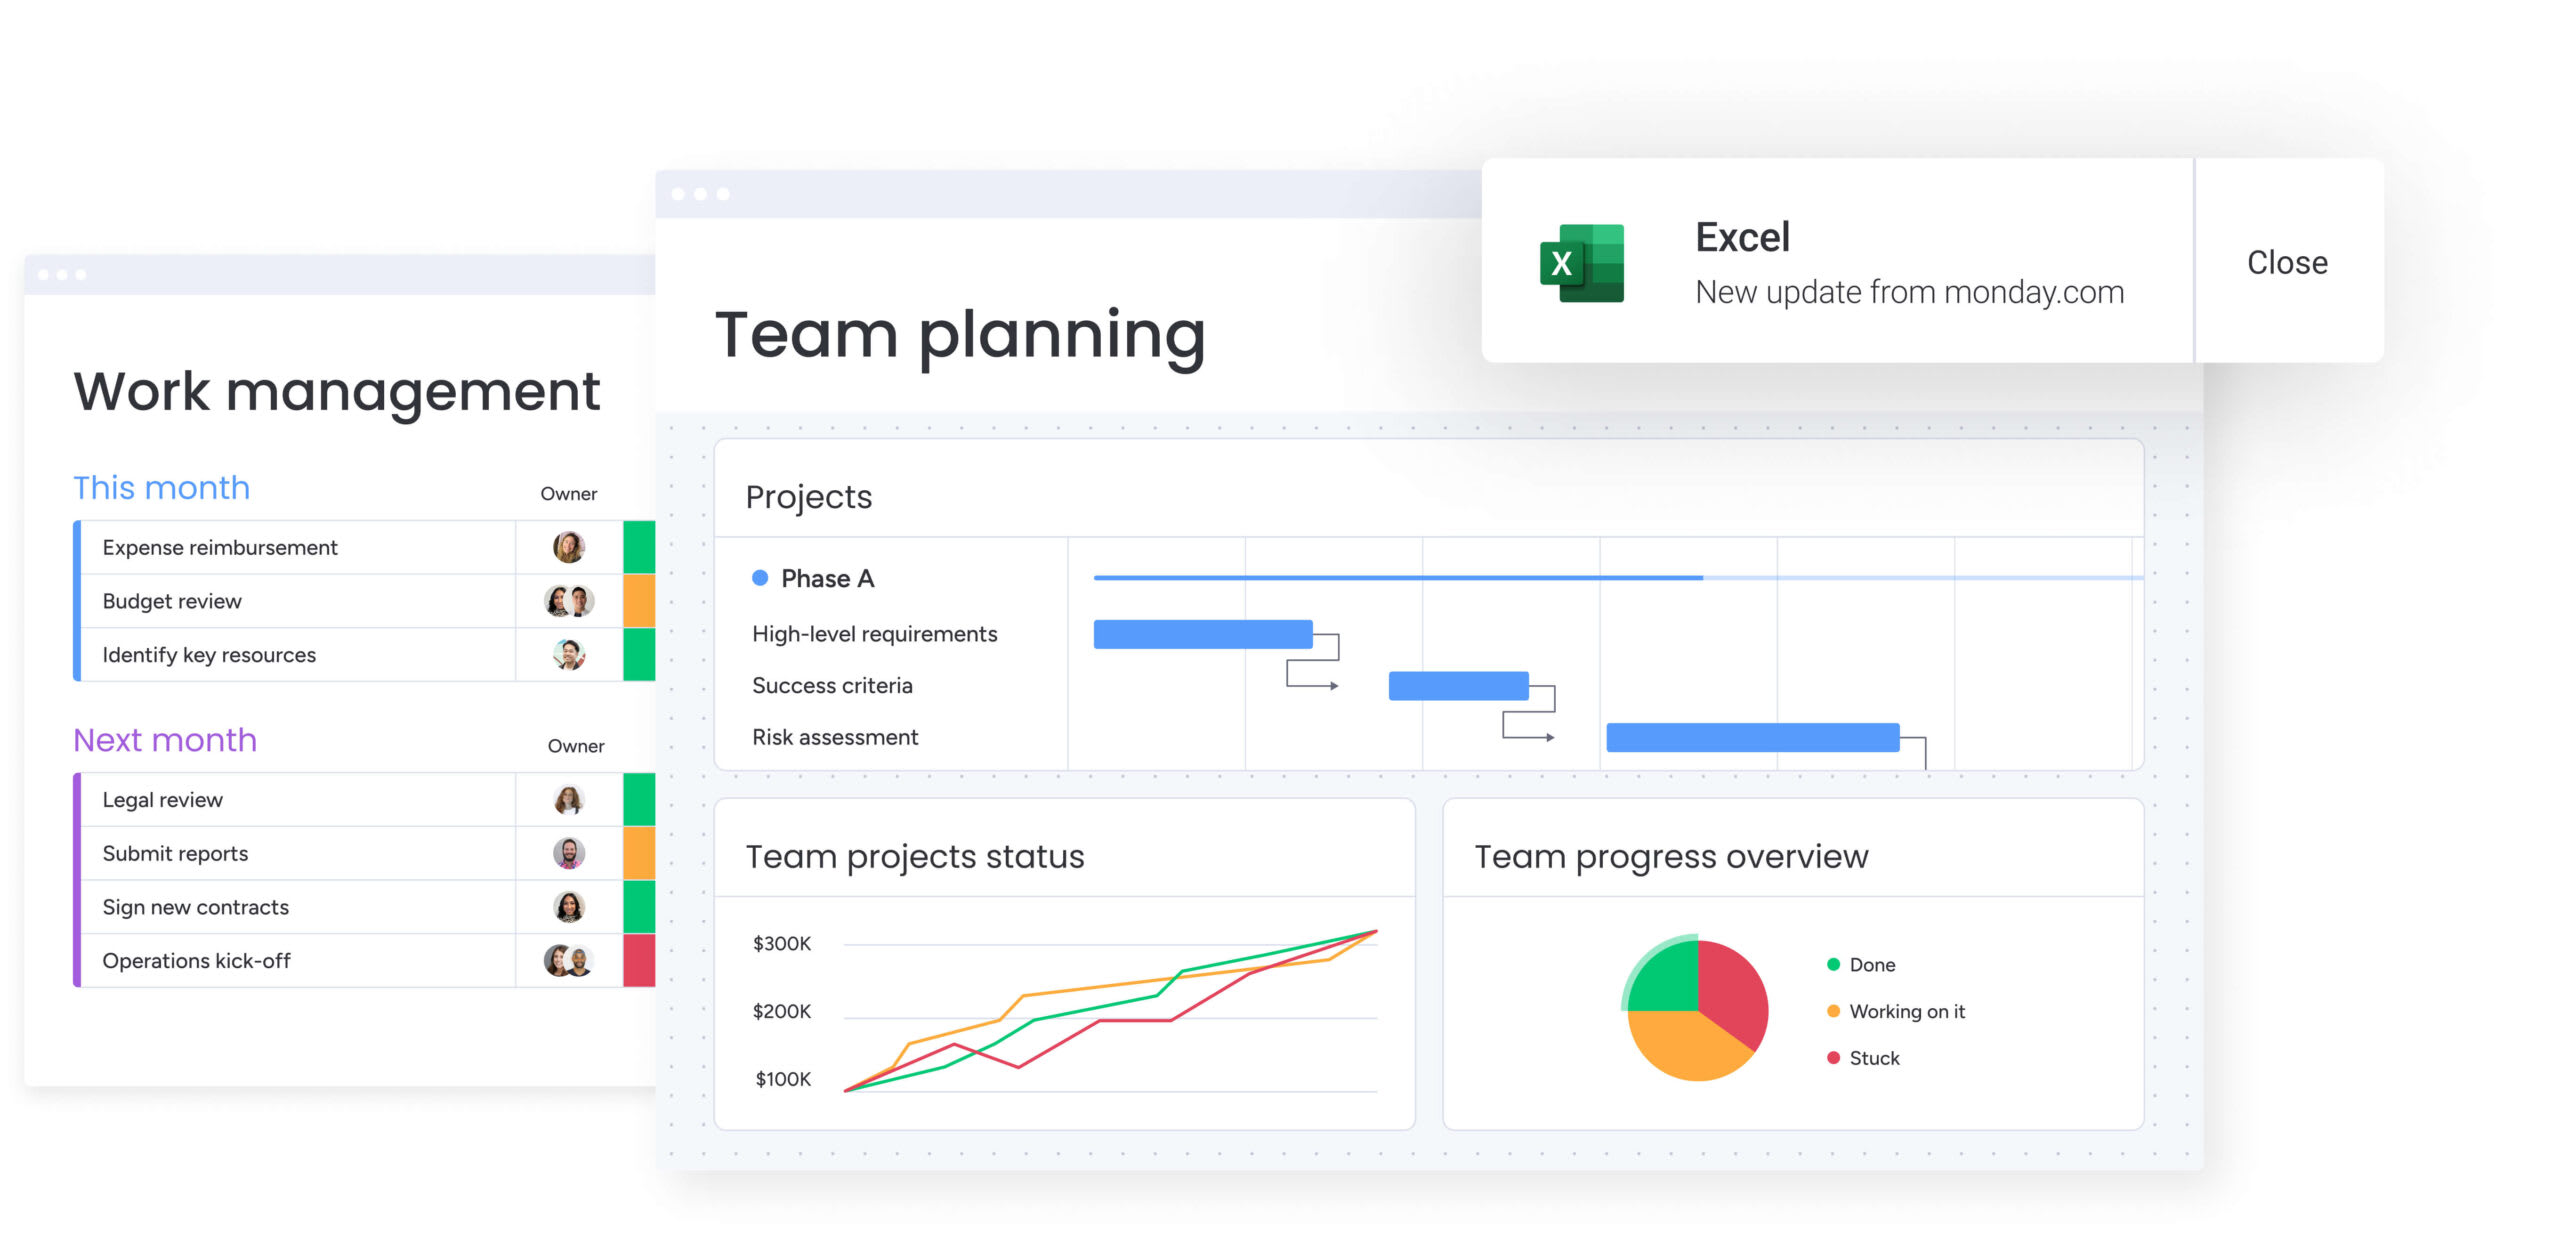
Modern work management platforms support both needs by allowing teams to manage delivery through a detailed Gantt view while automatically generating a clean milestone view for stakeholders, all powered by the same underlying data.
When each tool delivers optimal results
Selecting the right tool depends on the specific communication objective of the moment. Know the strengths of each, and you’ll use the right tool at the right time instead of forcing one format everywhere.
Milestone charts work best for:
- Executive reporting that provides a health check on strategic initiatives.
- Client updates demonstrating progress toward contractual deliverables.
- Portfolio oversight managing resources and timelines across multiple projects.
- Strategic planning mapping out long-term goals and quarterly objectives.
Gantt charts excel for:
- Detailed project planning breaking down scope into assignable actions.
- Resource scheduling ensuring team members aren’t over-allocated on specific days.
- Dependency management identifying how delays in one task impact the entire schedule.
- Operational coordination managing day-to-day workflow of the execution team.
How milestone charts support strategic decision making
For leadership, milestone charts aren’t just tracking tools. They’re how you govern and align the organization. They shift focus from busy work to real value, making sure every effort counts toward a goal that matters. Here’s why milestone charts are an essential part of strategic project management.
Instant executive visibility
Milestone charts let leaders assess project health in seconds, no digging required. Instead of parsing through status reports or email threads, executives look at a project timeline and immediately see which key dates have been met and which are at risk.
That speed lets leaders act before problems spiral. Executives can intervene to remove blockers or approve budget increases before delays cascade into failure.
Cross-team alignment at scale
Silos pop up when teams speak different languages and work in different systems. Milestone charts create a shared source of truth that transcends departmental boundaries.
By translating technical progress into business language, these charts ensure marketing, sales, and product teams remain aligned on the go-to-market timeline through effective milestone tracking. With a unified platform, delays in engineering show up instantly in the marketing launch plan.
Proactive risk identification
Milestone charts spot trouble early, long before it becomes a crisis. The concept of milestone velocity, the rate at which teams hit their major targets, serves as a leading indicator of project success.
If a team keeps missing small internal milestones, you’ve got a bigger problem with estimation or resources, and it’s going to blow the final deadline.
Streamlined resource allocation
Smart resource management starts with knowing exactly when phases begin and end. Milestone completion often acts as a trigger for resource reallocation, such as moving a design team to a new project once the Design Approval milestone is reached.
Visualizing these transitions helps ops managers forecast resource needs, cut bench time, and avoid bottlenecks when multiple projects need the same people.
Accelerated strategic decisions
Milestone charts speed up go/no-go decisions with clear yes-or-no progress markers. When a project reaches a critical decision gate, the milestone chart provides the objective data needed to approve further investment, pivot the strategy, or kill the initiative.
It replaces gut calls with hard data, so you only invest in projects that are actually moving the needle.
Milestone charts let leaders assess project health in seconds, no digging required. Instead of parsing through status reports or email threads, executives look at a project timeline and immediately see which key dates have been met and which are at risk.
Core components every milestone chart needs
To work as a strategic tool, a milestone chart needs very specific elements that drive accountability and visibility. An effective chart requires more than just a simple timeline with dates: the chart really needs to show ownership, status, and context.
Every effective milestone chart needs these components:
- Timeline structure and key dates: The backbone of the chart is a realistic timeline that aligns with business cycles. Dates must be meaningful, tied to fiscal quarters, product launches, or external commitments. Balance ambition with reality, and you’ll motivate the team instead of burning them out.
- Ownership and accountability: Every milestone requires a specific owner. This person doesn’t have to do the work, they just own the outcome and keep everyone informed. Clear ownership stops responsibility from getting lost in the shuffle. When a milestone’s at risk, one person owns the fix.
- Visual progress tracking: Status must be immediately decipherable through visual cues. Use standard colors — green for done, yellow for at-risk, red for delayed, and stakeholders get it instantly. Add symbols like diamonds for decision gates, and you’ve got extra context without the mess.
- Critical dependencies: Effective charts visualize relationships between milestones. Show that User Testing can’t start until Prototype is done, and stakeholders see how one delay ripples through everything. Visualizing these links prevents unrealistic pressure on downstream teams when upstream milestones slip.
How to build your first milestone chart
Building a milestone chart forces you to define what success actually looks like. You start with the end goal and work backward to today. Here’s how to build a milestone chart that drives accountability and keeps strategy visible.
Step 1: Define strategic project outcomes
Start by nailing down the business objectives, not the task list. Teams must ask what the project needs to achieve to be considered a success by the organization.
Outcomes like Enter New Market or Reduce Churn by 5% become your anchor points.
Step 2: Identify mission-critical checkpoints
Once the destination is set, teams identify the major milestones required to get there. These should be significant achievements, not just administrative tasks.
A good criterion for selection is whether completion of the item eliminates a significant amount of risk or unlocks the next phase of investment.
Step 3: Set realistic target dates
Setting dates requires balancing stakeholder expectations with delivery realities. Teams analyze historical performance and resource availability to estimate timing.
Building in appropriate buffers, without padding the schedule excessively, ensures the timeline remains resilient against minor disruptions. Dates should also align with external dependencies, such as vendor lead times or regulatory review cycles.
Step 4: Assign milestone champions
Each identified milestone receives a designated champion. This role involves more than just oversight, the champion acts as the communication bridge between the execution team and the steering committee.
They hold the authority to make decisions related to that specific phase and the accountability to report on its progress.
Step 5: Map cross-project dependencies
Strategic planning involves looking sideways as well as forward. Teams map out how milestones in the current project interact with other initiatives.
For example, a software launch might depend on a separate infrastructure project. Visualizing these cross-project dependencies prevents resource conflicts and ensures coordinated delivery across the portfolio.
Step 6: Select your tracking platform
The choice of platform dictates the visibility and sustainability of the chart. The ideal platform supports dynamic updates, integrates with the work execution layer, and scales from single projects to enterprise portfolios.
The ideal platform allows milestones to live within the same ecosystem as the daily work, ensuring the chart is always up-to-date without manual intervention.
Step 7: launch with stakeholder alignment
The final step is socializing the chart with all stakeholders. This involves a formal review to ensure everyone agrees on the definitions of success and the timeline.
Establishing a regular review rhythm and communication protocol ensures the milestone chart remains a living document that guides decision-making throughout the project lifecycle.
Types of milestone charts for different needs
One size doesn’t fit all in project management. The structure of the milestone chart should reflect the nature of the work and the governance model of the organization.
Understanding these three primary formats below helps teams select the approach that best serves their specific context (and stakeholder needs).
Linear timeline charts
Linear charts suit projects with sequential progression where one phase must finish before the next begins, similar to a linear project timeline. This format excels in industries like construction or manufacturing, where physical constraints dictate the order of operations.
The visual simplicity of a linear timeline makes it easy to communicate the critical path to stakeholders who need to understand the sequence of events.
Phase-gate progress charts
Phase-gate charts are designed for high-risk initiatives that require formal approval to proceed. In this model, milestones represent decision points where the project is reviewed against specific criteria.
This approach is standard in pharmaceutical R&D and new product development, where investment increases significantly with each phase. The chart emphasizes the governance process, ensuring risk is managed incrementally.
Enterprise portfolio dashboards
For executives overseeing multiple programs, portfolio dashboards aggregate milestones from various projects into a single view. This control tower perspective allows leaders to see alignment of different initiatives with strategic goals.
It facilitates resource balancing, as executives can see if multiple high-impact milestones are converging on the same month, potentially straining organizational capacity.
A Work OS further enables organizations to build these dashboards by pulling data from all projects across different programs into one high-level view.
Milestone planning best practices
Effective milestone management requires a shift in mindset from tracking to leading. It involves setting the tempo for the project and maintaining the integrity of the plan.
These proven practices help organizations maximize the strategic value of their milestone charts while avoiding common pitfalls.
Balancing ambition with achievability
Milestones should stretch the team’s capabilities without breaking their spirit. Setting aggressive targets can drive focus, but consistently missing them erodes credibility and morale.
Best practice involves setting stretch goals internally while committing to achievable dates externally, creating a safety margin that protects the organization’s reputation.
Building in strategic flexibility
Rigid plans break under pressure; flexible plans adapt. Strategic flexibility means designing milestones that focus on outcomes rather than specific outputs.
If the market shifts, the team can adjust the how (the deliverables) while keeping the what (the milestone achievement) intact. This allows the project to remain relevant even as business conditions change.
Linking milestones to OKRs
Milestones shouldn’t exist in a vacuum, they must connect directly to Objectives and Key Results. Every major milestone should contribute to a specific key result through effective milestone planning.
This alignment ensures project work drives the company’s strategic agenda. For example, a launch mobile app milestone directly supports an OKR to Increase Digital Engagement by 20%.
Establishing review rhythms
Milestone charts lose value if they’re not reviewed regularly. Establishing a cadence, such as monthly steering committee meetings or quarterly business reviews, ensures data remains fresh and actionable.
These reviews should focus on variance analysis, discussing why a milestone is ahead or behind, rather than just reporting the status, turning the meeting into a problem-solving session.

Transform milestone tracking with AI and automation
Milestone tracking has moved far beyond static spreadsheets and manual status updates. Today’s work management platforms use AI and automation to turn milestone data into real-time insight. Instead of spending time compiling reports, project leaders can focus on interpreting signals, anticipating risks, and guiding strategy.
These capabilities change how teams predict delays, surface issues, and respond to shifting priorities — making milestone tracking proactive rather than reactive.
Predictive analytics for at-risk milestones
AI analyzes historical project data to identify patterns that human managers might miss. By evaluating factors such as task completion rates, team workload, and past performance, the system flags milestones that are statistically likely to be delayed weeks before the deadline approaches.
This predictive insight allows teams to adjust resources or scope proactively. monday work management’s portfolio risk insights scans project boards to quickly flag potential risks by severity, helping teams spot critical issues at a glance.
Automated status intelligence
Automation eliminates the manual drudgery of status reporting. Systems now aggregate data from code repositories, design platforms, and task lists to update milestone status automatically.
When the underlying criteria for a milestone are met, the status flips to Complete instantly, ensuring stakeholders always see real-time data without waiting for a weekly report.
Dynamic resource reallocation
Intelligent platforms suggest resource adjustments based on the shifting landscape of the portfolio. If a milestone in project A is delayed, AI recommends shifting resources from project B (which has slack) to get project A back on track.
This dynamic balancing acts as an automated traffic controller for organizational talent. Modern solutions like monday work management enables teams to assign the right people to the right projects by taking into account effort, level, availability, and skills.
Real-time portfolio insights
AI aggregates milestone data across the enterprise to provide high-level insights into organizational velocity. Leaders see which departments consistently hit their targets and which struggle, allowing for targeted operational improvements.
AI analyzes historical project data to identify patterns that human managers might miss. By evaluating factors such as task completion rates, team workload, and past performance, the system flags milestones that are statistically likely to be delayed weeks before the deadline approaches.
How monday work management connects milestones to execution
Milestone charts only create real value when they’re connected to the work happening on the ground. When milestones live in separate files or slide decks, they quickly drift away from execution and become outdated snapshots.
monday work management closes that gap by linking milestones directly to live workflows. Instead of tracking progress manually, milestones update automatically as work moves forward. The result is a unified Work OS where strategy and execution stay aligned — and leadership visibility is always grounded in real-time data.
| Feature | Traditional approaches | monday work management |
|---|---|---|
| Integration | Disconnected from execution work; requires manual updates | Native integration; milestones update automatically based on task progress |
| AI enhancement | None; static data entry | AI-powered risk detection and predictive insights |
| Visibility | Siloed by project file or user license | Unified portfolio dashboards accessible to all stakeholders |
| Automation | Limited or requires third-party scripts | No-code automations for notifications, status updates, and dependency shifts |
| Scalability | Rigid structure; difficult to change as teams grow | Flexible architecture that scales from single projects to enterprise portfolios |
Unified milestone visibility across projects
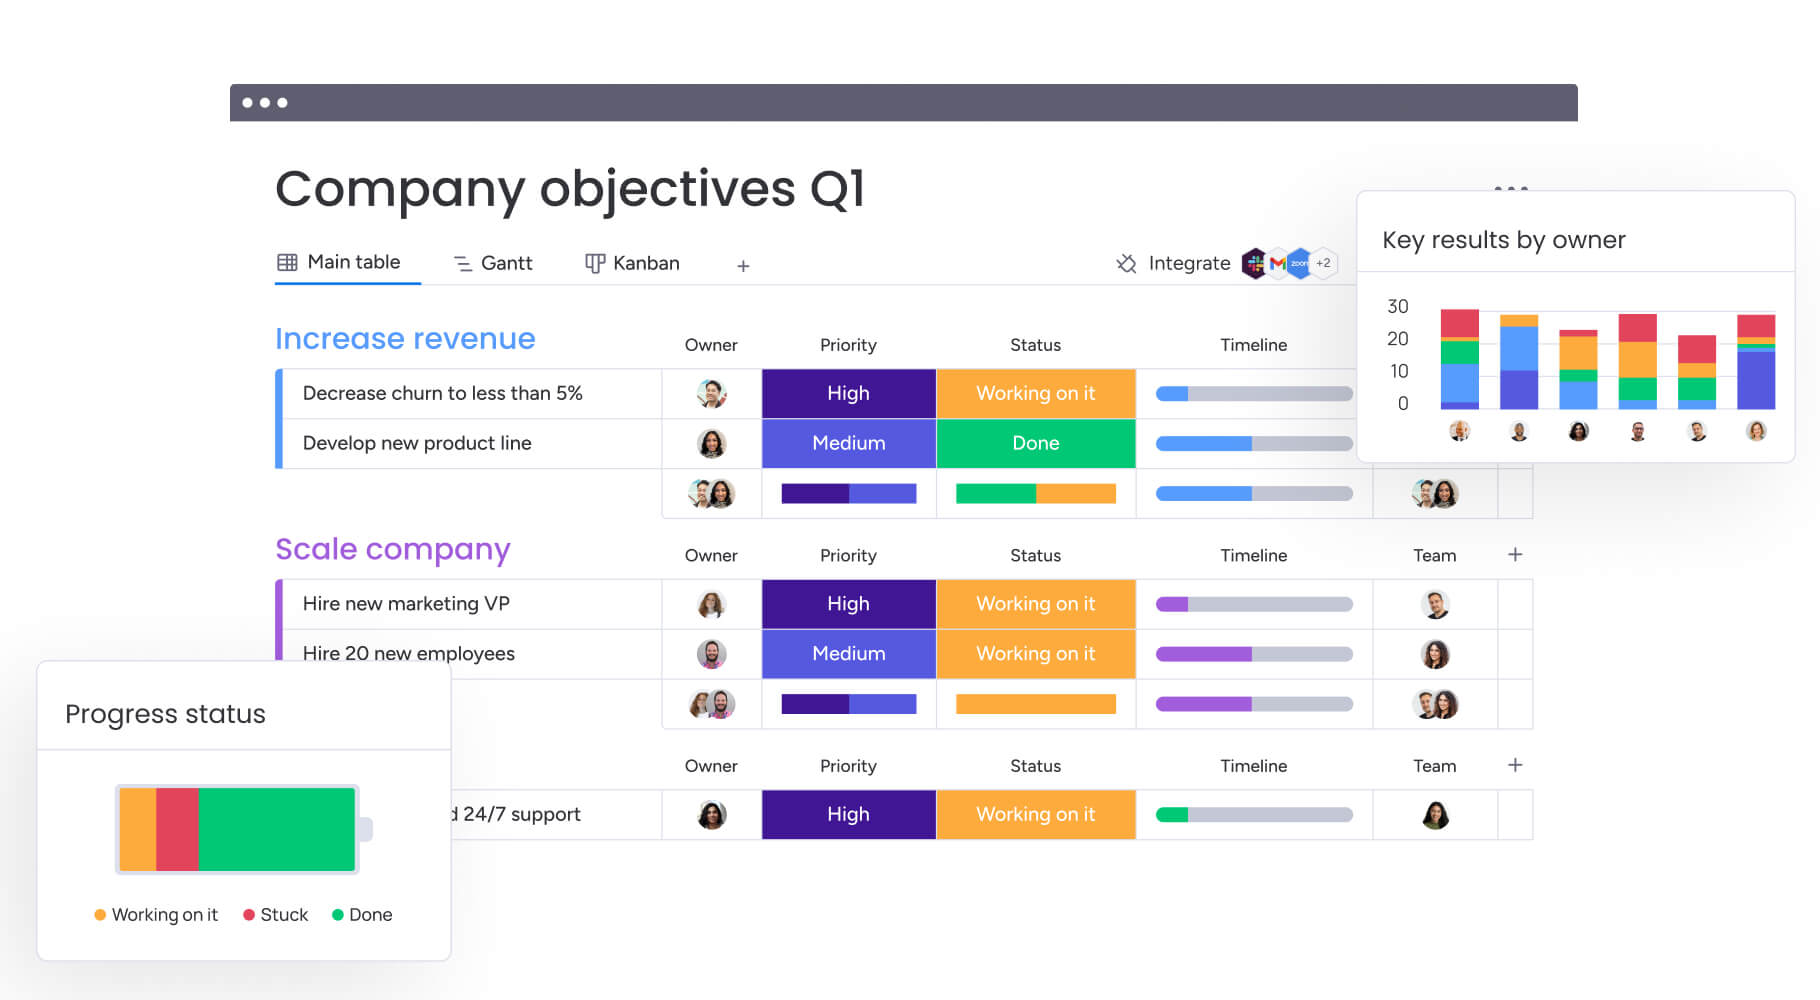
The platform enables organizations to maintain a high-altitude view of the entire portfolio while preserving the ability to drill down into specifics. Executives access dashboards that aggregate milestones from marketing, IT, and operations into a single visual interface.
This unified view eliminates data silos, ensuring resource allocation and strategic decisions are based on the complete organizational picture, not fragmented reports.
AI-powered risk detection
monday work management leverages AI to act as an early warning system. The Portfolio Risk Insights feature scans project boards to identify anomalies and potential delays.
The intelligent platform also flags milestones that are trending off-track based on the velocity of underlying tasks, allowing project leaders to address issues before they impact the critical path.
Automated team notifications
Communication latency often kills project momentum. The platform automates the flow of information by notifying relevant stakeholders the moment a milestone status changes or a risk is detected.
If a critical dependency is delayed, the owner of the dependent milestone receives an instant alert, enabling immediate coordination and reducing the need for emergency meetings.
Customizable milestone dashboards
Different stakeholders require different cuts of data. The platform allows teams to build bespoke dashboards that serve specific audiences.
A CTO might see a technical milestone view, while the CMO sees a go-to-market timeline, both pulling from the same live dataset. This flexibility ensures every viewer gets the context they need to make informed decisions.
Integration with your existing stack
Milestone tracking works best when it connects to the platforms teams already use. monday work management integrates with development platforms, CRMs, and design applications, allowing milestone data to flow seamlessly across the tech stack.
A deployment in a developer platform automatically triggers a milestone completion in the project plan, ensuring the chart always reflects reality.
“monday.com has been a life-changer. It gives us transparency, accountability, and a centralized place to manage projects across the globe".
Kendra Seier | Project Manager“monday.com is the link that holds our business together — connecting our support office and stores with the visibility to move fast, stay consistent, and understand the impact on revenue.”
Duncan McHugh | Chief Operations OfficerDrive strategic execution with milestone charts
As organizations scale, visibility gets harder. More teams, more dependencies, more moving parts. Without a clear structure, it becomes difficult to tell whether work is truly advancing strategy or just generating activity.
Milestone charts create clarity. But their real power shows up when they’re directly connected to execution — not sitting in a slide deck or separate report.
monday work management embeds milestone tracking into live workflows, so progress is always based on what’s actually happening across teams. Instead of chasing updates, leaders see momentum as it builds.
-
Connects milestones to daily work: Milestones update automatically as tasks move forward, removing manual reporting and reducing lag between execution and visibility.
-
Surfaces risks early: AI-powered portfolio insights flag at-risk milestones before deadlines slip, giving teams time to adjust.
-
Aligns work with strategy: Milestones link directly to OKRs and strategic initiatives, keeping delivery tied to measurable outcomes.
-
Scales visibility across the organization: Customizable dashboards provide executives and stakeholders with role-specific, real-time views.
-
Improves coordination without micromanagement: Smart notifications and automations keep everyone aligned while preserving team autonomy.
When milestones and execution live in the same system, strategy stops being theoretical. Teams move with clarity, leaders act with confidence, and progress becomes measurable at every level.
Frequently asked questions
How many milestones should a typical project include?
For a typical project, the recommended number of milestones is between five and ten. This provides enough granularity to track progress meaningfully without creating excessive administrative overhead.
What's the difference between a milestone and a deliverable?
The difference between a milestone and a deliverable is that a milestone marks a significant point in time or the completion of a phase, whereas a deliverable is a tangible output produced during the project.
Can milestone charts effectively show dependencies?
Yes, milestone charts can visualize high-level dependencies between major events and different projects using connecting lines or dependency columns.
How frequently should teams update milestone charts?
Teams should update milestone charts weekly for active projects, or immediately when a significant change occurs.
What's the best way to handle milestone date changes?
Date changes should follow a formal change control process involving stakeholder notification and impact assessment to maintain trust and transparency.
Which industries benefit most from milestone charts?
Industries with complex, multi-phase lifecycles such as construction, software development, pharmaceuticals, and event management derive the most value from milestone charts.
How does monday work management enhance milestone tracking compared to traditional approaches?
monday work management integrates milestone tracking directly with daily workflows, using AI to predict risks and automation to keep stakeholders informed in real-time.