
AI dashboards let you ask tough business questions and get clear, visual answers in seconds — no more waiting for manual reports or struggling with scattered data. With instant, real-time insights, every team member can explore performance and spot opportunities right when they matter most.
This guide shows you how to build impactful AI dashboards, highlights the essential features to look for, and offers practical steps to get started. You’ll also find best practices for visualization, tips to overcome common challenges, and see how these tools fit seamlessly into your work management platform.
Try monday work managementKey takeaways
- AI dashboards cut through data chaos by using natural language, so you can ask questions in simple terms and instantly see visual insights.
- Empower every team member to build clear, insightful reports in minutes, opening up data-driven decisions to everyone and removing slowdowns across your organization.
- Smart AI tools anticipate future business trends and highlight key changes, enabling you to act swiftly on challenges and opportunities before they escalate.
- AI Blocks in monday work management sync with your real-time work data, automatically sorting information and launching workflows as new insights emerge from your live projects.
- Start with 5-7 essential KPIs for your initial dashboard and grow from there; adoption by your team is the biggest driver of lasting value, not just technical features.
What are AI dashboards and why they transform business intelligence
An AI dashboard is a data visualization platform that uses artificial intelligence to automatically analyze information and create visual reports, a technology that is rapidly gaining traction as the proportion of organizations adopting AI has more than doubled since 2017. This means you can ask questions in plain English and get charts, graphs, and insights without writing code or building reports manually.
Traditional dashboards show you what happened. AI dashboards tell you what it means and what might happen next. They spot patterns humans miss, suggest the right charts for your data, and update insights as new information arrives.
Understand the technology powering AI dashboards
AI dashboards combine 3 core technologies to transform raw data into insights.
- Machine learning finds patterns in your data.
- Natural language processing lets you ask questions like you’re talking to a colleague.
- Automated analysis runs continuously in the background, flagging important changes.
These technologies work together seamlessly. When you type “show me sales trends by region,” the AI understands your request, analyzes the data, and creates the right visualization — all in seconds.
Move from manual reporting to automated insights
The shift from manual to AI-powered reporting changes how teams work with data, much like implementing a project management dashboard across an organization. Here’s what this transformation looks like in practice:
- Manual approach: Write SQL queries, export data, build charts in Excel, update weekly
- AI approach: Ask for what you need, get instant visualizations, see real-time updates
This isn’t just about saving time. It’s about making data accessible to everyone, not just technical experts. For the last decade, traditional self-service BI tools have hit a ceiling; of all the decision-makers who could benefit from them, only 20% do so today due to technical barriers.
Gain the decision-making advantage of AI dashboards
Speed matters when you’re making business decisions. AI dashboards compress the time between question and answer from days to minutes. You spot opportunities faster, respond to problems sooner, and base decisions on current data instead of last month’s report.
But the real advantage? Anyone can do it. Your marketing manager doesn’t need to wait for an analyst, your sales director can explore data during a meeting, and executives can rely on executive dashboards for immediate insights. Your operations team can track performance without learning SQL.
How AI dashboards accelerate business success
AI dashboards do more than display data — they actively help your organization move faster and make smarter decisions, ultimately boosting organizational efficiency. Let’s explore the specific ways they create measurable business impact.
1. Turn raw data into decisions in minutes
AI dashboards take data from all your systems and instantly transform it into actionable insights. The AI processes information from databases, spreadsheets, and cloud apps simultaneously, finding connections you’d never spot manually.
This speed changes how teams operate. Instead of waiting for weekly reports, you see what’s happening now. Paired with the right productivity software, AI dashboards eliminate guesswork by clearly visualizing trends in real time.
2. Democratize insights across teams
Natural language queries mean anyone can create reports. Type what you want to know, and the AI builds the dashboard. No training required, no technical skills needed.
This democratization has profound effects on organizations. Teams move faster when they don’t wait for analysts. Decisions improve when everyone can see the data. Innovation accelerates when insights aren’t bottlenecked by technical barriers.
3. Predict and prepare for what’s next
AI dashboards don’t just show current data — they forecast what’s coming. Machine learning models analyze historical patterns to predict future outcomes, which is a critical aspect of business forecasting, giving you time to prepare and adapt.
Want to know if you’ll hit quarterly targets? The AI shows probability based on current trends. Wondering about seasonal demand? The dashboard predicts peaks and valleys before they arrive.
Try monday work managementCore features every AI dashboard builder needs
Choosing the right AI dashboard platform requires understanding which features actually matter for your business. Some capabilities are essential for any implementation, while others add value for specific situations.
| Essential Features | Advanced Features |
|---|---|
| Natural language querying | Predictive modeling |
| Multiple data source connections | Custom AI model integration |
| Automated visualization suggestions | Advanced anomaly detection |
| Real-time data updates | Automated narrative generation |
| Role-based access controls | Multi-tenant architecture |
| Mobile responsiveness | API-first development |
Seamless data source integration
Your data lives in many places — CRM systems, marketing platforms, spreadsheets, databases. AI dashboards must connect to all of them without complex setup or ongoing maintenance.
The best platforms handle these connections automatically. They understand different data formats, sync information in real-time, and resolve conflicts when the same data appears in multiple systems. This seamless integration ensures your dashboards always show complete, accurate information.
Natural language dashboard creation
Natural language processing transforms how you interact with data. Instead of learning query languages or visualization software, you simply describe what you want to see.
The AI understands business terminology and context. When you ask for “customer churn rate,” it knows which data to use and how to calculate the metric. When you request “year-over-year comparison,” it automatically creates the right time-based visualization.
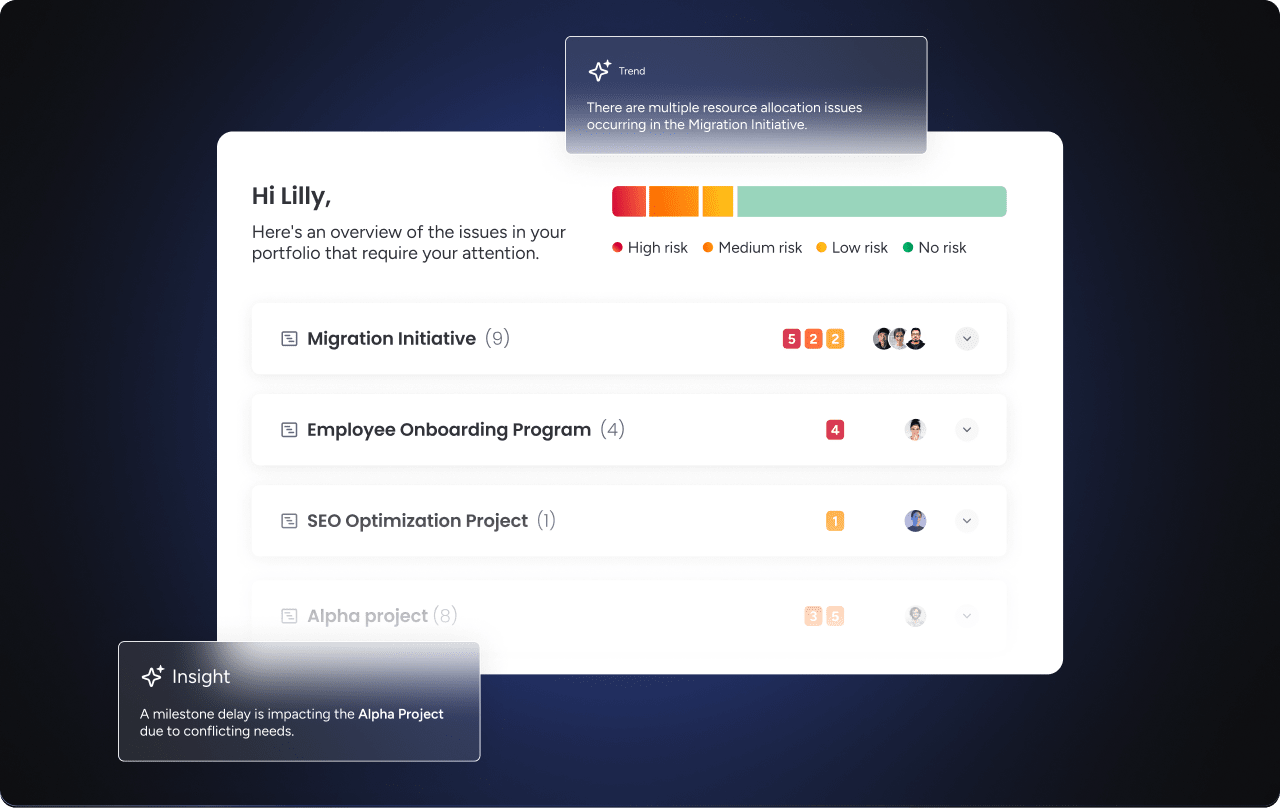
Automated insight discovery
The best AI dashboards don’t wait for you to ask questions — they proactively surface important insights. They monitor your data continuously, alerting you to significant changes, unusual patterns, or emerging trends.
These automated discoveries help you catch problems early and spot opportunities you might otherwise miss. The AI learns what matters to your business and focuses its analysis accordingly.
Real-time collaboration tools
Modern teams need to discuss data and share insights seamlessly. AI dashboards should include commenting, annotation, and sharing features that keep conversations connected to the data.
When someone spots an issue or has a question, they can comment directly on the dashboard. Team members see the discussion in context, making collaboration more effective than scattered email threads or chat messages.
Build your first AI dashboard in 7 steps
Creating an effective AI dashboard doesn’t require technical expertise, but it does benefit from a structured approach. Using a dashboard template can also speed up the process. These steps will guide you from initial setup to a fully functional dashboard that drives real business value.
Step 1: Connect and unify your data sources
Start by identifying where your important data lives. Most businesses have information scattered across multiple systems — sales data in CRM, marketing metrics in automation platforms, financial information in accounting software.
List your primary data sources and establish connections one at a time. Start with your most reliable and valuable data, then expand to include additional sources as you build confidence.
Step 2: Define business-critical KPIs
Focus on metrics that directly impact your business decisions. Different roles need different KPIs to be effective:
- Sales teams: Pipeline velocity, conversion rates, average deal size
- Marketing teams: Lead quality, campaign ROI, customer acquisition cost
- Operations teams: Process efficiency, resource utilization, quality metrics
- Finance teams: Cash flow, budget variance, profitability by segment
Choose 5-7 core metrics to start, ideally displayed within a KPI dashboard. You can always add more later, and since AI adoption rates vary significantly by department, consider starting with a team like marketing, where usage is already high.
Step 3: Describe your dashboard vision in plain language
Write a clear description of what you want your dashboard to show. Be specific about metrics, update frequency, and who will use it.
For example: “I need a daily sales dashboard showing pipeline health, team performance, and deal velocity. It should highlight at-risk deals and compare current performance to targets. The sales team will check it each morning.”
Step 4: Review AI-generated visualizations
Examine the charts and layouts the AI creates. Check that data appears accurate, visualizations communicate clearly, and the overall design supports decision-making.
Always review the first version critically. The AI makes intelligent suggestions, but you know your business best. Adjust chart types, reorganize layouts, or request different visualizations until the dashboard serves your needs perfectly.
Step 5: Customize views for different teams
Create variations of your dashboard for different audiences. Personal dashboards empower executives with high-level summaries, managers with departmental details, and individual contributors with metrics relevant to their daily tasks.
Set appropriate access permissions for each view. This ensures people see relevant information without being overwhelmed by data meant for other roles.
Step 6: Configure automated alerts and actions
Set up intelligent notifications for important changes. Define thresholds for key metrics and specify who receives an alert when those limits are exceeded.
Make alerts actionable by including context and suggested responses. Instead of just saying “Sales are down,” provide comparison data and potential causes.
Step 7: Deploy and gather team feedback
Roll out your dashboard to a small group first. Watch how they use it, listen to their feedback, and make adjustments based on real-world usage.
Successful deployment isn’t just technical — it’s about adoption. Make sure users understand the value, know how to access insights, and feel comfortable suggesting improvements.
Once you’ve built your first dashboard, the next step is making sure it delivers lasting value. These best practices ensure your dashboards stay actionable and relevant as your business evolves.
Try monday work managementAI dashboard best practices
Great AI dashboards guide people toward better decisions. The challenge is designing them in a way that surfaces what really matters, while keeping complexity out of the way. The following best practices will help you get the most from your dashboards:
1. Spot anomalies faster than humans
AI dashboards continuously monitor your data and flag irregularities — from sudden churn spikes to unusual dips in revenue. As covered earlier in automated insight discovery, this proactive detection helps teams act before small issues become major problems.
2. Focus on the metrics that matter
A dashboard that tries to display everything usually communicates nothing. Limit each dashboard to 5–7 KPIs that directly influence decisions. For example, a sales dashboard might track pipeline velocity, win rates, and forecast accuracy — not 20 overlapping metrics. Clarity ensures every number connects to action.
3. Match visualizations to real decisions
Different questions call for different chart types. Use line charts to forecast sales trends, bar charts to compare campaign performance, and gauges to highlight real-time operational thresholds. When visualization matches the decision context, users can grasp insights and act on them faster.
4. Don’t just report — predict
AI dashboards don’t just report the past — they forecast what’s ahead. Machine learning models anticipate revenue shifts, seasonal peaks, or churn risk, helping teams plan proactively.
Common AI dashboard challenges (and how to solve them)
Even with the right design, implementing AI dashboards comes with hurdles. The good news: Most challenges are predictable and manageable when you plan ahead. Here’s how to address the most common obstacles.
Data quality and consistency
AI is only as reliable as the data it analyzes. Protect against this by enforcing validation rules, standardizing formats across systems, and assigning clear ownership for data governance.
Driving adoption
Even the smartest dashboards won’t make an impact if people don’t use them. Provide training that focuses on outcomes, not features, a critical step when research shows 60% of employees believe better training would improve change management.
Show employees how dashboards solve real problems — like auto-flagging underperforming campaigns or predicting when deals will stall — instead of focusing on technical features. Demonstration builds trust faster than training alone.
Balancing security and accessibility
Dashboards need to strike a balance: making data widely available without exposing sensitive information. Role-based permissions, encryption, and audit trails allow executives to see forecasts while keeping financial or HR data restricted. This way, teams collaborate confidently without compromising compliance.
Keeping dashboards relevant
Business conditions change quickly, and so should your dashboards. Schedule quarterly reviews to assess which metrics are still useful and which need updating. Retire unused views, add new data sources, and refresh KPIs to keep dashboards aligned with evolving priorities.
Try monday work managementCreate your AI dashboards with monday work management
As part of the broader category of business management software solutions, monday work management seamlessly integrates AI dashboard capabilities directly into your current workflows. Build intelligent dashboards right where your work happens.
AI Blocks for instant dashboard intelligence
AI Blocks are pre-built, plug-and-play capabilities that you can add to any dashboard in just a few clicks. These smart tools handle complex analysis automatically, transforming raw data into actionable insights.
Key AI Blocks for dashboards include:
- Categorize: Automatically organize data by type, urgency, or custom criteria
- Summarize: Create concise overviews of complex information
- Extract Info: Pull key details from documents and emails automatically
- Detect Sentiment: Analyze feedback to understand stakeholder satisfaction
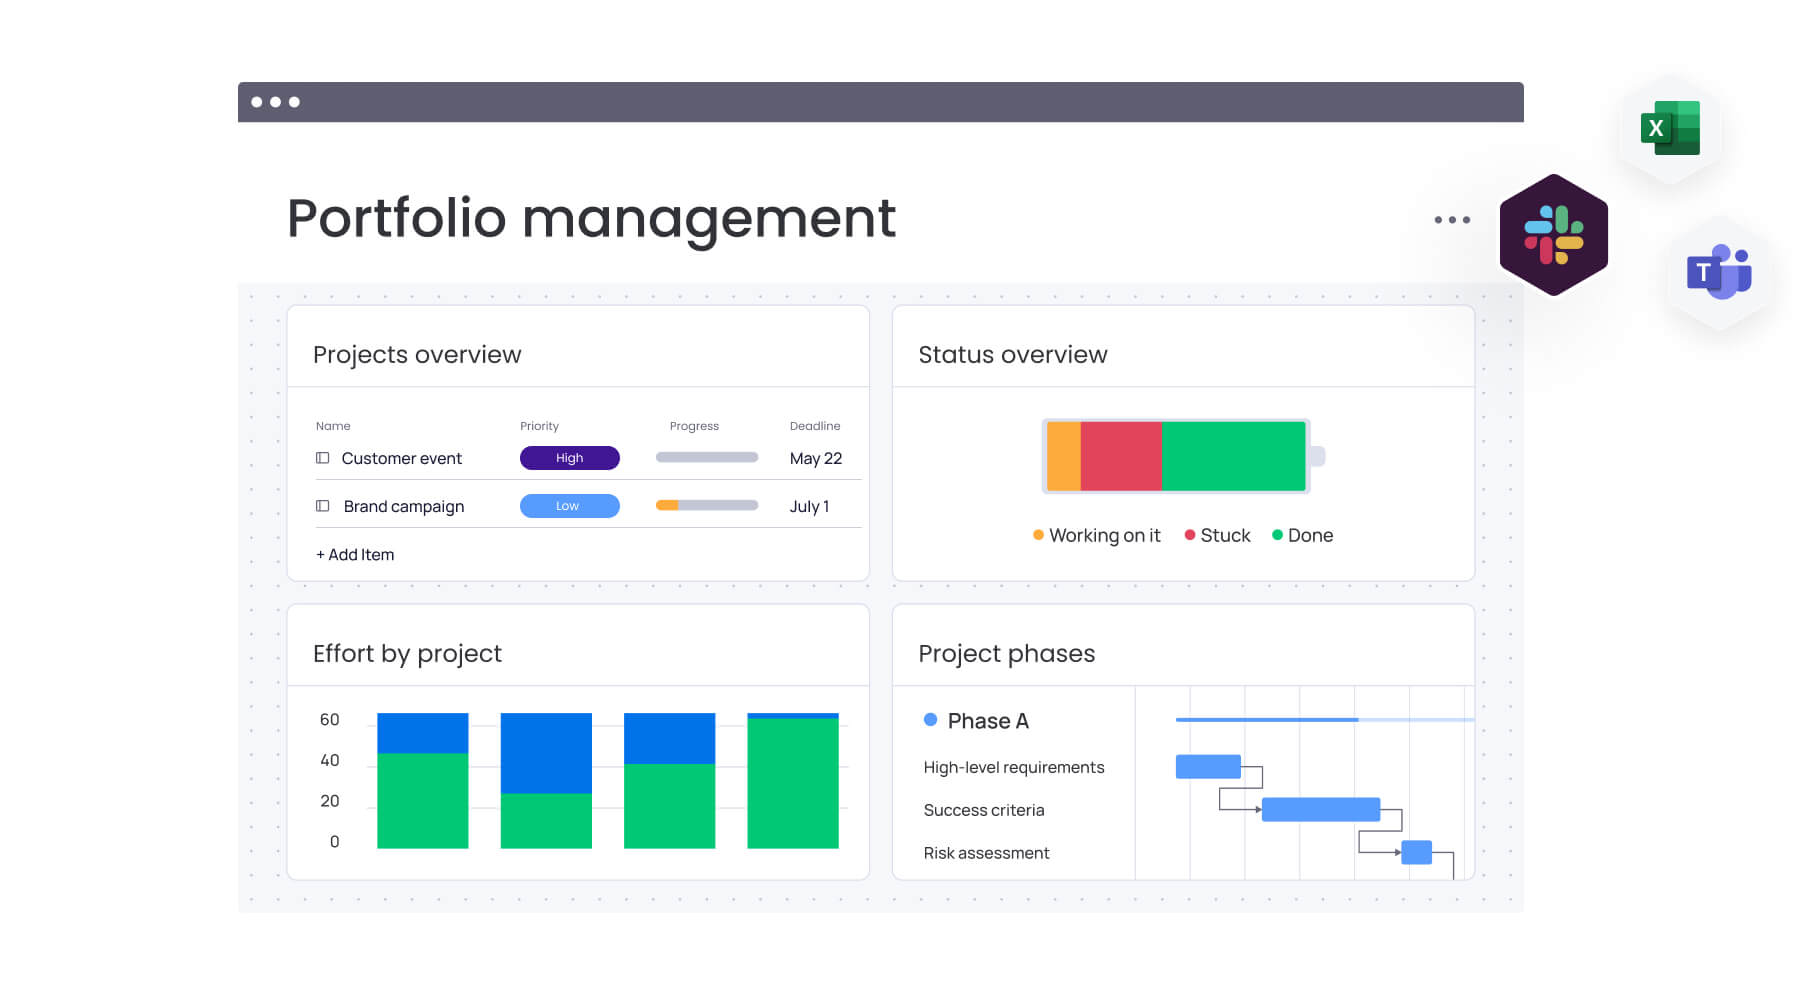
Connect dashboards to live work data
Your dashboards connect directly to active projects, showing real-time progress instead of historical snapshots. See exactly where work stands, who’s overloaded, and what needs attention right now.
This live connection means dashboards always reflect current reality. When project status changes, dashboards update instantly. When new data arrives, insights refresh automatically.
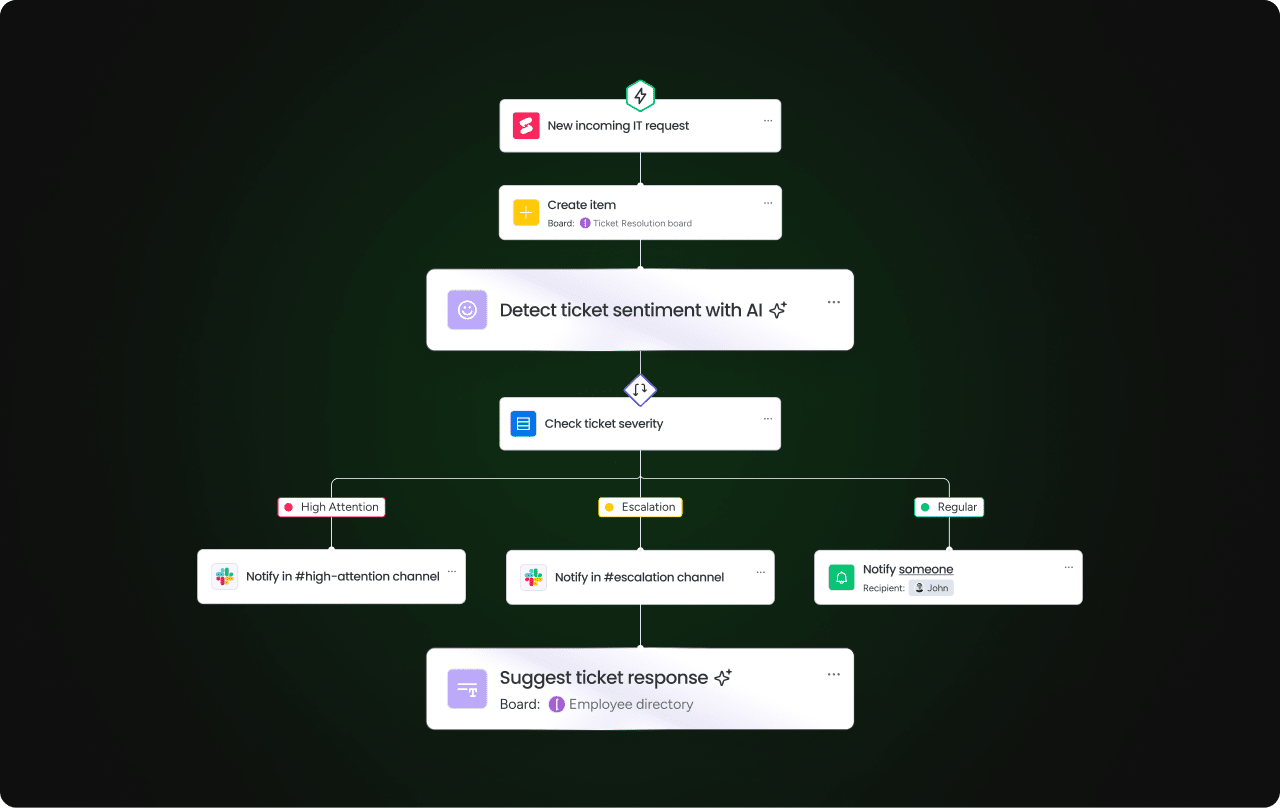
Automate actions based on dashboard insights
Unlocking insights is just the beginning. What matters is what you do next. With automations that spring into action based on real-time dashboard data, you can turn discoveries into outcomes instantly. With monday work management, you can set up workflows that automatically respond to key changes. Need a hand getting started? Our monday.com tutorial has everything you need to get the most from these powerful features.
For example:
- Alert managers when team productivity drops below targets.
- Reassign work when capacity analysis shows imbalanced workloads.
- Escalate issues when quality metrics indicate problems.
- Notify executives when KPIs deviate from goals.
Scale across teams with enterprise security
Enterprise organizations need AI dashboards that scale without compromising security, and monday work management provides comprehensive protection while enabling collaboration across departments.
Security features include granular permissions, data encryption, complete audit trails, and compliance with standards like GDPR and SOC 2. You can confidently deploy AI dashboards across your entire organization.
Ready to transform your data into actionable insights? Get Started
Unlock smarter decisions with AI dashboards
AI dashboards are transforming how organizations harness their data, making actionable insights available to everyone, not just analysts. By connecting all your data sources, automating analysis, and turning insights into action, these tools empower teams to move faster, collaborate better, and drive business outcomes with confidence.
Whether you’re just getting started or ready to expand across your organization, adopting AI dashboards means making smarter, more informed decisions — every single day. Ready to see the impact for yourself? Start building your AI dashboards with monday work management and put your data to work.
Try monday work managementFAQs
Can AI dashboards connect to multiple data sources simultaneously?
Yes, AI dashboards can connect to multiple data sources including databases, cloud applications, spreadsheets, and APIs simultaneously. Most platforms support 50+ integrations with automatic synchronization to keep data current.
How do AI dashboards ensure data security and compliance?
AI dashboards ensure security through encrypted data transmission, role-based access controls, and compliance with regulations like GDPR and SOC 2. All data processing happens in secure cloud environments with complete audit trails.
What training do teams need to use AI dashboard builders?
Teams need minimal training because AI dashboard builders use natural language interfaces. Most users can create functional dashboards within hours of first using the platform.
Do AI dashboards update automatically with new data?
Yes, AI dashboards refresh automatically based on your configured schedule — from real-time updates to hourly or daily refreshes. The AI continuously analyzes new data to surface fresh insights.
How do AI dashboards handle unstructured data like documents?
AI dashboards use natural language processing to extract insights from documents, emails, and text files. The AI converts unstructured information into structured data that can be visualized and analyzed.
Can AI dashboards generate predictive analytics?
Yes, AI dashboards analyze historical patterns to generate predictions about future trends. Machine learning models continuously improve their accuracy as they process more data.