


Many organizations strive to connect team efforts directly to their most important goals, but without the right tools, making that connection can be challenging. When your data is unified and accessible, true insight becomes actionable, and every team member gains visibility into how their work drives company-wide results.
This is where the right KPI software comes in, aligning strategic objectives with daily work and, with the help of AI, turning raw data into real-time, actionable insights for everyone.
This guide breaks down the top solutions, including monday.com’s AI Work Platform, for smarter KPI tracking, walks you through how to choose the best fit for your business, and highlights ways to sidestep common reporting challenges.
Get startedKey takeaways
- KPI software connects goals to daily work: The strongest platforms go beyond static dashboards, tying real-time metrics directly to the projects and workflows your team manages every day.
- AI insights are now table stakes: Anomaly detection, predictive analytics, and natural language querying separate modern KPI platforms from legacy reporting solutions.
- Evaluation criteria matter: Choosing the right platform depends on feature depth, ease of use, integrations, AI capabilities, and pricing — not just dashboard aesthetics.
- monday.com’s AI Work Platform unifies KPI tracking with execution: Dashboards, AI agents, and an AI app builder let teams monitor, analyze, and act on performance data without leaving the platform where work happens.
- A structured decision framework prevents analysis paralysis: Start with your KPI goals, assess team readiness, evaluate integrations, and pilot before rolling out organization-wide.
What is KPI software and why does it matter?
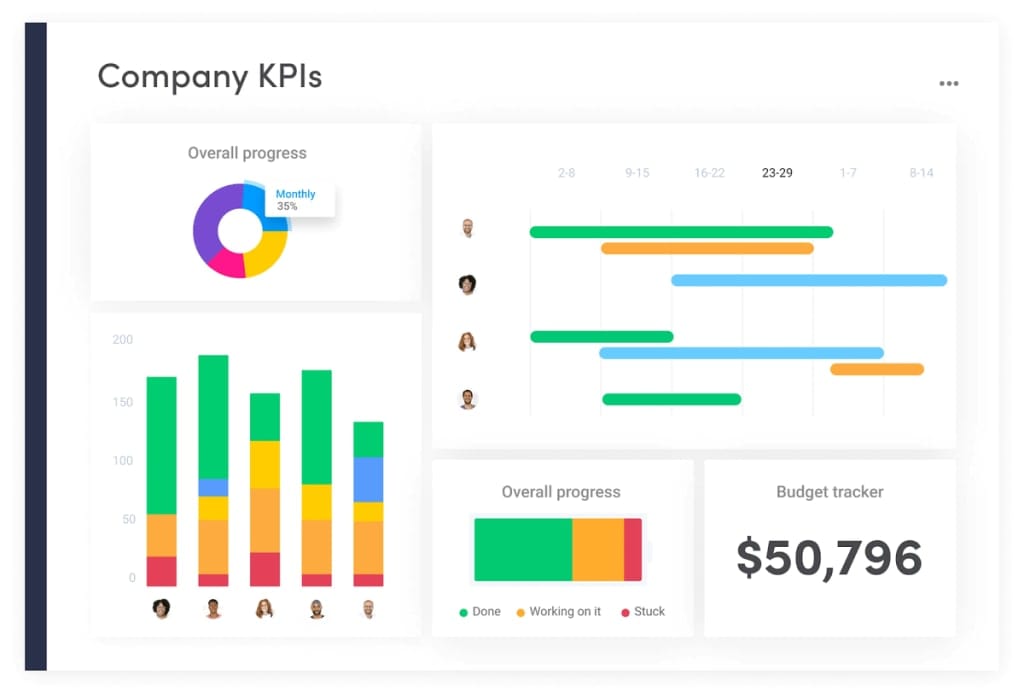
KPI software functions as a business’s central scoreboard, giving everyone a real-time view of what truly matters. It cuts through the data chaos to focus your team on the specific metrics that define success and drive your organization forward.
At its simplest, KPI software collects data from the systems your teams already use, like CRMs, financial platforms, project boards, and translates that data into visual KPI dashboards that make progress (or problems) impossible to miss.
Are your current dashboards giving you that level of insight, or are you still waiting for someone to build a custom report?
The biggest shift, though, is the convergence of KPI tracking and work execution. Standalone dashboards force teams to toggle between the platform where they view metrics and the platform where they do the work. When KPI tracking lives inside the same environment where projects, workflows, and communication happen, every dip or spike in performance is tied directly to the workflows, owners, and decisions behind it, making it far easier to act on what the data reveals.
Quick refresher: A key performance indicator (KPI) is a measurable value that shows how effectively a team or organization is achieving its goals. For example, a sales team might track monthly revenue growth, a marketing team might measure lead conversion rate, and a customer support team might monitor average response time.
How we evaluated these KPI platforms
With dozens of KPI platforms on the market, a structured evaluation framework separates the contenders from the crowd. We assessed each platform across 6 criteria that reflect what operations managers, team leads, and business analysts need when choosing KPI measurement platforms for their organizations.
Choosing a KPI platform involves more than reading feature lists. We evaluated each option through a framework designed to reflect how teams actually work with these platforms day to day. Here is what we focused on:
- Feature depth: Does the platform offer real-time dashboards, automated reporting, goal tracking, and drill-down analytics — or just surface-level visualizations?
- Ease of use: Can non-technical team members set up and customize dashboards without relying on a data analyst or IT support?
- Integrations: How many data sources does the platform connect to natively, and how seamless is the setup for pulling in data from CRMs, financial systems, and project management platforms?
- AI capabilities: Does the platform offer smart insights such as anomaly detection, predictive analytics, natural language querying, or autonomous monitoring?
- Pricing and value: Is there a free plan or trial available, and does the pricing structure scale reasonably as teams grow?
- Scalability: Can the platform support a five-person team today and a 500-person organization tomorrow without requiring a complete rebuild?
Each platform in the list below was reviewed against these criteria, with particular attention to how well it addresses the growing demand for AI-driven KPI tracking and embedded analytics.
10 essential KPI platform for smarter performance tracking in 2026
Selecting the right KPI platform means finding a solution that unlocks your team’s potential and makes it easy to connect goals with daily work. With so many options available, the best choice is the one that simplifies complexity and brings clarity to your workflow.
To help you sidestep analysis paralysis, we’ve broken down the top KPI software options in a clear comparison table below. Use this table as your shortcut to finding the platform that will become your team’s central hub for turning goals into real, measurable results — or keep reading for a deep dive into each solution.
| Platform | Use case | Free plan? | Notable feature | AI capabilities | Starting price (paid) |
|---|---|---|---|---|---|
| monday.com's AI Work Platform | Unified KPI tracking, intelligent dashboards, and workflow automation for any team | Yes | AI agents that autonomously monitor KPIs and flag risks | Sidekick, agents, vibe, AI Blocks, MCP | $9/seat/month |
| Tableau | Advanced analytics and deep data visualization | No | Interactive, highly customizable dashboards | Tableau Pulse (AI-powered insights) | $42/user/month |
| Power BI | Real-time KPI dashboards within the Microsoft ecosystem | Yes | Native integration with Microsoft 365 & Excel | Copilot for Power BI | $14/user/month |
| Sisense | Embedded analytics and KPI tracking inside your own apps | No | AI-powered insights with embeddable dashboards | AI-driven trend analysis | Custom pricing |
| Klipfolio | Quick setup of real-time, multi-source KPI dashboards | No | 130+ data source integrations & pre-built templates | AI Metric Assistant and no-code formula builder | $120/month |
| SimpleKPI | Straightforward KPI reporting for small teams | No | Extensive KPI template library and easy automation | Extensive KPI template library and easy automation | $79/month |
| Databox | Mobile-first KPI tracking and reporting | No | AI-powered summaries and SMART goal tracking | AI performance summaries | $159/month |
| Google Analytics | Web and app performance tracking | Yes | Event-based measurement and ML-powered insights | ML-powered predictions | Enterprise features: custom pricing |
| DashThis | Automated marketing KPI reporting for agencies | No | White-label customization for branded client reports | Limited | $42/month |
| Smartsheet | Spreadsheet-style KPI dashboards and project tracking | No | Excel-like interface with real-time dashboard widgets | Limited AI features | $12/user/month |
1. monday.com’s AI Work Platform
Operating on the principle that metrics should drive action, monday.com’s AI Work Platform converts KPIs into a unified command center where data fuels decisions, not just reporting. The platform connects performance tracking directly to your workflows. With a full suite of AI capabilities, it goes beyond dashboards to deliver autonomous KPI monitoring, predictive insights, and natural language data exploration.
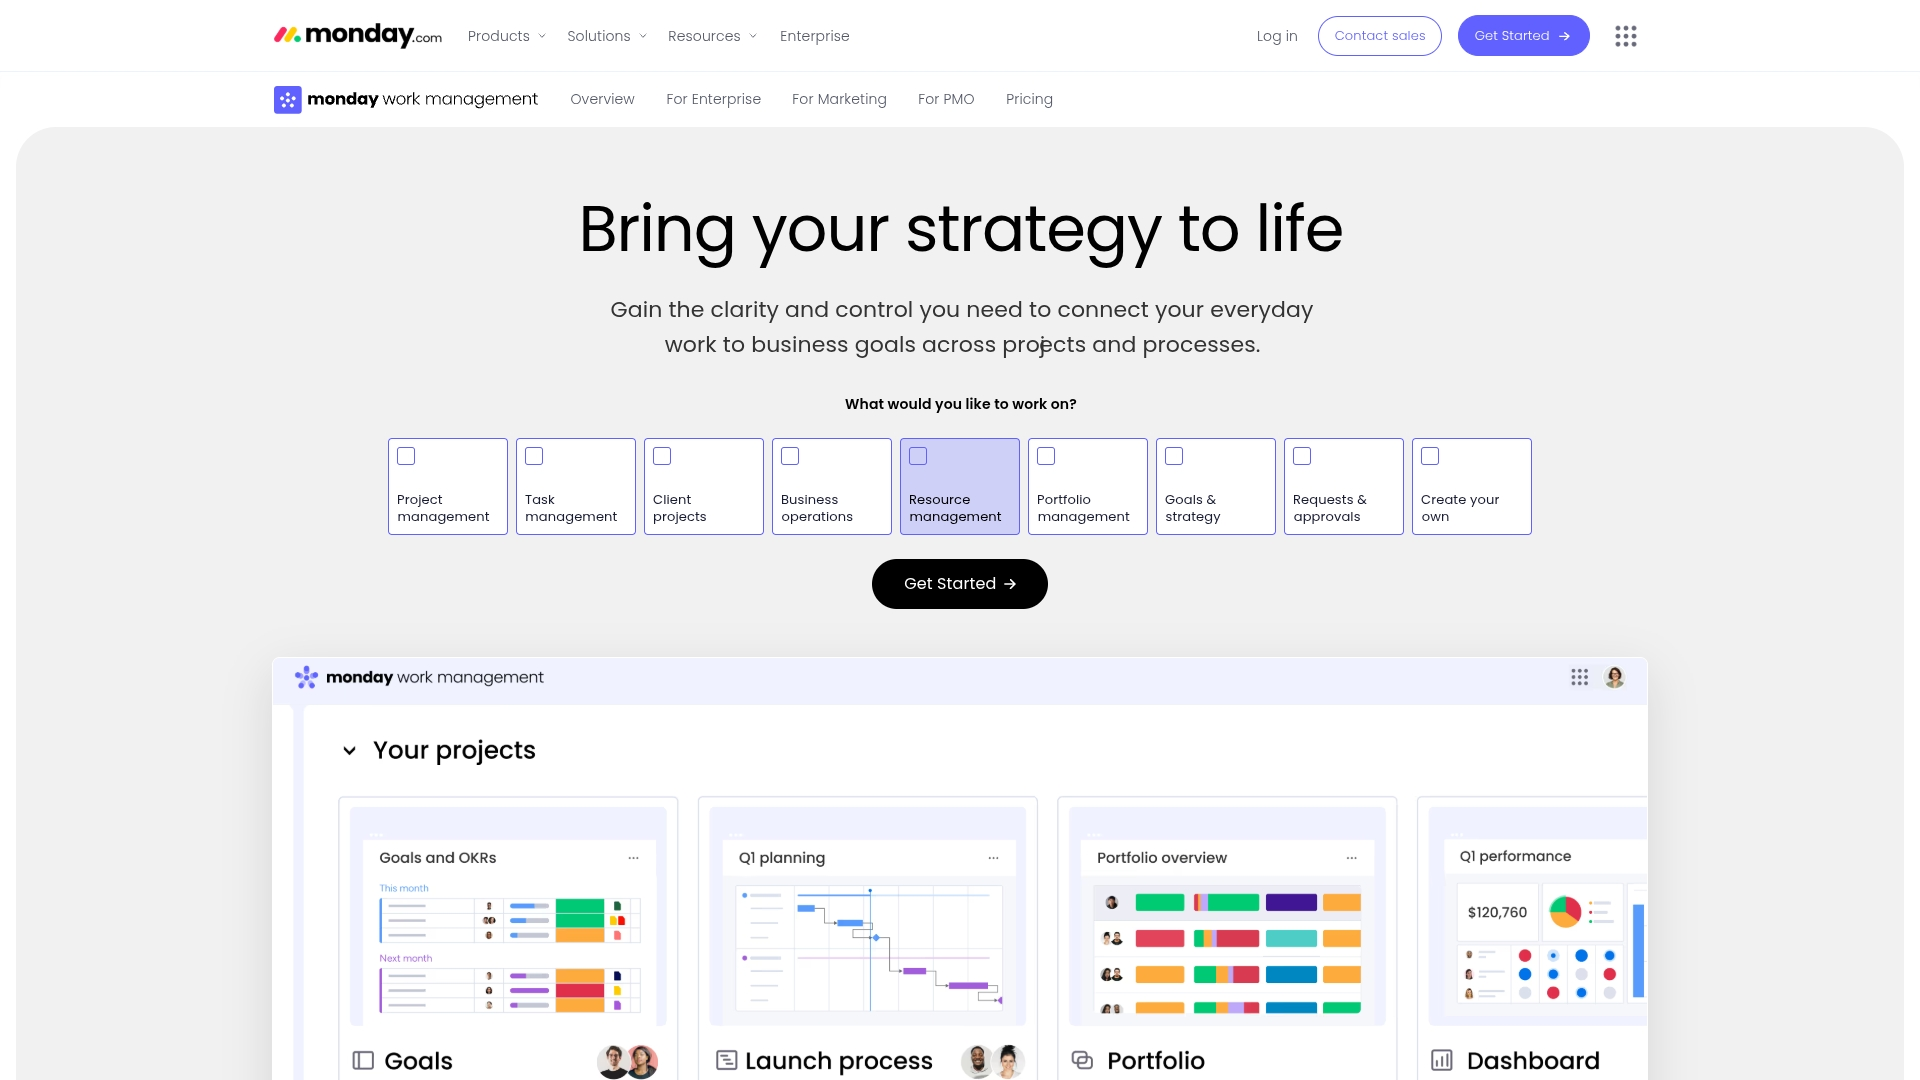
The monday.com’s AI Work Platform serves as a comprehensive work operating system that integrates KPI tracking software with project execution, creating a closed loop between measurement and action.
Key features
- Intelligent dashboards: Real-time dashboards with pattern detection, predictive analytics, and smart alerts that surface what matters most — no manual analysis required
- Autonomous AI agents: Purpose-built agents like Project Analyzer and Risk Analyzer monitor KPIs 24/7, flag bottlenecks, and recommend corrective actions before problems escalate
- No-code customization: 15+ drag-and-drop widgets let any team member build sophisticated KPI views that pull from multiple boards and 200+ external integrations
- monday sidekick: A context-aware AI assistant that analyzes KPI data, answers questions about performance trends, and plans next steps — all connected to your workspace
- monday vibe: An AI app builder that turns natural language prompts into custom KPI dashboards, OKR monitoring apps, and executive overview apps — no code required
Pricing
- Free: $0 forever (up to 2 seats, 3 boards, basic KPI tracking)
- Basic: $9/seat/month (unlimited items, dashboard based on 1 board, 500 AI credits)
- Standard: $12/seat/month (Timeline & Gantt views, 250 automations/month, dashboard combining 5 boards)
- Pro: $19/seat/month (private boards, time tracking, formula columns, 25,000 automations/month, dashboard combining 20 boards)
- Enterprise: Custom pricing (advanced analytics, enterprise security, dashboard combining 50 boards)
- Annual billing saves 18% compared to monthly billing
- Nonprofit discounts available
Why it stands out
With a G2 Ease of Use score of 9.1/10 and trusted by over 60% of Fortune 500 companies, monday.com’s AI Work Platform is the only option on this list that combines KPI dashboards, autonomous AI agents, and an AI app builder inside the same platform where teams manage daily work. That means KPI tracking isn’t a separate activity — it’s woven directly into execution.
2. Tableau
Tableau excels at weaving raw data into compelling visual stories that drive business decisions. The platform specializes in advanced data visualization and interactive dashboards, making it ideal for enterprises that need deep analytical capabilities and comprehensive KPI tracking software.
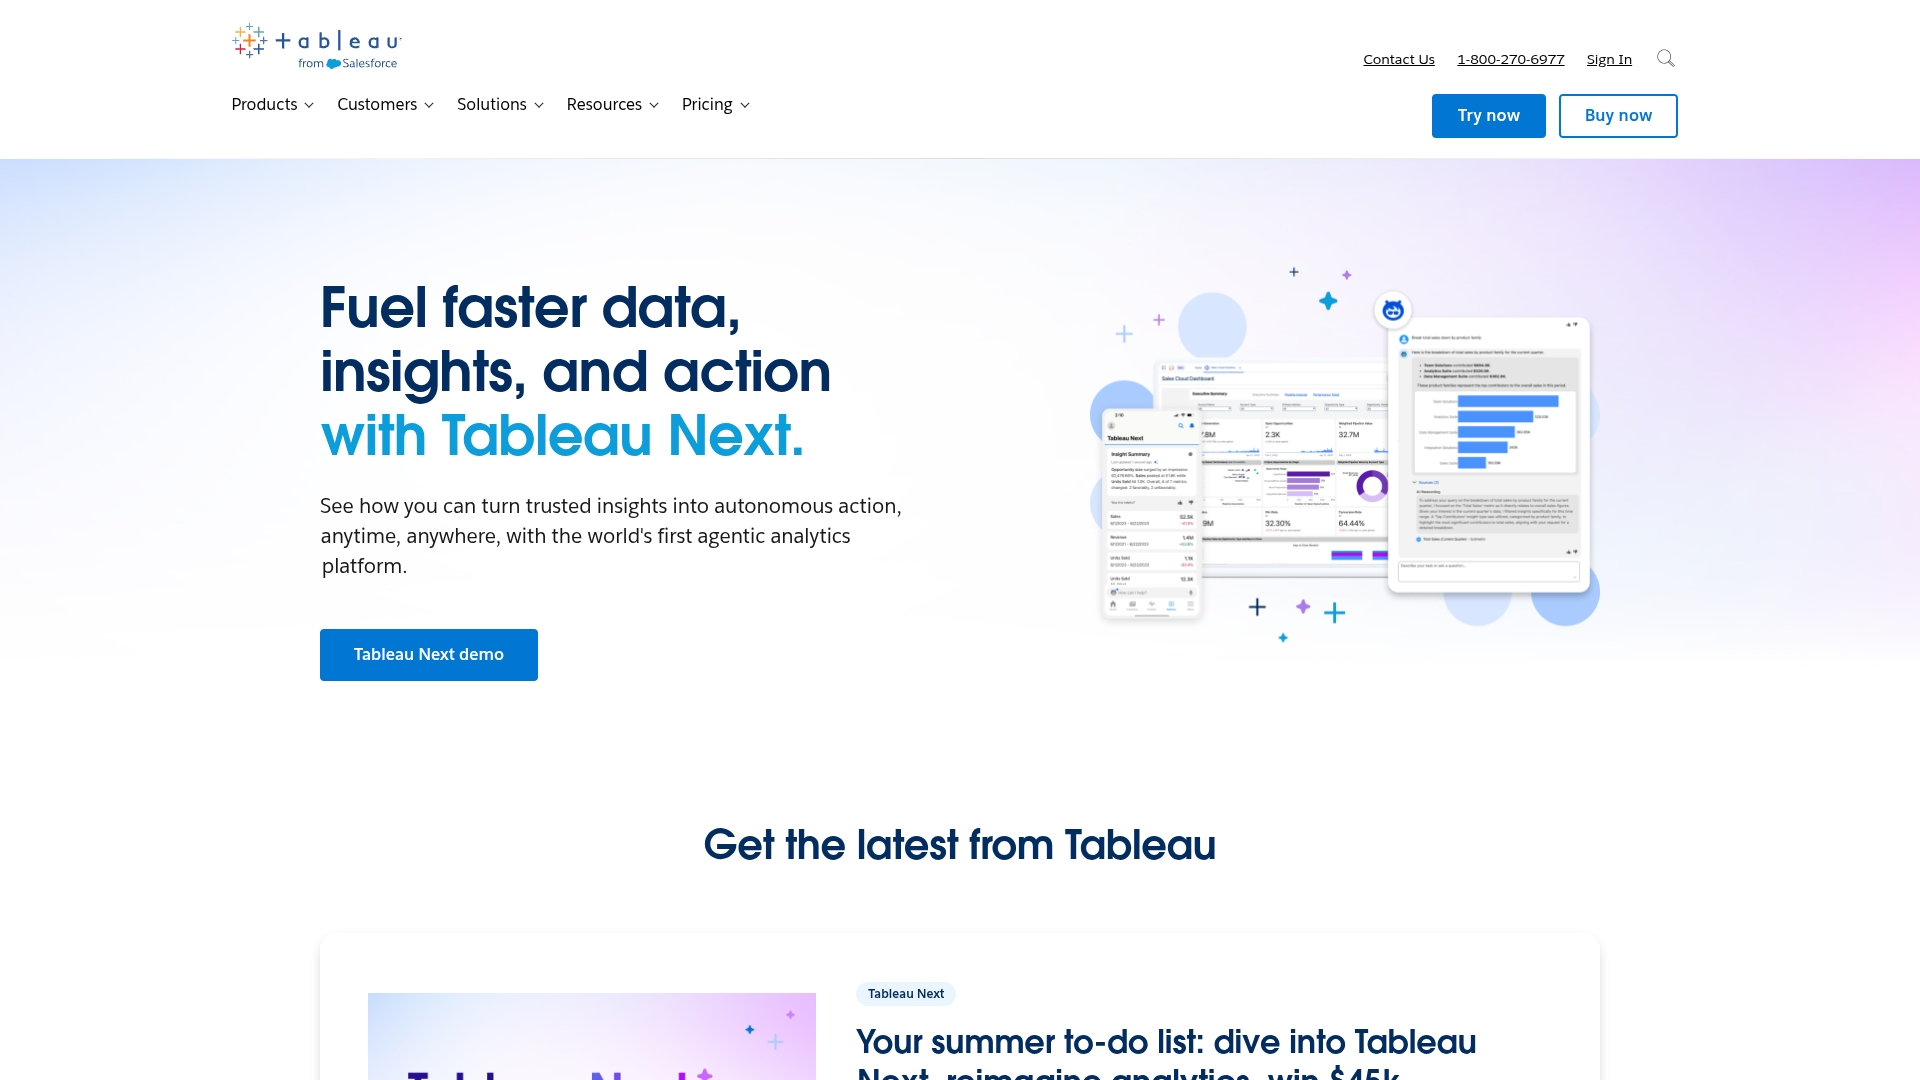
Use case: Tableau empowers organizations to create highly customized, interactive KPI dashboards that turn complex datasets into actionable insights for data-driven decision making.
Key features
- Interactive dashboards with drag-and-drop functionality for creating custom KPI visualizations
- Tableau Pulse delivers AI-powered, proactive insights on key metrics directly to your workflow
- Real-time data connectivity across multiple sources for comprehensive performance tracking
Pricing
- Tableau Creator: $42/month per user (billed annually)
- Tableau Explorer: $15/month per user (billed annually)
- Tableau+: $75/month per user (billed annually, premium cloud-only edition)
- New customers save 20% on Enterprise editions through January 31, 2026
Considerations
- Steeper learning curve for advanced features compared to simpler key performance indicators software
- Higher cost structure may not suit smaller businesses looking for basic KPI management software
3. Power BI
As Microsoft’s analytics powerhouse, Power BI unifies scattered business data into cohesive KPI dashboards that drive real decision-making. It excels at connecting diverse data sources into interactive visualizations, making it perfect for organizations already invested in the Microsoft ecosystem.
Use case: Power BI enables organizations to create comprehensive KPI tracking systems that automatically update from multiple data sources, providing real-time visibility into business performance.
Key features
- Native KPI visuals with color-coded performance indicators and trend analysis
- Centralized scorecards and metrics that can be shared across departments
- Seamless integration with Microsoft 365, Excel, and Azure for unified data workflows
Pricing
- Free Account: $0 (create and view reports, no credit card required)
- Power BI Pro: $14/month per user (paid yearly, includes publishing and sharing capabilities)
- Power BI Premium Per User: $24/month per user (paid yearly, enterprise-scale features and larger model sizes)
- Power BI Embedded: Variable pricing based on usage and capacity
- Fabric Capacity options: Variable pricing for organization-wide analytics capacity
Considerations
- Performance can slow significantly with very large datasets, potentially affecting real-time KPI monitoring
- Advanced customization requires learning DAX (Data Analysis Expressions), which has a steep learning curve for non-technical users
4. Sisense
Engineered for embedded analytics, Sisense converts complex data from multiple sources into actionable KPI insights that non-technical teams can actually use. The platform is perfect for tech companies and enterprises that need to integrate KPI tracking directly into their existing applications and workflows.
Use case: Sisense enables organizations to consolidate data from disparate sources and create interactive KPI dashboards that can be embedded directly into applications for seamless monitoring.
Key features
- Real-time interactive dashboards with drag-and-drop functionality for custom KPI visualization
- AI-powered insights that automatically surface trends and patterns in your key performance indicators
- Embedded analytics capabilities that integrate KPI tracking directly into your existing applications
Pricing
Custom pricing available upon request.
Considerations
- Advanced customization of visualizations requires coding knowledge, particularly JavaScript
- Higher price point compared to some competitors in the KPI software market
5. Klipfolio
Klipfolio provides real-time KPI dashboards that consolidate scattered business data into actionable insights, connecting over 100 data sources with pre-built metrics and visualizations. This makes it particularly valuable for small to medium businesses and marketing agencies that need quick setup without technical complexity.
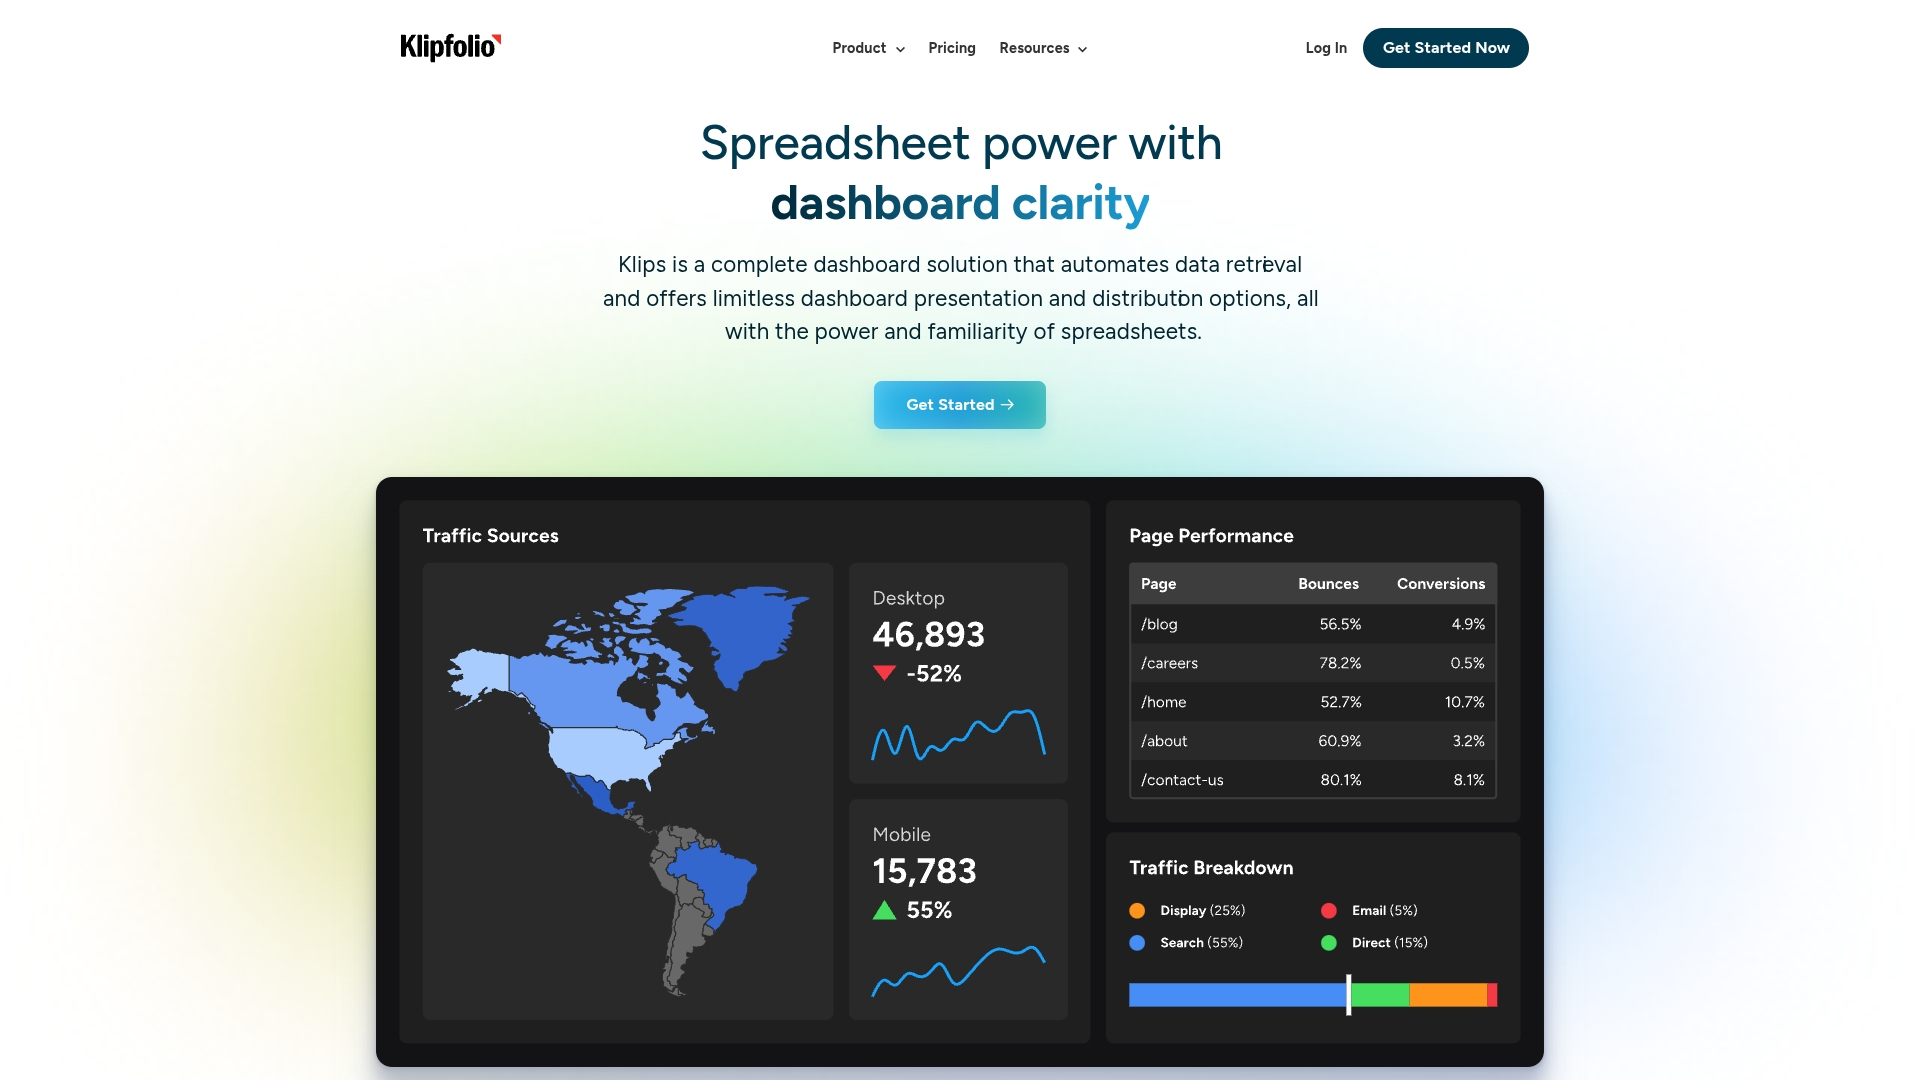
Use case: Klipfolio excels at consolidating data from multiple business applications into customizable, real-time dashboards that help teams track performance metrics and make data-driven decisions quickly.
Key features
- Real-time data monitoring with up-to-the-minute refresh capabilities across 130+ integrations including Google Analytics, Salesforce, and HubSpot
- Pre-built dashboard templates and metrics library that accelerates setup for common business functions like marketing, sales, and financial reporting
- Dual-product offering with Klips for detailed custom reporting tools and PowerMetrics for fast metric tracking and trend analysis
Pricing
- Base: $120/month (3 dashboards, unlimited team members, 4-hour data refresh)
- Grow: $190/month (10 dashboards, unlimited team members, 1-hour data refresh)
- Team: $310/month (20 dashboards, unlimited team members, 15-minute data refresh)
- Team+: $600/month (40 dashboards, unlimited team members, up-to-the-minute data refresh)
- All plans include 130+ data integrations and are billed annually
- 14-day free trial available
Considerations
- Steep learning curve for creating custom dashboards from scratch, particularly for non-technical users
- Some users report slower dashboard loading times compared to competitors and occasional limitations with API connectors not extracting 100% of data from sources
6. SimpleKPI
Prioritizing simplicity without sacrificing functionality, SimpleKPI offers straightforward tracking software designed to clarify complex performance data into actionable insights. The platform is ideal for small businesses and teams new to KPI management who want to get started quickly.
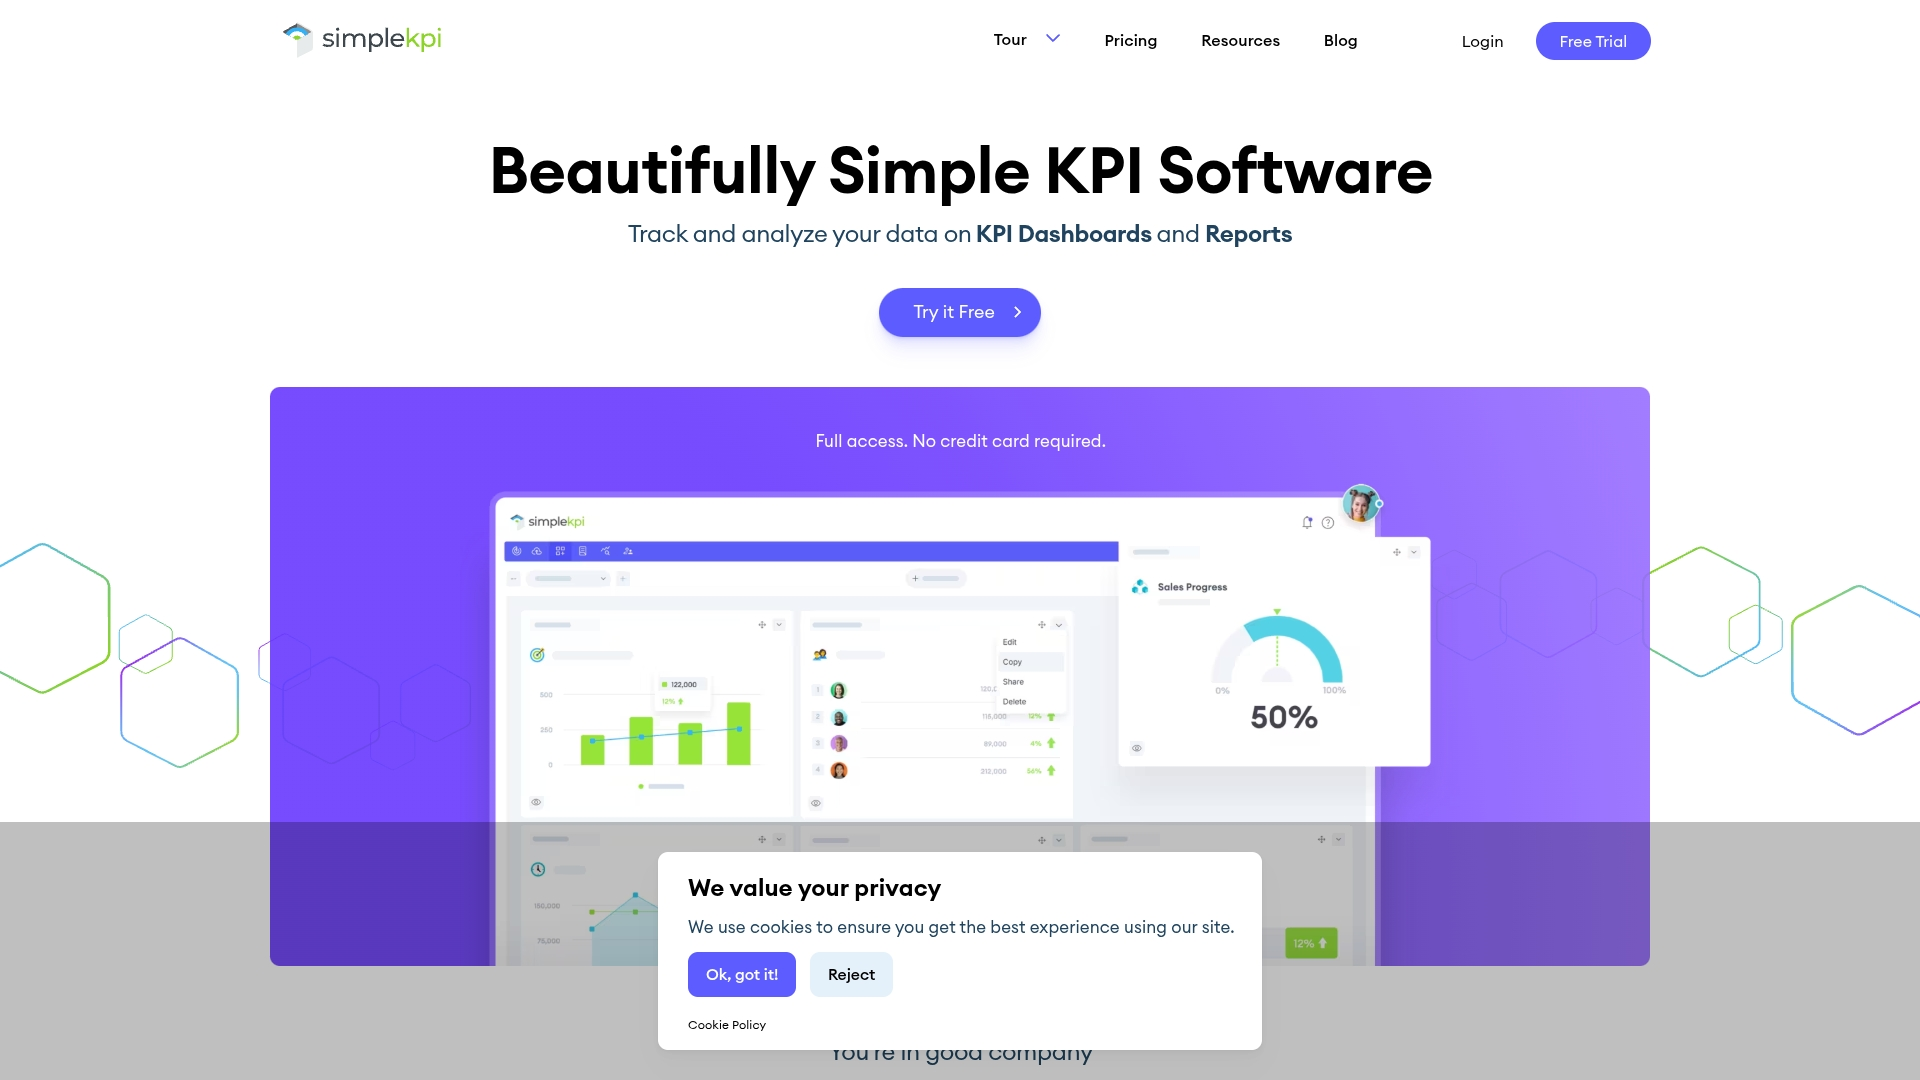
Use case: SimpleKPI helps organizations replace manual spreadsheet-based KPI tracking with automated dashboards and reports that provide real-time visibility into business performance.
Key features
- Real-time customizable dashboards with various charts, graphs, and widgets for instant performance visibility
- Extensive KPI library with industry-standard templates plus the ability to create custom KPIs with automated calculations
- Data integration from 5000+ business applications via API and connectors like Zapier, plus direct Excel spreadsheet imports
Pricing
- Single plan: $79/month (annual billing) or $99/month (monthly billing)
- Annual discount: 20% off when billed annually
- Quarterly discount: 10% off when billed quarterly
- Nonprofit discount: 50% off for charities, non-profits, and educational institutions
- Free trial: 14-day trial with no credit card required
Considerations
- Limited customization options for dashboards and reports compared to more advanced analytics platforms
- Users report occasional issues with date ranges in dashboards requiring manual correction
7. Databox
Built with a mobile-first philosophy, Databox consolidates scattered business metrics into a unified KPI tracking powerhouse that keeps your team focused on what matters most. Its pre-built dashboard templates make it perfect for remote teams and growing businesses that need instant access to their performance data.
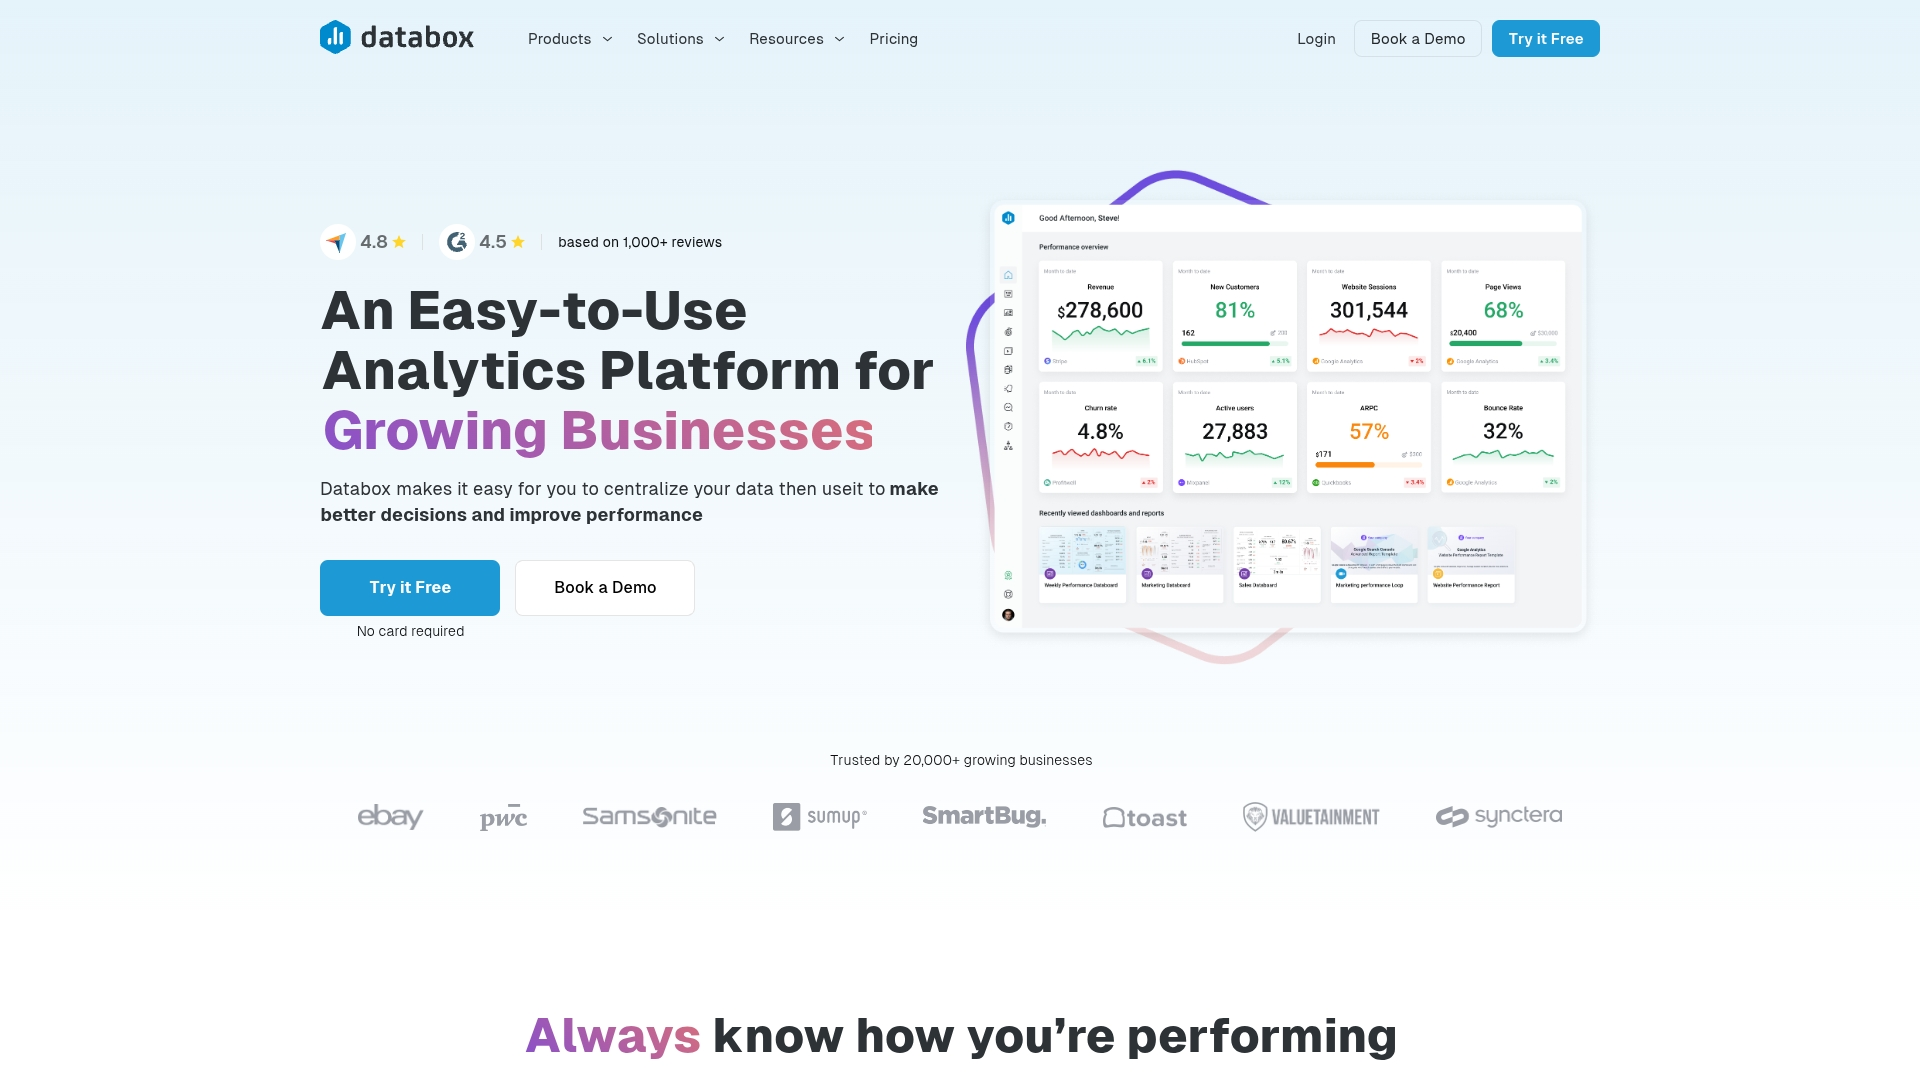
Use case: Databox centralizes KPI tracking and performance monitoring for teams that need real-time visibility into their most important metrics without the complexity of enterprise-level analytics platforms.
Key features
- Custom metric creation with no-code SQL builder and calculated metrics from multiple data sources
- AI-powered performance summaries that automatically explain data trends and fluctuations
- Goal tracking with SMART objectives, automated alerts, and industry benchmarking capabilities
Pricing
- Professional Plan: $159/month (includes 3 data sources, 24 months historical data)
- Growth Plan: $399/month (includes advanced analytics and AI features, unlimited historical data)
- Premium Plan: $799/month (includes 100 data sources, enterprise-grade support and security)
- Annual billing saves 20% across all plans
- Additional data sources cost $5.60/month each
Considerations
- Limited customization options for complex data analysis needs compared to enterprise BI tools
- Some users report occasional performance issues and broken templates that can disrupt workflow
8. Google Analytics
As the industry standard for digital performance, Google Analytics delivers comprehensive web analytics and KPI tracking for businesses looking to understand their online presence. The platform specializes in event-based measurement and seamless integration with Google’s marketing ecosystem, making it the go-to choice for organizations tracking website and app metrics.

Use case: Google Analytics helps businesses track customer interactions across websites and apps throughout the entire lifecycle, providing unified visibility into the customer journey across multiple platforms.
Key features
- Event-based measurement model that treats every user interaction as a distinct event for granular tracking
- Machine learning-powered insights that automatically surface trends and predict future customer actions
- Cross-platform attribution to understand the full user journey and marketing impact across devices
Pricing
- Google Analytics: Free for standard features
- Google Analytics 360: Enterprise pricing available upon request
Considerations
- Limited to digital metrics only, making it unsuitable for tracking offline KPIs or non-digital business processes
- Steep learning curve with GA4’s new interface and event-based model requiring different analytical thinking
9. DashThis
Designed to eliminate hours of manual work, DashThis provides automated marketing KPI reporting software that transforms scattered campaign data into polished, professional reports. The platform specializes in simplifying complex marketing analytics for agencies and marketing teams. With white-label capabilities and extensive integrations, it’s built specifically for professionals who need to showcase results to clients and stakeholders quickly.
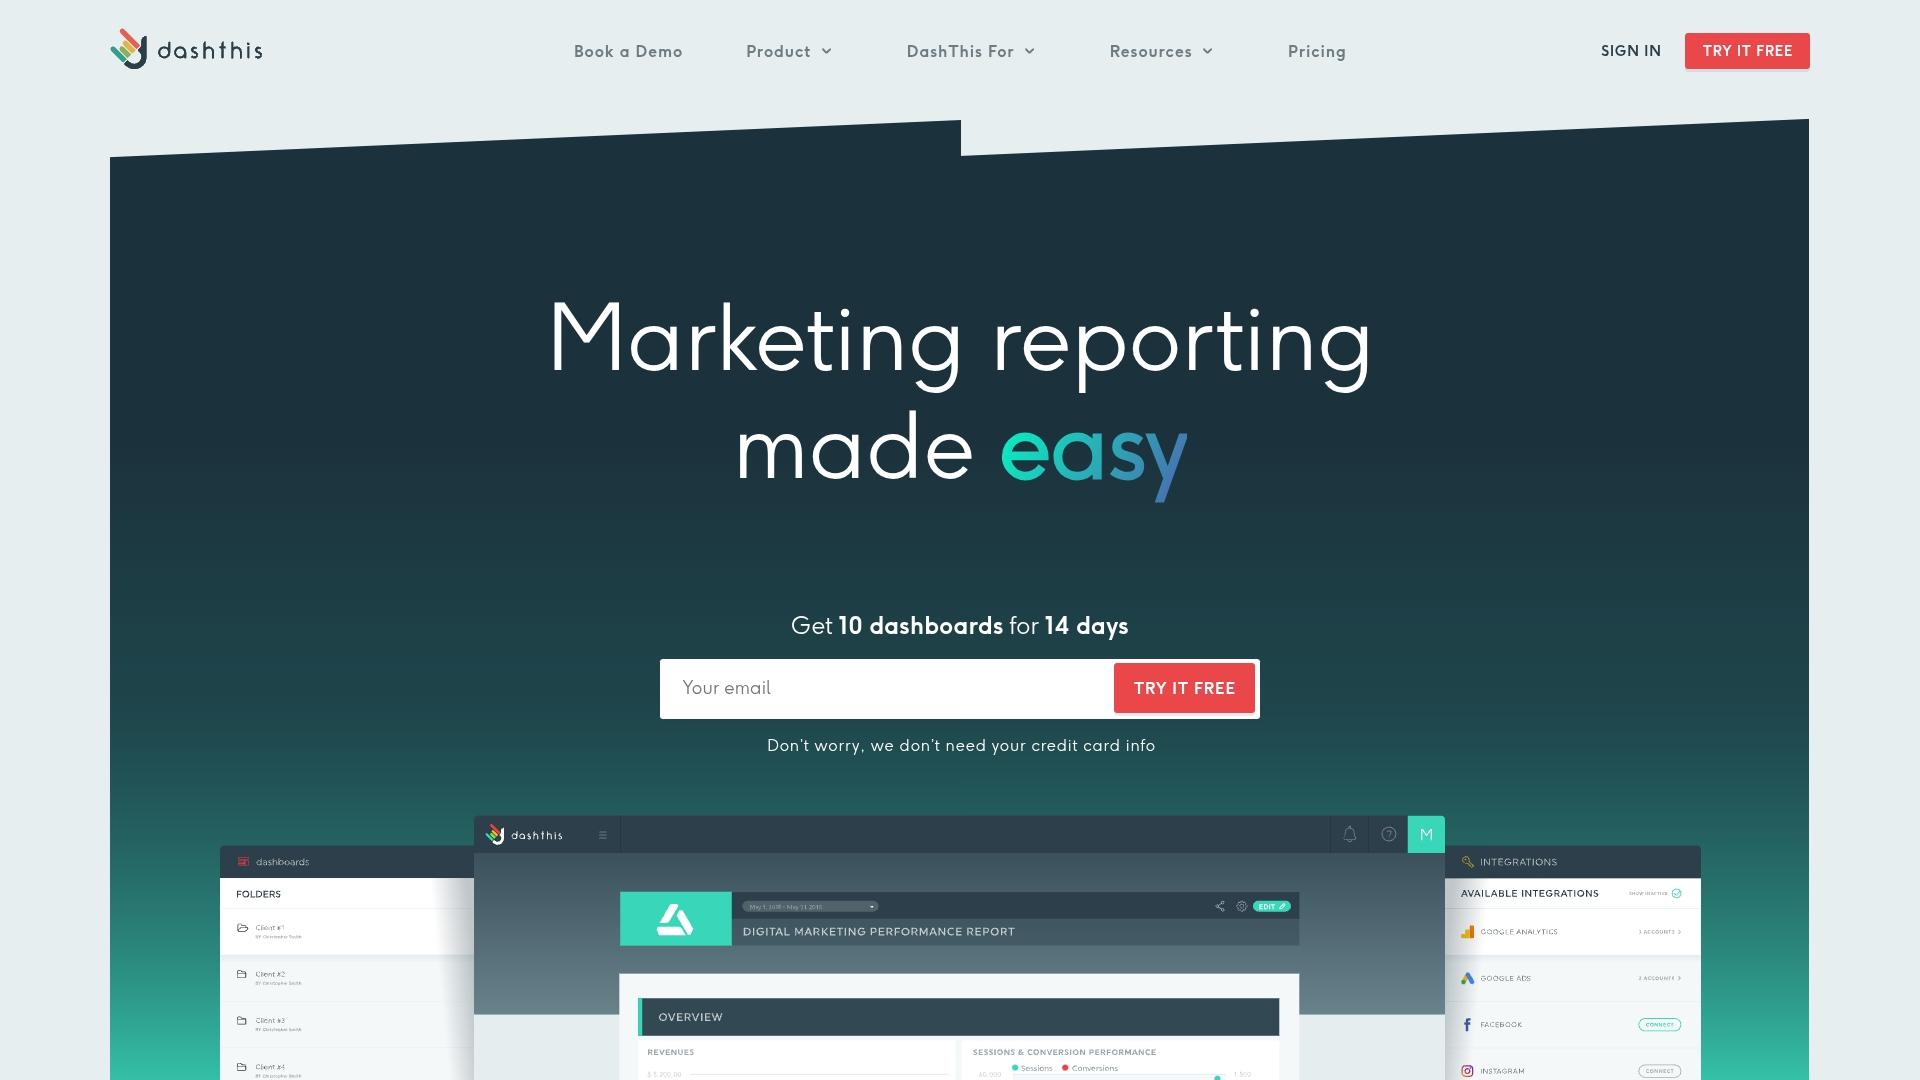
Use case: DashThis automates the creation of branded marketing reports by pulling data from over 34 platforms into customizable dashboards, saving agencies and marketing teams hours of manual work each month.
Key features
- Automated data collection from Google Analytics, Facebook, LinkedIn, and 30+ other marketing platforms
- Drag-and-drop dashboard builder with preset templates for different marketing strategies
- Complete white-label customization including logos, custom domains, and branded email delivery
Pricing
- Individual: $49/month or $42/month (billed annually) for 3 dashboards
- Professional: $159/month or $135/month (billed annually) for 10 dashboards
- Business: $309/month or $264/month (billed annually) for 25 dashboards
- Standard: $479/month or $409/month (billed annually) for 50 dashboards
- Custom plans are available for higher volume needs
- 15-day free trial with up to 10 dashboards
- 30% discount available for nonprofit organizations
Considerations
- Limited to marketing-focused KPIs, making it less suitable for broader business intelligence needs
- Pricing structure based on dashboard count can become expensive for agencies managing many clients
10. Smartsheet
Leveraging its familiar spreadsheet-like interface, Smartsheet translates complex data into actionable KPI insights. The platform specializes in customizable dashboards and metric tracking, making it ideal for teams who need powerful analytics without abandoning their Excel-like workflows.
Use case: Smartsheet enables organizations to create highly customizable KPI dashboards that aggregate data from multiple sources while maintaining the familiar feel of spreadsheet-based work management.
Key features
- Real-time dashboards with 30+ widget types for visualizing KPIs across departments
- Metric sheets that consolidate and calculate performance data from various sources
- Pre-built KPI dashboard templates for project management, sales, and efficiency tracking
Pricing
- Pro: $12/month per member (billed monthly) or $120/year per member (billed annually)
- Business: $25/month per member (billed monthly) or $228/year per member (billed annually)
- Enterprise: Custom pricing for 10+ members with advanced security and governance features
- Advanced Work Management: Custom pricing with premium connectors and support
- Add-ons like Dynamic View ($125/month) and Data Shuttle ($100/month) available for Business and Enterprise plans
Considerations
- Complex KPI setups require understanding of formulas and cross-sheet referencing, which can be challenging for non-technical users
- Mobile app functionality for dashboard creation and editing is limited compared to desktop experience
What to look for in KPI software
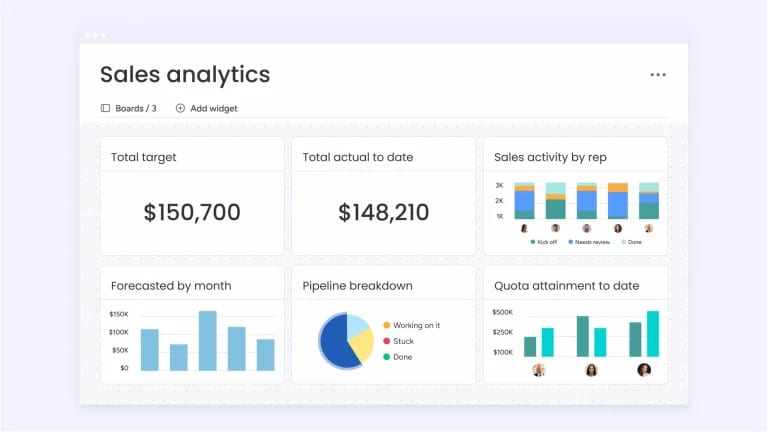
Finding the right KPI software is about more than flashy dashboards. It’s about equipping your team with a tool that makes it easy to track progress, adapt fast, and stay laser-focused on what moves the needle. Here’s what to prioritize:
- Real-time, actionable dashboards. Your software should update live, so you’re always seeing the story as it unfolds, not just a snapshot of yesterday. Look for platforms that cut through the clutter and surface the metrics that actually drive your work forward.
- No-code customization. You shouldn’t need a data science degree to set up or adjust your dashboards. The best solutions let your team connect KPIs directly to projects, budgets, and timelines without technical barriers.
- Seamless integrations. Choose a tool that connects easily with your existing apps — think CRM, financial software, and project management tools, so you’re not manually chasing down updates or toggling between tabs.
- Powerful automations. Automate routine reporting, alerts, and next steps. The right platform will trigger actions the moment a KPI hits a threshold, keeping your team moving (and nothing slipping through the cracks).
- Scalability for every stage. Whether you’re a five-person startup or a global enterprise, your KPI software should grow with you — no need to rip and replace as your business evolves.
- Intuitive, adoption-ready design. If a platform feels clunky or confusing, nobody will use it. Prioritize solutions your team will actually open every morning, and that help everyone see how their work connects to the bigger picture.
- Real-time insights. Don’t settle for retroactive reporting. Modern KPI tools put AI to work spotting risks, forecasting outcomes, and translating complex trends into plain-English recommendations, so you’re always one step ahead.
-
Template and customization flexibility. Every organization tracks different metrics. Prioritize platforms that offer both pre-built KPI dashboard templates for quick wins and deep customization for teams that need tailored views by department, region, or business unit.
With monday.com’s AI Work Platform as your business intelligence tool, you get all of this in a platform that’s built to unify your team’s goals, automate the busywork, and turn real-time data into real results.
Get startedHow to choose the right KPI management platform
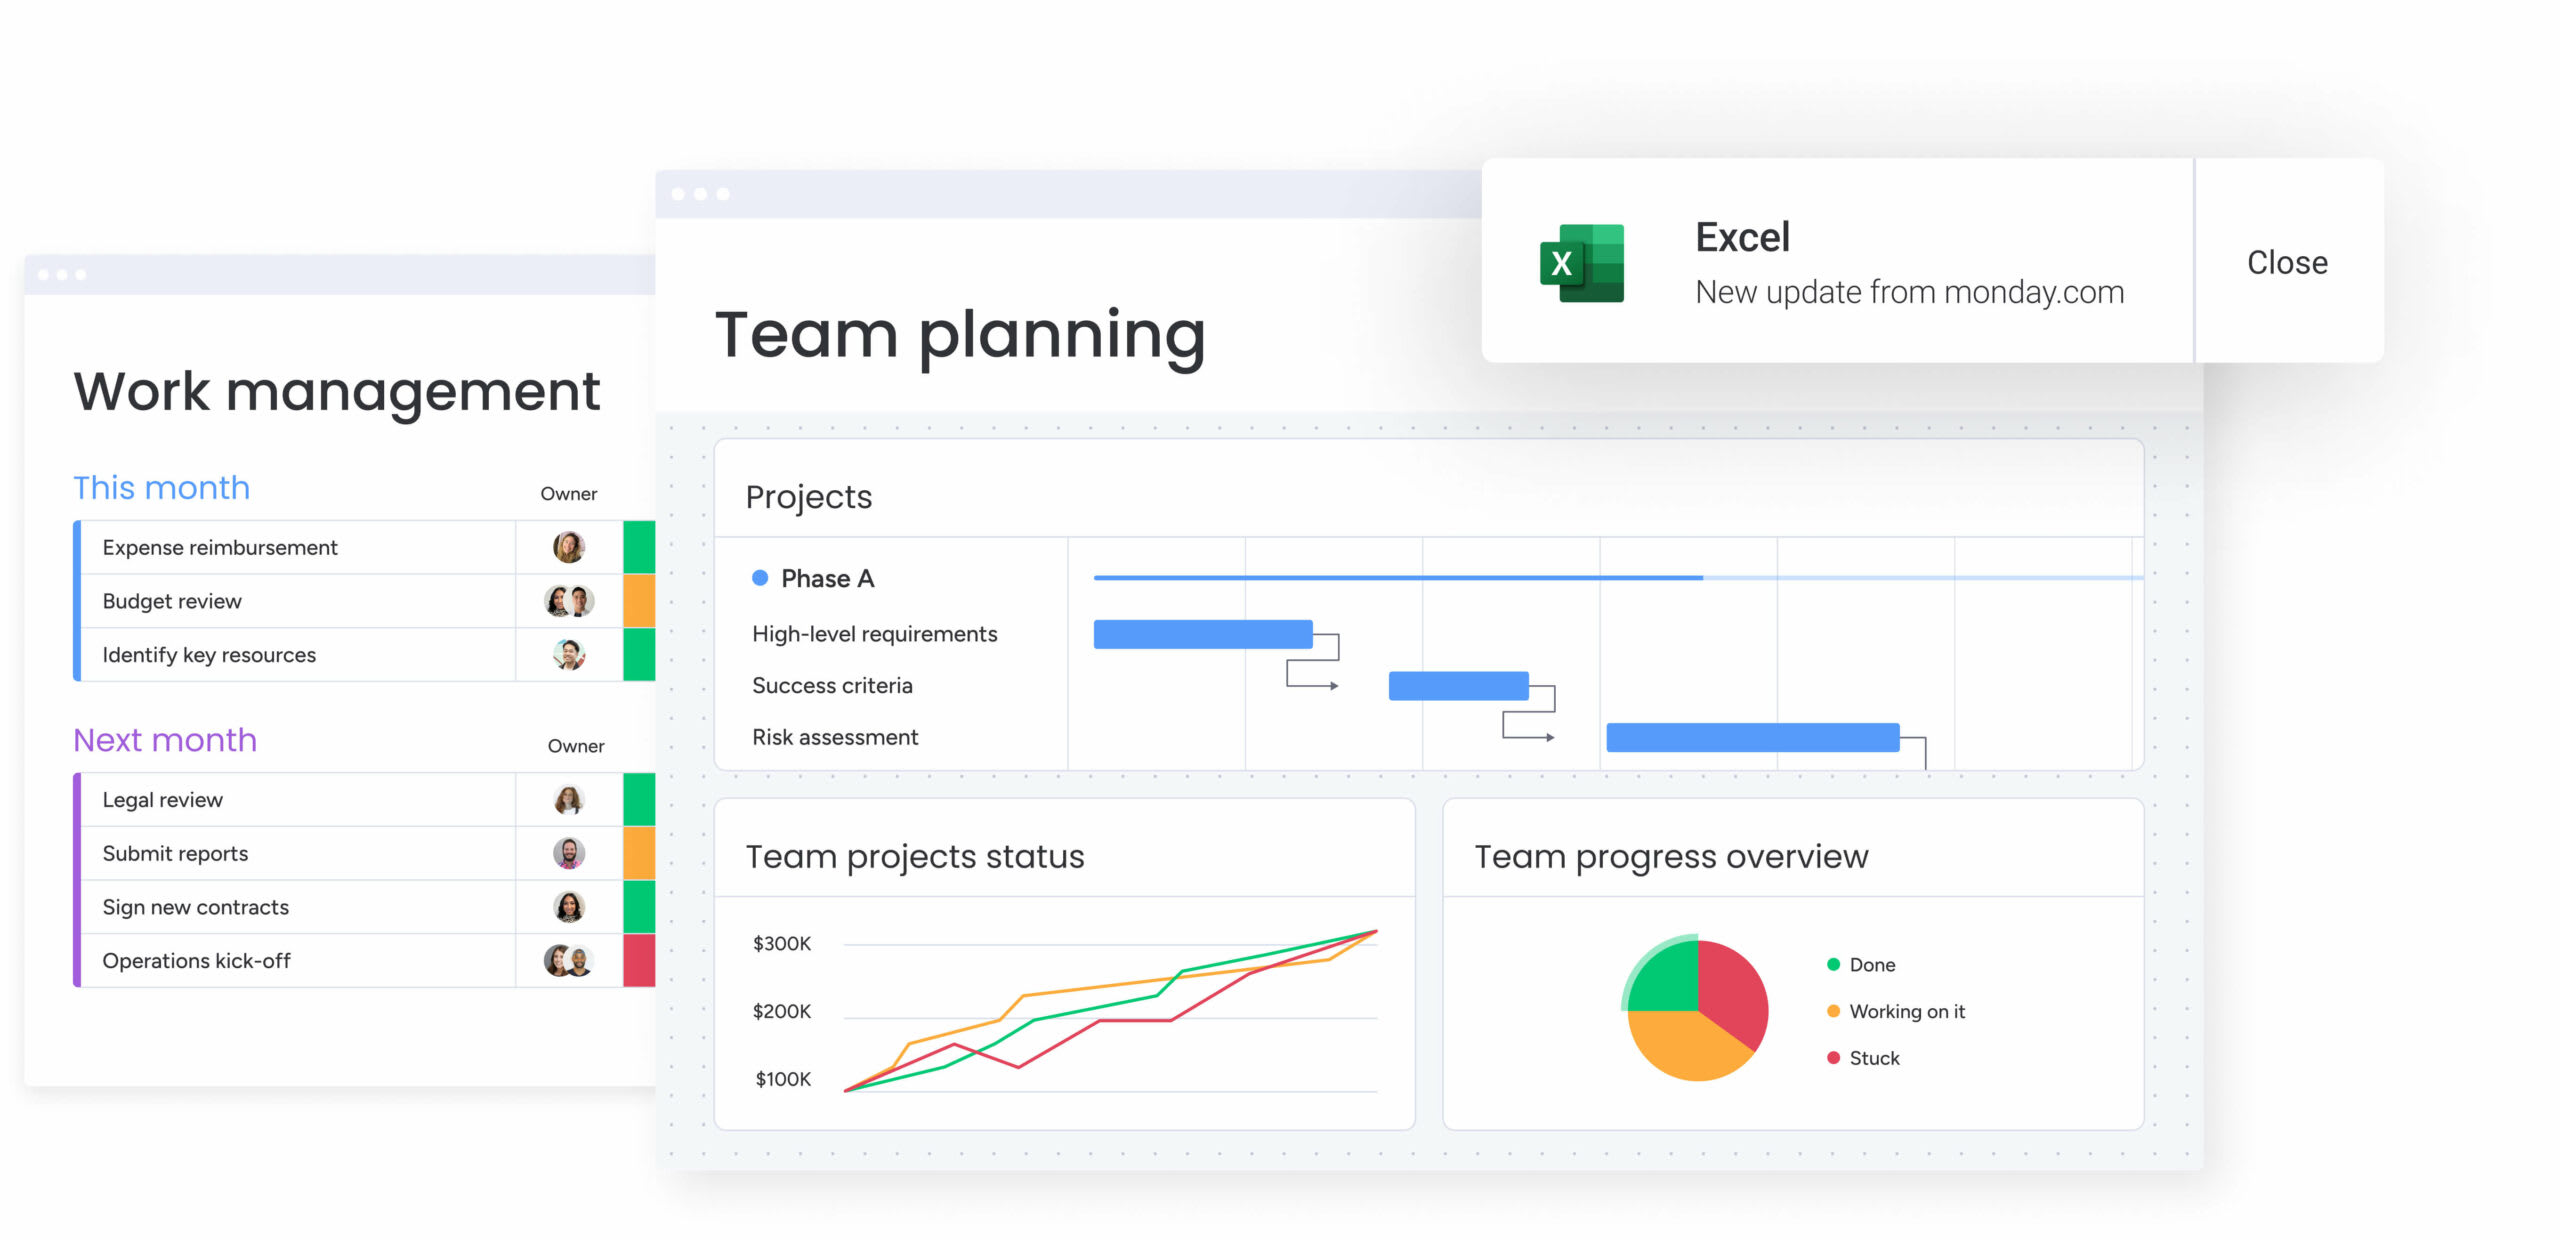
Choosing the right KPI platform means finding a tool that brings clarity and momentum to your team’s day-to-day. A structured decision framework keeps the process efficient and grounded in what matters for your organization. Here are 5 steps to guide your selection:
Step 1: Define your KPI goals first. Before evaluating any platform, get specific about what you need to track and why. Are you monitoring project delivery timelines, financial targets, customer satisfaction scores, or all of the above? The answer shapes everything — from the integrations you’ll need to the dashboard complexity required. A team tracking 5 department-level KPIs has different requirements than an enterprise aligning strategic OKRs across 20 business units.
Step 2: Assess team size and technical skill level. A platform built for data engineers won’t get adopted by a marketing team that needs answers in two clicks. Match the platform’s complexity to your team’s actual technical comfort level. What good is a powerful analytics engine if only one person on your team can use it?
Step 3: Evaluate integrations with your current stack. Your KPI software should work hand-in-hand with the systems you already rely on. Map your critical data sources — CRM, ERP, project management, financial systems — and confirm native connectors exist. Every manual data transfer is a point of failure and delay.
Step 4: Consider AI capabilities and future-proofing. AI-assisted business intelligence platform capabilities are rapidly becoming the dividing line between platforms that simply display data and platforms that help you act on it. Prioritize solutions with built-in anomaly detection, predictive forecasting, and natural language querying — these features deliver compounding value as your data grows.
Step 5: Test with a pilot team before full rollout. Don’t commit organization-wide before validating with a single team. Run a 2-4 week pilot with a representative group, measure adoption and satisfaction, and confirm that the platform delivers on its promises in your actual actionable KPI insights workflow before scaling.
When you choose an AI Work Platform like monday.com, you’re building a single source of truth that streamlines KPI tracking, unites your team, and transforms data into action at every level.
How to avoid common pitfalls in KPI reporting
KPI reporting can quickly go off track if you’re not careful about a few key challenges. The first is conflicting metrics: when teams use different definitions or sources for the same KPI, alignment breaks down and you end up with competing narratives. The solution? Establish a single source of truth with a unified dashboard, so everyone’s tracking the same numbers, with the same definitions, in real time. This creates one version of success that every team can rally around.
Another major obstacle is working with stale or incomplete data. Relying on manual updates or disconnected spreadsheets means you’re reacting to yesterday’s problems, not today’s opportunities. The fix is automation and AI: connect your data sources, set up live dashboards that update automatically, and let AI surface anomalies or risks you might otherwise miss.
Finally, context is everything. Numbers alone can’t tell you what’s truly happening. They need to be tied to real projects, owners, and next steps. Without that connection, even the most impressive metrics lose their meaning. The answer is to build KPI dashboards that don’t just show the “what,” but also the “why” and the “now what,” linking every dip or spike to the actual work and decisions behind it. That’s how you turn raw data into real results.
How monday.com's AI Work Platform transforms KPI tracking
What if your KPI dashboards didn’t just show you what already happened, but actively watched for problems, predicted outcomes, and built new tracking views from a single prompt?
monday.com’s AI Work Platform brings together real-time dashboards, autonomous AI agents, and a no-code AI app builder inside the same environment where teams plan, execute, and collaborate on work every day. That means KPI software stops being a separate reporting activity and becomes an embedded part of how your organization operates.
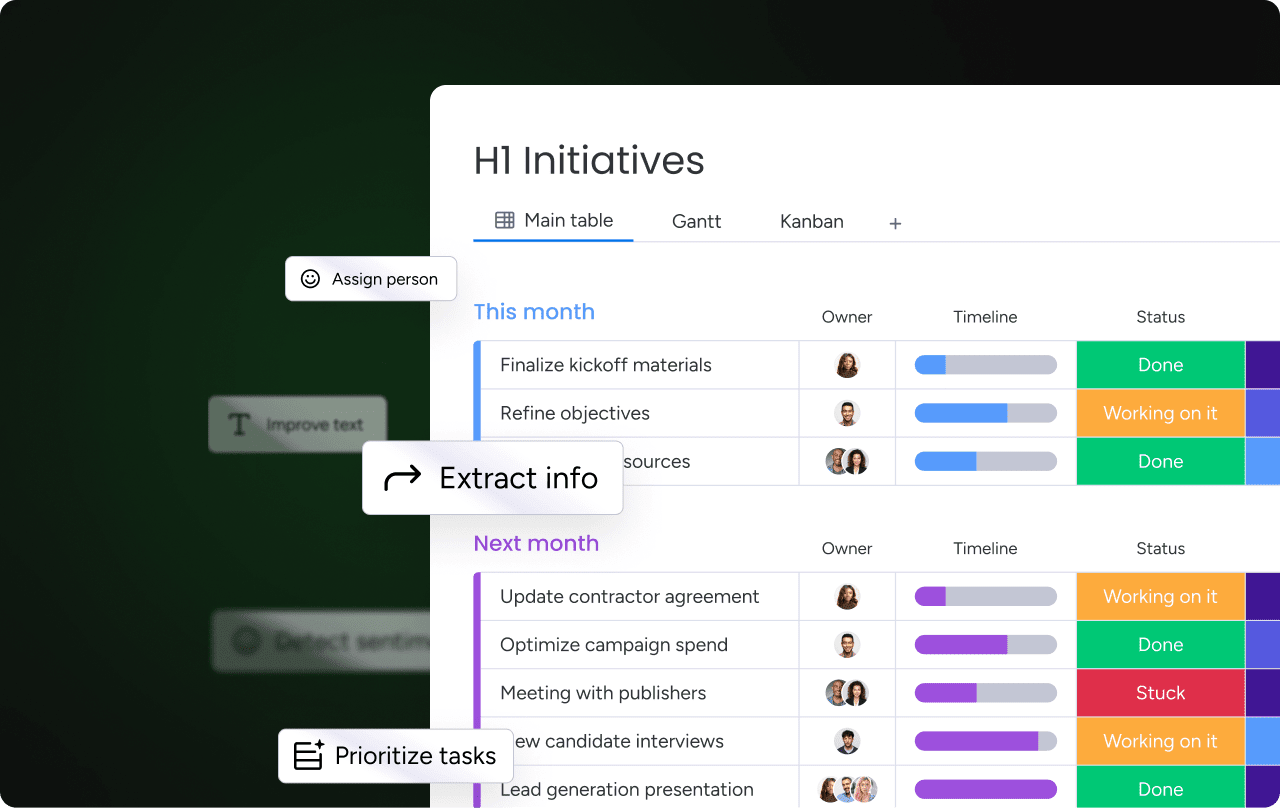
Most KPI platforms stop at dashboards and reports. monday.com’s AI Work Platform goes further by embedding AI directly into the workflows where teams track, analyze, and act on performance data. Here is how the platform’s AI capabilities elevate KPI tracking beyond what traditional dashboards and standalone BI platforms can offer:
Dashboards with intelligent foresight. Real-time KPI dashboards automatically sync as teams complete work, with AI-supported pattern detection that flags anomalies, predictive analytics that forecast where metrics are heading, and smart alerts that notify the right people when a KPI deviates from expected ranges. No-code customization means any team member can build a tailored view, and with 200+ integrations, every data source feeds into one unified picture.
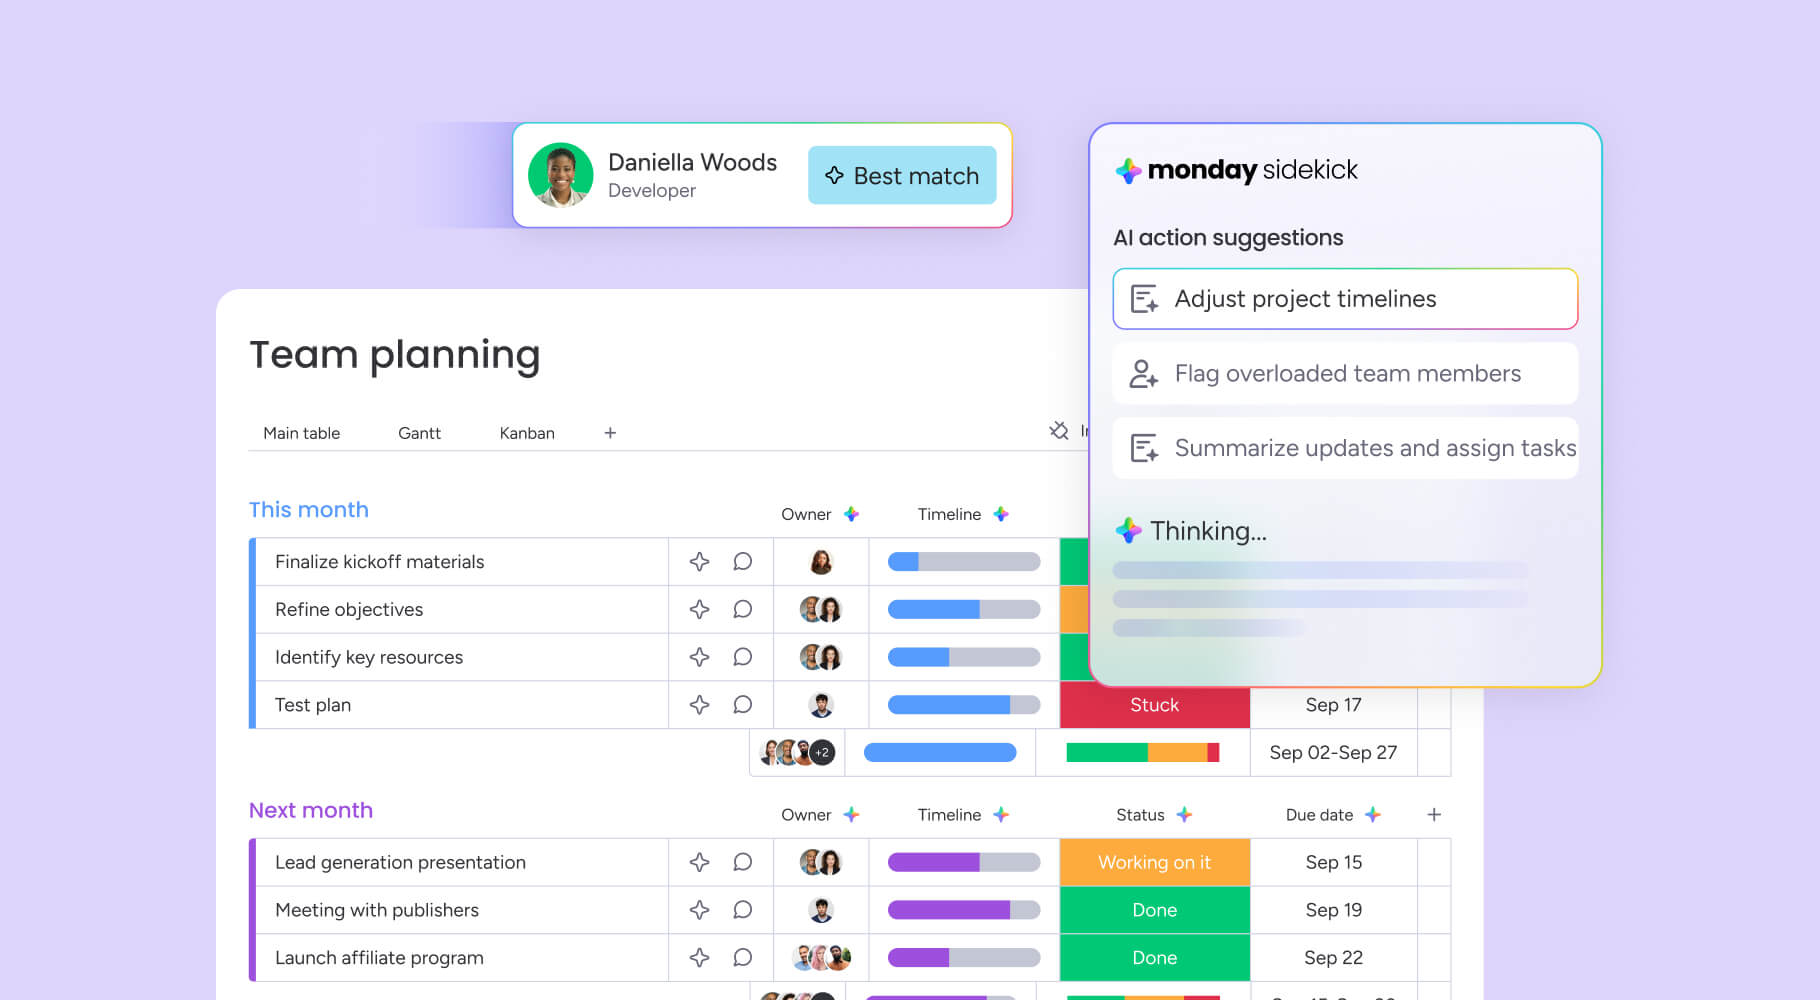
monday vibe: build custom KPI apps from a prompt. Need an executive overview dashboard, an OKR monitoring app, or a department-specific KPI tracker? Describe what you want in plain language, and monday vibe builds it. This AI app builder turns natural language prompts into fully functional, enterprise-grade applications that connect directly to your workspace data, without needing a developer or a different system.

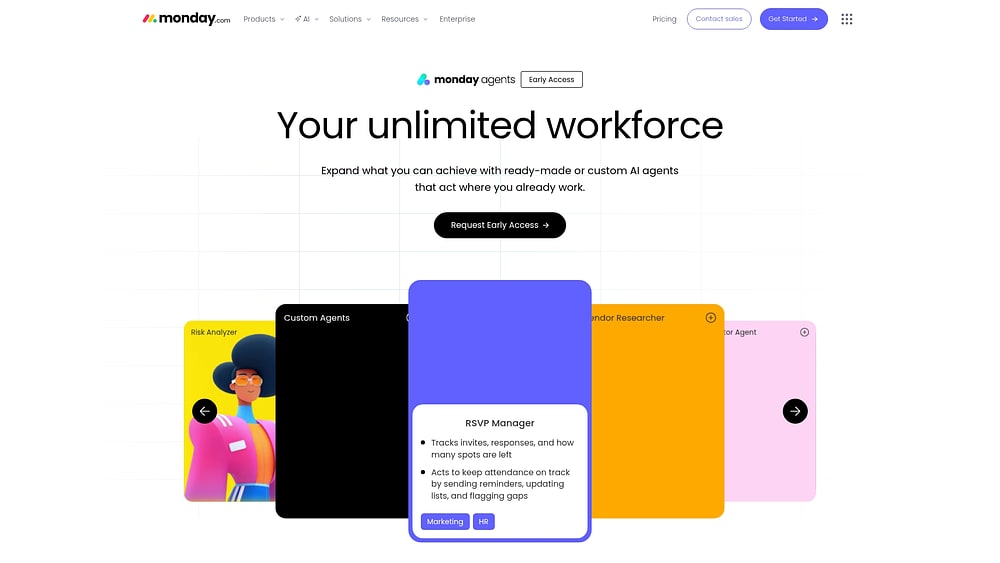
monday agents: autonomous KPI monitoring around the clock. Purpose-built AI agents work continuously without human prompting. Project Analyzer flags bottlenecks and adjusts schedules. Risk Analyzer detects workload and dependency risks before they impact deadlines. SLA Monitor tracks service-level compliance and escalates at-risk cases. And with Agent Factory, you can build custom agents tailored to your organization’s specific KPI tracking needs — all operating 24/7 with full visibility and guardrails.
monday MCP: connect your favorite AI assistants. The Model Context Protocol connects Claude, ChatGPT, Copilot, and Gemini directly to your monday.com data. That means your team can use whichever AI assistant they prefer to explore, analyze, and act on KPI data — without manual exports or copy-pasting between systems.

AI Blocks: automate KPI workflows without code. Pre-built AI functions slot into your existing workflows to automate smart reporting, trigger proactive risk management actions, and generate performance summaries, bringing accessible KPI insights to every team, not just those with technical expertise.
| Capability | monday.com's AI Work Platform | Standalone KPI software | Traditional BI platforms |
|---|---|---|---|
| Real-time dashboards | Yes — synced to live project data | Yes — from connected data sources | Yes — from data warehouses |
| KPI tracking tied to workflows | Yes — KPIs linked to tasks, projects, and owners | Limited — reporting only | No — separate from execution |
| AI-powered anomaly detection | Yes — built-in pattern detection and smart alerts | Some — varies by vendor | Yes — with configuration |
| Autonomous AI agents | Yes — 24/7 monitoring, risk analysis, SLA tracking | No | No |
| No-code AI app builder | Yes — monday vibe builds apps from prompts | No | No |
| Natural language querying | Yes — monday sidekick | Limited | Some — with add-ons |
| External AI assistant integration | Yes — MCP connects Claude, ChatGPT, Copilot, Gemini | No | Limited |
| Setup complexity | Low — no-code, drag-and-drop | Low to moderate | High — requires technical resources |
| Pricing entry point | Free plan available; paid from $9/seat/month | $79–$159/month | $14–$75/user/month |
Turn KPI data into decisions that drive results
The gap between tracking metrics and acting on them is where most organizations lose momentum. The strongest KPI software connects data to daily work. It leans on AI to provide the context every team member needs to make confident decisions, all without waiting for a monthly report. The shift from passive reporting to proactive guidance is what separates teams that react from teams that lead.
Whether you’re evaluating your first KPI platform or replacing one that’s become a bottleneck, the framework in this guide gives you a structured path to the right choice. And if you’re looking for a platform that brings dashboards, AI agents, and workflow execution together in one place, monday.com’s AI Work Platform is built to turn disjointed data into aligned action, from the first dashboard to the most complex enterprise deployment.
Get startedFAQs
Can I use KPI software free without losing essential features?
Yes, you can use KPI software for free without losing essential features. Several KPI platforms offer free plans with core tracking features for individuals or small teams. Advanced capabilities like intelligent insights, unlimited integrations, and enterprise security are typically part of paid subscriptions that scale with your organization's needs.
Which KPI management tool has the most AI capabilities?
When it comes to AI capabilities in KPI management, monday.com's AI Work Platform offers the broadest AI capability set for KPI tracking, including autonomous AI agents that monitor metrics 24/7, a context-aware AI assistant (monday sidekick) for natural language data exploration, and an AI app builder (monday vibe) that creates custom dashboards from a prompt. Traditional BI platforms offer deep AI analytics, but monday.com's AI Work Platform embeds AI directly into the workflows where teams execute work.
How do I synchronize data across multiple systems into my KPI dashboard?
To synchronize data across multiple systems into your KPI dashboard, look for platforms that use pre-built integrations and flexible APIs to automatically sync data from systems like Salesforce, Jira, Google Analytics, and financial software. This ensures your dashboard always reflects real-time information without manual data entry or CSV exports.
Can KPI software help remote and hybrid teams track performance?
Yes, KPI software can help remote and hybrid teams track performance effectively. Cloud-based KPI platforms are built for distributed teams, offering real-time access to shared dashboards from any device. Centralized data keeps everyone aligned on key metrics regardless of location, and useful alerts so no one misses a critical shift in performance.
How do I measure ROI on a KPI platform investment?
To measure ROI on a KPI platform investment, start by quantifying time saved on manual reporting, faster decision-making cycles, and improved goal attainment. Track metrics like reduced project delays, increased team efficiency, and fewer hours spent building reports to see a concrete return on your investment.
What is the difference between KPI software and business intelligence tools?
The difference between KPI software and business intelligence platforms comes down to scope. KPI software is designed for tracking specific, real-time metrics to manage team performance and execution — it emphasizes simplicity, actionability, and connection to daily work. Business intelligence platforms are built for broader, more complex data analysis, historical reporting, and deep statistical exploration, typically requiring dedicated analysts to operate effectively.
What makes monday.com's AI Work Platform different from other KPI software?
What makes monday.com's AI Work Platform different from other KPI software is it's the only platform on this list that combines real-time KPI dashboards, autonomous AI agents, a no-code AI app builder, and workflow execution in one environment. While standalone KPI platforms display metrics and BI platforms analyze data, monday.com's AI Work Platform connects KPI tracking directly to the projects, workflows, and team members responsible for driving those numbers, making it possible to go from insight to action without switching systems.
Can AI improve KPI tracking accuracy?
AI improves KPI tracking accuracy by automating data collection, detecting anomalies that human reviewers might miss, and reducing manual entry errors. monday.com's AI Work Platform uses pattern detection and predictive analytics to flag data quality issues and forecast trends, giving teams confidence that the metrics they're acting on reflect reality.

 Get started