
It’s hard to imagine a world without personalization.
From personalized recommendations on Amazon to personalizing the look and feel of business software, the ability to customize the look/feel and data displayed of any and all software products is nearly universal.
Believe it or not, there used to be a time when you purchased a piece of software, and it looked the same as everyone else who owned it. Each “off-the-shelf” copy had the same colors, the same fields, the same layout, and so on.
The same goes for the early days of the iPhone.
The first version of the iPhone included a handful of default apps — phone, calendar, camera, map, clock, web (Safari), and so on. The background was the same for everyone. There was no way to add or remove apps.
You got what you got.
Fast forward to today, and it’s hard to find a piece of technology that cannot be customized and personalized to fit each organization, each team, and each individual.Personal dashboards are the perfect example of what customization looks like in the workplace.
In this article, we’ll share how you can go about creating a personal dashboard, discuss why personalization matters, and show you how monday.com can help.
What is a dashboard?
Before we talk about personalized dashboards, let’s first define dashboards.
Dashboards give businesses the ability to monitor the health of their organization by measuring, tracking, and displaying key performance indicators (KPIs) and other essential metrics at a glance.
Dashboards are an integral part of what makes monday.com so powerful. You could say dashboards are part of our DNA.
In monday.com, users build dashboards that pull data across many boards so stakeholders can get a complete high-level view on anything they may want.
We allow external developers to easily “extend the monday.com platform” by developing their own dashboard widget within our no-code/low-code framework. The result? a platform that is virtually limitless and can solve nearly any complexity related to a business.
Here’s an example of what a personalized KPI dashboard could look like on monday.com: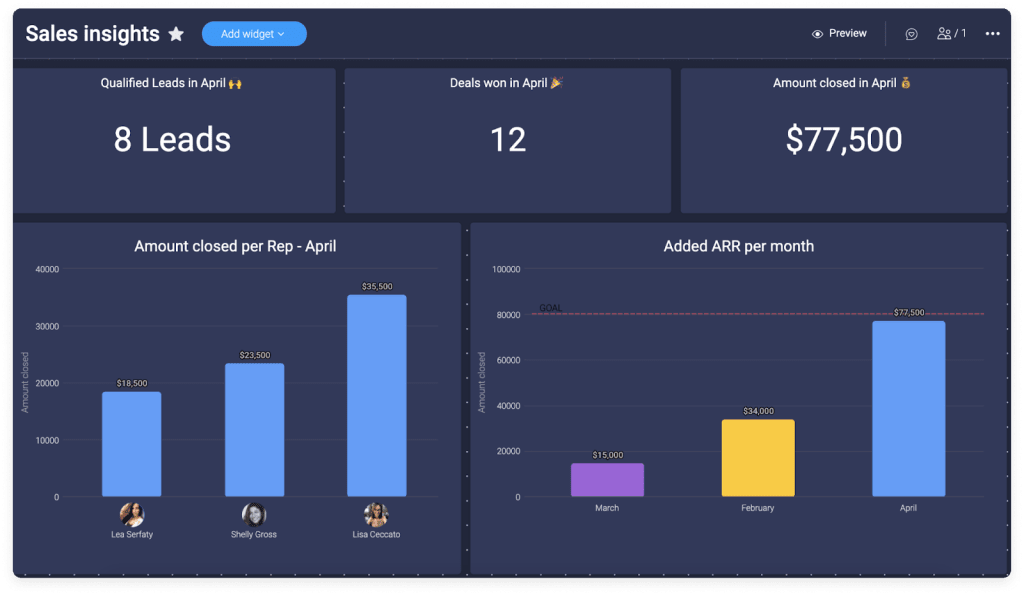
Dashboards are comprised of both back-end data (i.e., software that connects your files, boards, columns, and so on) and a front-end layer that displays this data in various formats — charts, graphs, numbers, and gauges.
It’s not all that different from a car dashboard’s data screen, one that displays the most essential information about a car’s health — information that is helpful to all car owners yet specific to your vehicle.
monday.com dashboards pull pretty much any data from your boards and display it on custom widgets for easy consumption.
How we think about personalization (and personalized dashboards) at monday.com
Personalized dashboards help businesses monitor all the essential data at their organization — from the high-level KPIs to the individual performance-level information.
These data help companies keep up with the competition, track team efforts, and boost sales and overall team performance.
Personalized dashboards provide “at-a-glance” insights necessary to see whether a project or initiative is likely to succeed—no more guesswork. Instead, you can truly understand what is happening — in real-time — with any team in your organization.
This openness and transparency are critical for a well-functioning company. Transparency is everything at monday.com, as co-founder Roy Mann outlined in this blog post.
Sidenote: We believe so firmly in business transparency (and data and personalization) that we built our own business intelligence tool called BigBrain that collects and processes data from over 200 million events per weekday from multiple separate sources and aggregates it into one place that every employee can access. BigBrain meticulously tracks and measures everything we do — every dollar we’ve spent, every dollar we’ve received, how our customers are engaging with our product, how quick our support response time is, and so on.
We’ve built “mini-versions of BigBrain” for all customers in our personalized dashboards.
How personalized dashboards help make business decisions with confidence
monday.com is a collaborative management software that gives a visual overview of where things stand at a glance.
And personalization is at the core of all dashboards.
After all, your executive dashboard should not — and will not — look the same as your peers or your competitors.
Custom dashboards help users:
- Track progress, timelines, and budgets at a glance
- Efficiently run reports from a high-level overview down to the very last detail
- Collaborate easily (and smartly) across teams
- Prioritize tasks, share files, and see who is doing what anytime
- Keep everyone synced and working towards the same goal
- Centralize all work processes
Oh, and one more thing: With our integrations, teams can ensure monday.com works with all your favorite tools by having all your team’s work in one place.
The many (many!) types of personal dashboards monday.com offer
When we designed personal dashboards, we considered the multitude of ways our customers would want to see their data displayed.
The possibilities are endless.
- The Text Widget
- The Gantt Widget
- The Dashboards
- The Workload Widget
- The Overview Widget
- The “My Week” Widget
- The Table Widget
- The Numbers Widget
- The Battery Widget
- The Timeline Widget
- The Calendar Widget
- The Chart Widget
- The Bookmarks Widget
- The Time Tracking Widget
- The Llama Farm Widget
- The Todo List Widget
- The “Embed Everything” Widget
- The Board Updates Widget
- The YouTube Widget
- The “I Was Mentioned” Widget
- The Quote of the Day Widget
- The Playlist Widget
- The Countdown Widget
… just to name a few.
As you can tell from the list above, personalized dashboards start with widgets.
Think of widgets as custom blocks of data that can be added, personalized, and moved around on just about any dashboard monday.com offers.
Learn more about all dashboard options.
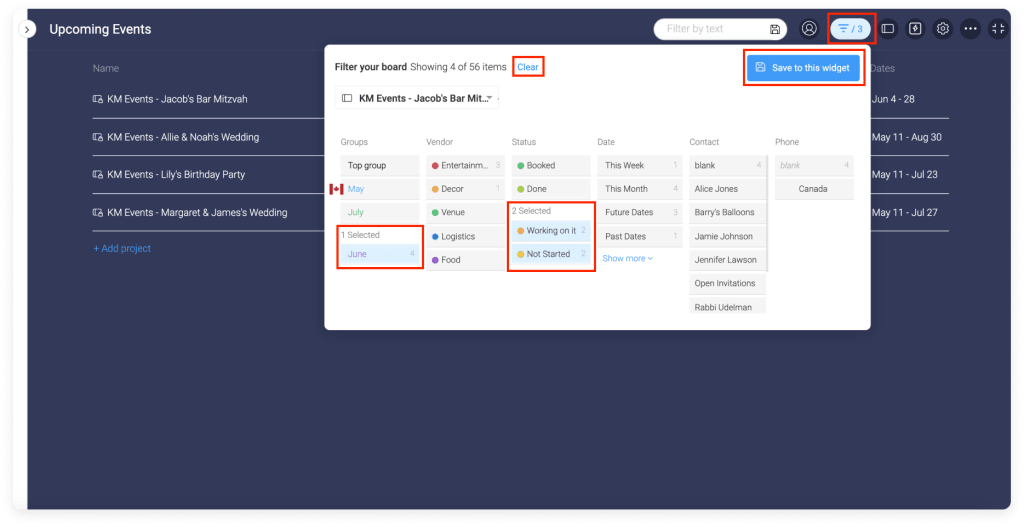
Not sure where to get started with dashboards? We recommend starting with The Overview Widget to gather and summarize the progress from your selected boards into one place on your dashboard — a great way to get a high-level picture of what’s happening for each project and overall!
Once installed, it’s time for some personalization!
This is where filter is your best friend. We have the handy tornado icon 🌪 that makes it simple to filter out information that you don’t want to see.
Another popular widget that fully customizes your board is The “I Was Mentioned” Widget.
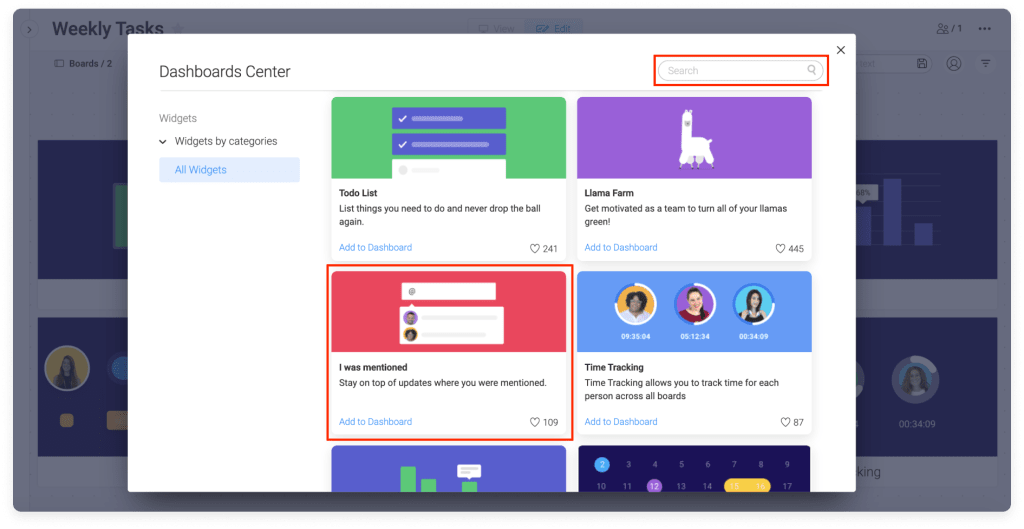
Never miss an update you were mentioned in again! Customize this widget to only see the types of mentions you want to see within a timeframe that works best for you. #PersonalizationAtItsBest
Don’t get left behind.
We live in a world of customization and personalization. In fact, a personalization algorithm likely brought you to this piece of content today.
What you searched, what you clicked, what you liked on social media — all of it played a part in you arriving here.
When it comes to making sound business decisions, seeing “at-a-glance” personalized data is essential.
monday.com’s personalized dashboards make this dream a reality.
See why 125,000+ companies choose monday.com.