


Every business tracks investments, but few measure which ones actually pay off. Finance teams juggle marketing spend, software subscriptions, hiring costs, and capital expenditures across dozens of spreadsheets. Without a reliable way to calculate returns, decisions default to gut instinct instead of data. That’s where the ROI formula in Excel becomes essential.
This guide walks through the ROI formula, how to set it up in Excel step by step, the different ROI variations you can apply to specific scenarios, and the limitations to consider before relying on a single metric. Whether you’re evaluating a $2,000 ad campaign or a $200,000 equipment purchase, you’ll have the formulas and structure to measure it accurately. For a broader look at ROI, see our comprehensive ROI guide.
For teams managing ROI across multiple projects or departments, platforms like monday AI Workspace can automate the tracking that spreadsheets require manual tracking.
Get started with monday.comKey takeaways
- The basic ROI formula is (Net Profit/Cost of Investment) x 100: it gives you a percentage that shows how much return you earned relative to what you spent
- You can build a functional ROI calculator in Excel in five steps: from labeling columns to adding conditional formatting that color-codes profitable and unprofitable investments
- Four ROI formula variations cover different scenarios: net income ROI, capital gain ROI, total return ROI, and annualized ROI; each answers a slightly different financial question
- ROI has real limitations: it doesn’t account for the time value of money, ignores risk, and provides a static snapshot that can become outdated fast
- A connected platform replaces manual Excel ROI tracking with formula columns that auto-calculate, dashboards that display live metrics, and automations that update figures whenever project data changes
What is return on investment (ROI)?
Return on investment is a performance metric that measures how much profit or loss an investment generates relative to its cost. It’s expressed as a percentage, making it straightforward to compare across different projects, campaigns, or assets.
ROI is a direct measure of return showing how much money you’ve made on a particular investment in relation to the cost of that investment.
ROI matters because it simplifies complex financial decisions into a single, comparable number. Whether you’re evaluating a marketing campaign’s return, a new piece of equipment, or a software subscription, ROI tells you if the dollars you put in generated more dollars coming out. Teams use it to prioritize investments, justify budgets, and communicate results to stakeholders who need fast answers, not lengthy financial reports.
The basic formula looks like this: ROI = (Net Profit / Cost of Investment) x 100. If you invested $10,000 and earned $12,500 back, your net profit is $2,500 and your ROI is 25%. Simple enough — but there’s a catch. Standard ROI doesn’t account for the time value of money, meaning a 25% return over 1 year looks identical to a 25% return over 5 years. We’ll cover that limitation — and how to handle it — later in this article.
The basic ROI formula and how it works
What is the simple equation for ROI? At its core, the ROI formula has two variables and one operation:
ROI = (Net Profit / Cost of Investment) x 100
Here’s what each part means. Net profit is the difference between what you earned and what you spent. Cost of investment is the total amount you originally put in. Multiplying by 100 converts the decimal into a percentage so you can compare it across investments without reaching for a calculator.
Let’s walk through a quick example. Suppose your team spends $10,000 on a paid advertising campaign. At the end of the quarter, that campaign generated $12,500 in revenue directly attributed to those ads. Here’s the math:
- Net Profit: $12,500 – $10,000 = $2,500
- ROI: ($2,500 / $10,000) x 100 = 25%
A positive ROI — anything above 0% — means the investment returned more than it cost. A negative ROI means you lost money. The higher the percentage, the more profitable the investment relative to its cost. Keep in mind that this basic formula gives you a total return figure regardless of how long the investment took to pay off. For time-adjusted comparisons, you’ll want the annualized ROI variation covered below.

4 common ROI formula variations in Excel
The basic ROI formula works for quick, one-off calculations. But different financial scenarios call for different approaches. Each of the four variations below answers a slightly different question, and each one translates neatly into an Excel formula with specific cell references. Which one is right for your situation? That depends on what you’re measuring and how precise you need to be.
Net income ROI
This is the most common version and the closest to the basic formula. Net income ROI divides your net income (revenue minus all expenses) by the cost of investment.
Formula: ROI = Net Income / Cost of Investment
In Excel, if your net income sits in cell B2 and your cost of investment is in B3, the formula is simply =B2/B3. Format the result as a percentage. For example, if a product launch generated $45,000 in net income on a $30,000 investment, your ROI is 150% — meaning you earned $1.50 for every $1 spent.
Capital gain ROI
Capital gain ROI measures the profit from selling an asset relative to what you originally paid for it. It’s most common in stock portfolios and real estate.
Formula: ROI = (Sale Price – Purchase Price) / Purchase Price
In Excel: =(B2-B3)/B3 where B2 is the sale price and B3 is the purchase price. If you purchased a property for $200,000 and sold it for $260,000, your capital gain ROI is 30%.
Total return ROI
Total return is similar to capital gain but includes additional income generated by the investment — dividends, interest payments, or rental income on top of the price change.
Formula: ROI = (Ending Value – Starting Value) / Cost of Investment
In Excel: =(B2-B3)/B4 where B2 is your ending value (including all income received), B3 is your starting value, and B4 is your original cost. Total return gives a fuller picture because it captures every dollar the investment produced, not just the sale price.
Annualized ROI
Here’s where things get more interesting. Standard ROI ignores time, which makes it unreliable for comparing investments held over different periods. A 60% return over 2 years sounds impressive — but is it more impressive than a 40% return over 1 year? Annualized ROI answers that question by normalizing returns to a per-year basis.
Formula: Annualized ROI = (Ending Value / Starting Value) ^ (1 / Number of Years) – 1
In Excel: =(B2/B3)^(1/B4)-1 where B2 is your ending value, B3 is your starting value, and B4 is the number of years. Alternatively, you can use Excel’s built-in RATE function for more complex scenarios involving periodic payments.
For the example above: a $10,000 investment that grows to $16,000 over 2 years has a total ROI of 60%, but an annualized ROI of about 26.5%. Compare that to a $10,000 investment returning $14,000 in 1 year — a 40% annualized ROI that significantly outperforms the two-year option on a per-year basis.

How to build an ROI calculator in Excel (five steps)
Building a reusable ROI calculator in Excel takes about 10 minutes and saves hours of ad-hoc calculations down the road. Follow these 5 steps to create a spreadsheet you can use for any investment: marketing campaigns, capital expenditures, software purchases, or project evaluations. You can also download our free Excel template to get a head start.
Step 1: set up your spreadsheet columns
Open a new Excel workbook and create 4 column headers in row 1: Investment Name (column A), Cost of Investment (column B), Net Return (column C), and ROI (column D). Select the entire range and format it as an Excel Table (Ctrl+T) — this makes it easier to add new rows later without breaking your formulas.
Step 2: enter your investment data
Starting in row 2, enter each investment on its own row. Type the name in column A, the total cost in column B, and the net return (total revenue or ending value) in column C. Use consistent currency formatting across both financial columns: select columns B and C, right-click, choose “Format Cells,” and select Currency with 2 decimal places.
Step 3: write the ROI formula
Click into cell D2 and type the formula: =(C2-B2)/B2. This subtracts your cost from your return, then divides by the cost to give you ROI as a decimal. Select Enter. If you formatted your data as a Table in Step 1, Excel will automatically fill the formula down for every row you add.
Step 4: format the result as a percentage
Select column D, right-click, and choose “Format Cells.” Under the Number tab, select Percentage and set decimal places to 1 or 2, whatever precision your stakeholders prefer. Your ROI values will now display as readable percentages instead of raw decimals.
Step 5: add conditional formatting for quick analysis
Highlight the ROI column, go to Home > Conditional Formatting, and create two rules. First: format cells greater than 0 with a green fill and dark green text. Second: format cells less than 0 with a red fill and dark red text. Now every positive ROI glows green, and every loss stands out in red, making it easy to scan dozens of investments at a glance. You can also add Data Bars or Icon Sets for a more visual comparison across rows.
Get started with monday.comWhat ROI does and doesn’t measure
ROI is powerful precisely because it’s simple. But that simplicity comes with trade-offs. Understanding where the formula needs support helps you make more accurate decisions — and know when to bring in additional metrics. Does ROI account for the time value of money? No, and that’s just one of several gaps worth knowing about.
Here are the key limitations to consider before relying on ROI as your only measure:
- Does not account for the time value of money: A 50% return over 1 year is far more valuable than a 50% return over 10 years. The basic ROI formula treats both identically. For time-adjusted analysis, use annualized ROI or net present value (NPV).
- Ignores risk: Two investments can show identical ROI numbers while carrying vastly different risk profiles. A government bond and a startup investment might both return 15%, but the probability of achieving that return differs dramatically.
- Can be manipulated by cost allocation: Different teams may define “cost of investment” differently. Include only direct costs, and your ROI looks stellar. Include overhead, labor, and opportunity costs, and the picture changes.
- No standardized definition across organizations: Marketing teams, finance teams, and operations teams often calculate ROI using slightly different inputs — which makes cross-departmental comparisons unreliable without agreed-upon definitions.
- Provides a static snapshot: A single ROI calculation captures one moment in time. It won’t tell you if returns are trending up or down, or if a project that looked profitable last quarter is now underperforming.
What if your ROI calculations could update automatically as new data comes in? That’s exactly the shift from static spreadsheets to live, connected platforms — and we’ll cover how that works shortly.
What is a good ROI percentage?
“Good” ROI isn’t a fixed number — it depends entirely on context. The industry you’re in, the risk you’re taking, the time horizon of the investment, and the opportunity cost of putting that money elsewhere all shape what counts as a worthwhile return. A 10% annual return might be outstanding for a low-risk bond portfolio but underwhelming for a high-growth marketing campaign.
Here are some general benchmarks to use as reference points:
- Stock market: ~7-10% annually after inflation is the long-term historical average for diversified portfolios.
- Real estate: 8-12% annual return is generally considered strong, though it varies by market and property type.
- Marketing campaigns: A 5:1 return ratio (500% ROI) is a common benchmark, meaning $5 earned for every $1 spent.
- Business projects: Any positive ROI may be worthwhile if it exceeds the company’s cost of capital — the minimum return needed to justify the investment.
How do you calculate a 10% ROI? Rearrange the formula: if you need a 10% return on a $50,000 investment, you need $5,000 in net profit. The required return equals (Target ROI% / 100) x Cost of Investment. This works for setting performance targets — you can calculate exactly how much revenue a campaign or project needs to generate to hit your threshold.
When comparing ROI across investments with different holding periods, always annualize the returns first. A 30% total return over 3 years is roughly 9.1% annualized — which you can then compare directly against a 12% annual return on a 1-year investment.
Make your Excel ROI calculator dynamic
A basic ROI spreadsheet gets the job done for one-off calculations, but it becomes more powerful when you add interactive features. These enhancements turn a static table into a flexible analysis dashboard — all within Excel.
Here are 4 features that add real analytical depth:
- IF formulas for instant labels: Add a column with =IF(D2>=0.1,”Meets Target”,”Below Target”) to instantly flag which investments hit your ROI threshold. Change the 0.1 to whatever target percentage your team has set.
- Dropdown menus for categorization: Use Data Validation to create a dropdown in a “Category” column (marketing, operations, capital expenditure). This lets you filter and compare ROI by investment type without building separate spreadsheets.
- SUM and AVERAGE for portfolio-level metrics: Add summary rows using =AVERAGE(D2:D20) for your portfolio’s average ROI and =SUM(C2:C20)-SUM(B2:B20) for total net profit across all investments.
- Charts for visual comparison: Select your Investment Name and ROI columns, insert a bar chart, and you’ve got a visual ranking of your strongest and weakest investments. Add a reference line at your target ROI to see which investments clear the bar.
These Excel enhancements help — but they still require manual updates every time your data changes. Every new expense entry, revenue adjustment, or project milestone means opening the spreadsheet, updating cells, and re-checking formulas. For teams tracking ROI across more than a handful of projects, that manual loop becomes the bottleneck.
How monday AI Workspace replaces manual ROI tracking
Excel works for one-time ROI calculations. Tracking return on investment across multiple projects, departments, or quarters reveals the limits of a static spreadsheet. Version control issues, broken formulas, and the constant need to re-enter data are the real costs of manual tracking. Anyone doing project cost tracking manually knows these friction points don’t show up in any ROI formula.
monday AI Workspace eliminates those friction points by connecting your financial data to live, auto-updating calculations. Here’s how the platform replaces each piece of the Excel workflow:
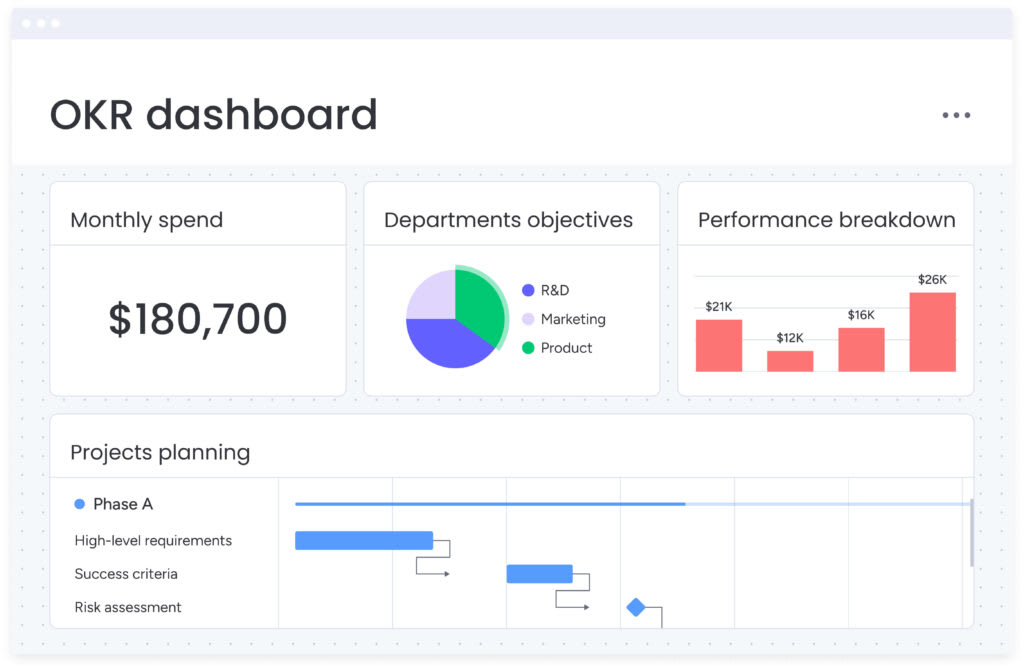
- Formula columns and dashboards: Replace manual Excel formulas with formula columns that auto-calculate ROI, net profit, and return ratios across every row. Portfolio-level dashboards display live metrics for stakeholders — no one needs to request an updated spreadsheet
- Automations: When project costs or revenue figures change, ROI recalculates instantly. Set up automations to notify your team when an investment drops below a target threshold or when a project hits a milestone that impacts its return
- monday vibe: Need a custom ROI calculator app? Describe what you want in plain language and monday vibe builds it for you — no coding, no complex spreadsheet macros. You get a tailored financial tracking interface in minutes
- monday agents: AI agents generate financial reports on schedule, surface at-risk investments so teams can act early, and track metrics progress against goals automatically. Instead of pulling numbers into a quarterly deck, the data is already waiting for you
- Excel import and integrations: Already have years of ROI data in spreadsheets? Import existing Excel files directly into the platform. Integrations with Salesforce, HubSpot, and other revenue sources mean your data flows in automatically
The results speak for themselves. Customers report an average 8x ROI from using the platform, with $250,000 saved annually to reinvest elsewhere. An independent Forrester Total Economic Impact study found a payback period of less than 4 months. Whether you’re tracking campaign performance with an expense tracking template or monitoring departmental budgets with a budget tracker template, the platform keeps every number current without the manual overhead.
Track every dollar and measure what matters
ROI is one of the most essential metrics in business — and now you have the formulas, variations, and step-by-step instructions to calculate it confidently in Excel. From basic net profit calculations to annualized returns and dynamic spreadsheet features, you’re equipped to evaluate any investment and present the numbers that drive decisions.
That said, Excel has a ceiling. When your team is tracking ROI across dozens of projects, campaigns, and departments, a connected platform keeps everything accurate and accessible in real time. monday AI Workspace brings your ROI formula, financial data, and stakeholder reporting into one workspace — with live dashboards, automated recalculations, and AI-powered insights that replace the manual spreadsheet cycle entirely.
Get started with monday.comFAQs
What is the formula for calculating ROI?
The formula for calculating ROI is (Net Profit / Cost of Investment) x 100. This gives you a percentage that shows how much return you earned relative to what you spent.
What is a good ROI percentage?
A good ROI percentage depends on the investment type and industry. For stock market investments, 7-10% annually is a common benchmark, while marketing campaigns often target a 5:1 return ratio (500% ROI).
How do you calculate a 10% ROI?
To calculate a 10% ROI, you need a net profit that equals 10% of your total investment cost. For a $50,000 investment, that means earning $5,000 in net profit — so your total return would need to reach $55,000.
What is the difference between ROI and annualized ROI?
Standard ROI measures total return regardless of time period, while annualized ROI adjusts the return to reflect a per-year rate. Annualized ROI is more useful when comparing investments held for different durations because it normalizes the time factor.
Does ROI account for the time value of money?
No, the basic ROI formula does not account for the time value of money. It treats every dollar the same regardless of when it was earned. For time-adjusted returns, use annualized ROI or net present value (NPV) instead.
What Excel functions are used for ROI calculations?
The most common Excel functions for ROI calculations are basic arithmetic division (=B2/B3), SUM for totaling costs and returns, and the RATE function for annualized return calculations. You can also use IF functions to flag investments that meet a target ROI threshold.
Can monday AI Workspace replace Excel for ROI tracking?
Yes, the platform replaces manual Excel ROI tracking with formula columns that auto-calculate, dashboards that display live metrics, and automations that update figures whenever project data changes. Teams report an average 8x ROI from using monday AI Workspace.
 Get started