
Every organization needs a business plan — a roadmap that allows your leadership team to set bold goals and a path to reach them. But creating this plan isn’t always straightforward, especially in a cross-functional environment. Without a shared visual of timelines and dependencies, plans slip, resources conflict, and accountability blurs.
That’s where a Gantt chart for your business plan turns a strategy into a manageable, long-range timeline. Unlike task-focused project charts, it maps initiatives across months or years and clarifies the dependencies that enable proactive decisions.
This guide covers the essential components your Gantt chart business plan needs, so your stakeholders have confidence in your roadmap. We’ll outline a 7-step build, and explore how monday.com connects high-level planning to daily execution so strategy becomes measurable outcomes.
Try monday.comKey takeaways
- Bridge strategy and execution with visual timelines: Turn complex multi-year business plans into actionable Gantt charts that show how strategic initiatives connect across departments.
- Focus on phases, not daily tasks: Business plan Gantt charts track quarterly milestones and major initiatives over 12-24 months. Project charts? They manage weekly deliverables.
- Spot resource conflicts before they derail plans: Visual timelines immediately reveal when multiple strategic initiatives compete for the same budget, people, or assets at the same time.
- Connect high-level planning to daily work with monday.com: The platform links strategic milestones directly to team boards. Automated progress tracking and portfolio dashboards make sure every project contributes to business objectives.
- Build flexibility into long-term planning: Use detailed quarterly plans for near-term work. Keep distant phases at a higher level so your strategy can adapt when markets shift.
What are Gantt charts for business plans?
A business plan Gantt chart is a single, long-range timeline that maps your organization’s strategic objectives over months or years. While project Gantt charts manage daily tasks and assignees, business-plan charts highlight high-level initiatives, phases, and major operational shifts. They clarify how efforts like a marketing campaign align with product development, sales enablement, and a Q3 market expansion—built for executive visibility rather than team-level task tracking.
On the chart, horizontal bars represent phases across a fiscal or multi-year horizon (for example, Q1 Market Research or Q3 European Expansion). Visible dependencies and overlaps make sequence and parallel work clear—R&D can run alongside early marketing, followed by a defined sales enablement period. This at-a-glance view helps leaders see the critical path, resource concentrations, and gaps so they can allocate wisely and make timely decisions.
Key components of business planning Gantt charts
Effective business plan charts need specific elements that set them apart from standard schedules. These components turn the chart into a decision-making tool, not just a timeline:
- Strategic milestones: Significant achievement markers like “Series B Funding Secured” or “10,000th User Acquired” that indicate progress toward overarching business goals
- Department dependencies: Visual links showing how teams rely on one another, such as engineering needing to complete the MVP before marketing can launch the beta program
- Resource allocation windows: Designated periods indicating when specific budgets, key personnel, or physical assets are committed to an initiative
- Risk buffers: Intentional time gaps built into the schedule to account for market volatility or regulatory delays
- Decision gates: Formal review points where leadership evaluates data to approve the next phase
When to choose Gantt charts over other methods
The right visualization method depends on how complex your initiative is and who needs to see it. Different planning scenarios need different approaches:
| Planning scenario | Gantt chart | Kanban board | Simple calendar |
|---|---|---|---|
| Multi-department initiatives | Ideal for visualizing complex handoffs and parallel workstreams | Hard to see timeline dependencies | Lacks dependency logic |
| Investor presentations | Demonstrates credible path to milestones | Focuses on status, not journey | Shows dates but misses scope |
| Regulatory compliance | Maps strict deadlines with preparation phases | Good for document status only | Shows deadlines without work-back plan |
| Routine operations | Too complex for repetitive work | Ideal for continuous flow | Doesn't track workflow stages |
How Gantt charts transform business planning
Strategic planning often fails because of fragmented visibility and misalignment. Gantt charts solve the structural challenges of running a complex organization. They make the invisible connections between teams and timelines visible.
Understanding how visual timelines improve strategic coordination helps leaders shift from reactive management to proactive execution. These benefits compound across departments and create organizational alignment that delivers measurable results.
See your entire strategy at a glance
Spreadsheets and slide decks hide the critical conflicts that derail strategy. A Gantt chart provides a portfolio view with multiple strategic initiatives on a single timeline.
This visualization immediately reveals resource constraints and critical path issues buried in separate department files. For example, executives can instantly spot if 2 major product launches are scheduled simultaneously, competing for the same limited marketing budget and sales attention.
This birds-eye perspective allows leadership to stagger initiatives, smoothing out resource demand and ensuring each project gets the focus it requires to succeed.
Align cross-functional teams and resources
Mid-to-large organizations frequently struggle with silos where departments work in isolation. Gantt charts break down these barriers by visualizing the dependencies between functions.
A digital transformation initiative requires precise coordination between IT infrastructure updates, HR training schedules, and operations process changes. When these dependencies are mapped on a shared timeline, teams understand how their delays impact others.
Marketing knows they cannot start the campaign until product hits the “Feature Complete” milestone. This cross-functional visibility helps detect bottlenecks before they cascade through the organization.
Communicate progress to stakeholders
Boards, investors, and senior leadership require confidence that the business is on track. Visual timelines communicate progress more effectively than dense status reports or verbal updates.
A Gantt chart translates complex, multi-layered business initiatives into an intuitive narrative that non-technical stakeholders can grasp immediately. Displaying the planned baseline against actual progress bars gives leaders transparency into the organization’s velocity.
This builds trust with stakeholders, demonstrating control over execution and allowing for honest conversations about adjustments needed to meet year-end targets.
Identify risks before they impact execution
Timeline visualization acts as an early warning system for potential bottlenecks. Risks that are invisible in a list format become obvious on a Gantt chart.
Seeing the critical path helps managers identify vulnerabilities where a single delay could cascade through the entire year’s plan. How confident are you that your current planning approach identifies risks before they become crises?
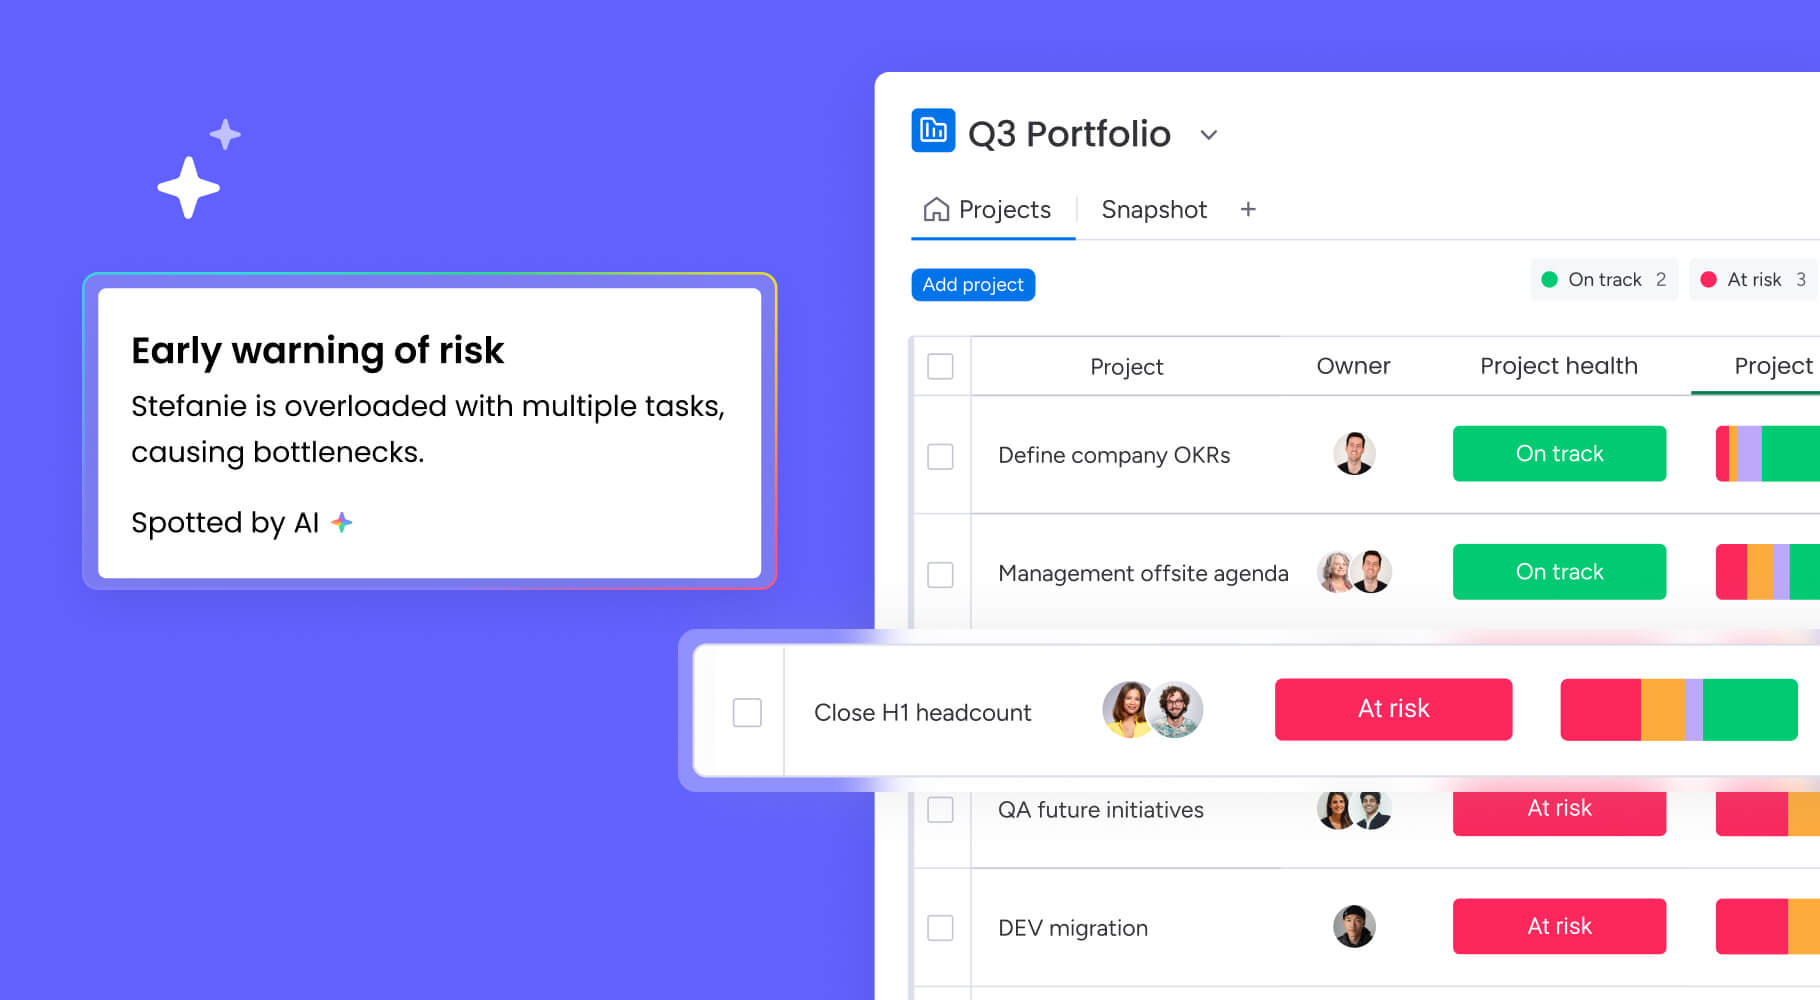
Advanced platforms address this challenge with automated risk detection that scans project boards and flags potential issues by severity, helping teams address problems proactively.
Business plan vs. project Gantt charts: critical differences
While the visual format looks similar, the application of Gantt charts in business planning differs fundamentally from their use in project management. Understanding these distinctions determines how you should structure and use each type.
The table below highlights the key differences that shape how you approach strategic versus tactical planning:
| Feature | Business plan Gantt chart | Project management Gantt chart |
|---|---|---|
| Time horizon | 6–24 months or more (strategic) | Weeks to months (tactical) |
| Granularity | Tracks phases, quarters, major milestones | Tracks individual items, hours, daily deadlines |
| Scope | Multiple initiatives and market factors | Single specific deliverable or product |
| Audience | Boards, C-suite, investors | Project managers, team leads, contributors |
| Flexibility | Evolves with market shifts and strategy pivots | Often tied to strict scope and delivery contracts |
Strategic horizons vs. item-level detail
Business plan charts operate on a macro scale. They map out phases that may last months, such as “Market Entry Preparation,” rather than breaking down the daily sub-items required to achieve them.
The granularity is typically weekly or monthly. Project charts dive into the minutiae of daily execution. Confusing the two leads to micromanagement at the executive level or lack of strategic direction at the operational level.
Portfolio views vs. single project focus
A business plan chart is a composite view of the organization’s health. It shows how the “New Product Line” initiative interacts with the “Customer Support Expansion” initiative.
Project charts typically isolate a single project to manage its specific critical path. The business plan view is essential for resource balancing across the entire company, ensuring the aggregate demand of all projects doesn’t exceed organizational capacity.
Executive reporting vs. team tracking
The primary consumer of a business plan chart is a decision-maker looking for assurance and direction. The design prioritizes major milestones and status indicators.
Project charts serve the team doing the work, requiring detailed dependency lines and assignee names to manage daily workflow. Business plan charts summarize this detail to tell a broader story of progress and value delivery.

5 must-have elements in your business plan Gantt chart
To function as a strategic roadmap, a business plan Gantt chart requires specific components that elevate it above a standard schedule. These elements keep the chart communicating value, risk, and direction effectively to executive audiences.
Each component serves a distinct purpose in transforming your timeline from a simple schedule into a strategic decision-making instrument:
- Strategic milestones and decision gates: These markers anchor the timeline to business value. A strategic milestone might be “MVP Launch” or “Regulatory Approval,” signaling a shift in the business’s maturity. Decision gates are distinct points where leadership reviews data to authorize the next phase.
- Department dependencies and handoffs: The chart must visualize the critical points where ownership transfers between functions. For a product launch, this includes the handoff from R&D to manufacturing, and subsequently to marketing.
- Risk buffers and contingency windows: Strategic timelines include visible buffers placed before critical deadlines. These buffers account for technical risks, market delays, or hiring lags. Sizing these buffers based on risk level protects the overall timeline from cascading failures.
- Success metrics and KPI tracking: Effective charts integrate key performance indicators directly into the view. This distinguishes between output metrics (“Campaign Launched”) and outcome metrics (“1,000 Leads Generated”).
- Resource allocation across initiatives: Visualizing when key assets are committed prevents double-booking high-value resources across competing strategic initiatives. monday.com supports this through its Workload View, which helps teams balance resources and quickly adapt to changing priorities.

7 steps to build your business plan Gantt chart
Constructing a strategic Gantt chart moves from high-level goals to an executable roadmap. Following these steps keeps the plan grounded in reality and aligned with organizational capacity.
This systematic approach prevents common planning failures while creating a timeline that serves both strategic oversight and operational execution.
Step 1: Map strategic objectives to timelines
Start with the end in mind. Strategic goals like “Expand into European Markets” are translated into time-bound phases.
Working backward from the desired completion date establishes realistic start times. Break down annual objectives into quarterly or semi-annual phases, so the timeline reflects your organization’s actual capacity to deliver.
Step 2: Break initiatives into executable phases
Strategic initiatives are decomposed into manageable phases that specific departments can own. A digital transformation initiative divides into “Assessment,” “Pilot Implementation,” “Full Rollout,” and “Optimization.”
Each phase receives deliverables and success criteria. This breakdown provides enough detail for department heads to plan their resources without cluttering the executive view.
Step 3: Identify cross-functional dependencies
Mapping relationships between phases reveals the logic of the plan. Ask: “What must happen before this phase can start?” and “What other initiatives does this phase enable?”
Identifying these dependencies is critical for spotting potential blockers. Common misses, such as legal needing to review contracts before sales can engage partners, are captured here.
Step 4: Allocate resources and assign ownership
Every phase requires specific people, budgets, and assets. Assign ownership and allocate the necessary budget. Identify resource conflicts and make trade-off decisions.
Teams using monday.com can plan, schedule, and allocate resources based on skill and availability, so no single team becomes overwhelmed by simultaneous demands.
Step 5: Build in flexibility with rolling horizons
Plan the next quarter in detail while leaving the following quarters at a higher level. This “rolling horizon” approach allows the plan to adapt as new information emerges.
Step 6: Connect financial and operational planning
The timeline must align with the financial reality of the business. Integrate budget cycles, cash flow requirements, and funding rounds into the schedule. Operational milestones, such as major inventory purchases, are timed to coincide with cash availability.
Step 7: Establish review and adaptation cycles
Build governance structure for the plan. Add regular review points to the timeline. These reviews determine when the plan is updated based on actual performance and market changes.
This creates a rhythm of accountability and ensures the Gantt chart remains a relevant decision-making instrument throughout the year.

Business plan Gantt chart examples that work
Different business scenarios require different timeline structures. The following examples illustrate how to adapt the Gantt chart format to specific strategic needs.
Startup launch timeline example
A startup timeline typically spans 12-18 months, focusing on the journey from concept to market entry. Key phases include “Market Validation,” “MVP Development,” “Beta Testing,” and “Series A Fundraising.”
Milestones mark achievements like “Product-Market Fit Confirmed” or “First 1,000 Customers.” Dependencies are tight — fundraising often depends on hitting specific traction metrics, and hiring depends on closing funding.
Product development roadmap sample
For established companies, a product roadmap often covers a 24-month horizon. Phases move through “Market Analysis,” “Concept Development,” “Prototyping,” “Manufacturing Setup,” and “Go-to-Market.”
The chart highlights the complex interplay between R&D, supply chain, and marketing. A key feature is the parallel processing of “Marketing Preparation” during the “Manufacturing” phase, ensuring a coordinated launch.
Market expansion Gantt chart
Expanding into new geography requires an 18-month timeline that balances internal readiness with external compliance, as shown in market expansion examples. Phases include “Regulatory Review,” “Partnership Development,” “Localization,” “Pilot Launch,” and “Full Rollout.”
This chart often shows parallel tracks for different regions, allowing the organization to apply learnings from one pilot to the next.
Digital transformation schedule
Enterprise transformation spans 36 months. The timeline includes “Current State Assessment,” “Technology Selection,” “Change Management,” “Phased Deployment,” and “Optimization.”
A critical element is the “Change Management” track running parallel to technical implementation. It visualizes the training and communication efforts required to ensure adoption.
5 best practices for building resilient business plan Gantt charts
Even with good intentions, strategic planning can fail if the timeline ignores reality. Avoiding these common pitfalls saves organizations from expensive delays and misaligned expectations.
Creating too much detail too early
Over-planning distant phases creates false precision. Spending hours detailing marketing activities for a product launch 18 months away is wasteful, as product specs will likely change.
Effective plans use progressive elaboration:
- Current quarter: Detailed weekly plans
- Next quarter: Monthly plans
- Future quarters: Quarterly buckets for the out-years
Missing hidden dependencies between teams
Strategic initiatives often derail because of “invisible” work. A common oversight is failing to account for IT infrastructure required to support a new marketing campaign, or legal review time needed for partnership contracts.
A checklist approach that forces every department to review the plan helps pinpoint these hidden dependencies before they become critical blockers.
Building static plans in dynamic markets
Rigid timelines become liabilities when the market shifts. Treating a Gantt chart as a fixed contract rather than a flexible guide leads to poor decisions.
Distinguish between:
- Fixed commitments: Regulatory deadlines
- Flexible elements: Feature sets
This allows the organization to pivot without breaking the entire plan.
Disconnecting from financial reality
Strategic timelines often fail to account for cash flow. A plan that schedules 3 major capital-intensive projects in the same quarter may be operationally possible but financially ruinous.
Integrating financial milestones into the Gantt chart matches the operational pace to the financial fuel available.
Forgetting change management timelines
Organizations consistently underestimate the “people” side of change management. Implementing a new software platform might take three months, but getting the team to use it effectively might take six.
Robust plans include dedicated phases for change management that extend well past the technical go-live.
Turn your business plan into reality with monday.com
monday.com transforms the business plan from a static document into a dynamic operational platform. It provides the structure to plan strategically while retaining the flexibility to execute tactically, bridging the gap between the boardroom and the front line.
Organizations achieve measurable improvements in strategic execution when they connect high-level planning to daily work management. The platform enables this connection through integrated features that scale from startup roadmaps to enterprise portfolios.
Connect strategy to daily execution with visual timelines
The platform connects high-level strategic timelines directly to the daily work that drives them. Strategic milestones defined in the portfolio view cascade down to team-level boards. This links every item to a business objective.
Key capabilities that support this connection include:
- Gantt chart views: Visual timelines of strategic initiatives with dependencies and critical path highlighting allow leaders to adjust schedules with simple drag-and-drop
- Portfolio management: High-level dashboards aggregate data from multiple project boards, giving executives a unified view of all strategic initiatives
- Goal tracking: The platform links timeline progress to specific KPIs, helping teams see how their work directly impacts business outcomes
- Cross-functional workflows: Automations handle the handoffs between departments, notifying the next team immediately when a dependent phase is complete
Break down silos with real-time collaborative planning
monday.com replaces siloed spreadsheets with a shared digital workspace. Distributed teams contribute to the plan in real-time, ensuring the timeline always reflects the latest reality.
Features that enable this collaboration include:
- Real-time updates: Changes made by one department are instantly visible to all stakeholders
- Permission controls: Granular permissions ensure everyone can see the plan while only authorized leaders can change strategic dates or budgets
- Communication integration: Contextual discussions happen directly on timeline items, integrating with Slack and Microsoft Teams
- Document management: Strategic briefs, budget files, and presentations are embedded directly into timeline phases
Reduce manual work with intelligent automation
monday AI reduces the administrative burden of maintaining a complex business plan. The platform’s intelligent features handle routine data movement and highlight strategic insights, freeing strategists to focus on analysis and decision-making rather than manual updates.
Automation capabilities include:
- AI Blocks for categorization: Intelligent features analyze and categorize incoming project requests, helping prioritize initiatives based on strategic fit
- Progress tracking automation: Status columns update automatically based on completion of underlying items
- Risk detection: Portfolio Risk Insights identifies potential scheduling conflicts and resource overloads before they cause delays
- Reporting automation: Scheduled reports generate executive summaries and stakeholder updates automatically
Scale your planning with enterprise portfolio management
The platform adapts to organizational maturity, supporting everything from a founder’s first roadmap to a multinational’s complex portfolio.
Scalability features include:
- Template library: Teams start quickly with proven frameworks for business planning, product launches, and strategic roadmaps
- Enterprise security: Advanced security features and compliance certifications ensure sensitive strategic data remains protected
- Integration ecosystem: The platform connects with CRM, ERP, and development systems, pulling data from across the tech stack
- Advanced analytics: Deep reporting capabilities provide insights into team performance, resource efficiency, and historical trends

Build a business plan that drives measurable results
Strategic planning succeeds when it connects boardroom vision to daily execution. Business plan Gantt charts provide the visual framework that makes this connection possible, transforming complex multi-year strategies into actionable timelines that teams can execute with confidence.
The organizations that thrive are those that move beyond static planning documents to dynamic systems that adapt as markets shift. They understand that strategic success requires both the big picture view and the operational discipline to execute consistently over time.
Ready to transform your strategic planning from spreadsheets to a unified platform that connects every level of your organization? Get started with monday.com and experience how visual timeline management drives measurable business results.
Try monday.comFrequently asked questions
How often should I update my business plan Gantt chart?
Business plan Gantt charts should be reviewed monthly for operational alignment and quarterly for strategic adjustments. Automated tracking in platforms like monday.com keeps the data current in real-time, reducing the need for manual overhaul. Regular reviews ensure the plan reflects actual progress and market conditions while maintaining strategic direction.
What software works best for business plan Gantt charts?
The most effective software combines high-level visualization with the ability to drill down into execution details. It should prioritize collaboration and flexibility over rigid scheduling features. Look for platforms that support portfolio views, resource management, and real-time updates while maintaining enterprise-grade security and integration capabilities.
How long should a business plan Gantt chart timeline be?
A strategic timeline typically covers 12 to 24 months to provide a meaningful long-term view. The level of detail should decrease the further out the timeline goes to maintain flexibility. Near-term quarters should show monthly or weekly detail, while distant quarters can remain at a higher level to accommodate changing conditions.
Can I create a business plan Gantt chart in Excel?
Excel can create basic static charts but fails at managing dependencies, real-time collaboration, and updates. It works for simple presentations but not for managing a living business strategy. Excel lacks the automation, integration, and collaborative features needed for enterprise planning where multiple stakeholders need simultaneous access and updates.
How do I show uncertainty in long-term planning?
Uncertainty is managed by using broader time buckets (quarters instead of weeks) for distant phases and adding visible buffer blocks. Scenario planning features allow you to visualize multiple timeline options side-by-side. Rolling-wave planning keeps near-term details precise while maintaining flexibility for future adjustments.
What level of detail should I include for investors?
Investors need to see major milestones, cash flow events, and key growth phases without getting lost in operational details. The chart should demonstrate a logical path to value creation and risk mitigation. Focus on strategic achievements like market entry, product launches, and revenue milestones rather than internal process steps.