Your marketing team just told you the product launch moved up three weeks. engineering says the API integration will take longer than expected. sales needs those new features for their biggest prospect meeting. Meanwhile, you’re staring at a project plan that suddenly looks like a house of cards, where moving one piece threatens to topple everything else.
This is where dependency diagrams save you. They show you exactly what’s connected and why. A dependency diagram maps how tasks, resources, and deliverables connect — showing what needs to happen and why it happens in that order. Simple timelines show when work happens. Dependency diagrams show why — revealing the relationships that drive your project’s flow and helping you catch bottlenecks before they spread.
Here’s everything you need to master dependency visualization in 2026. Explore this guide and you will learn the four essential dependency types, how to build diagrams in simple steps, and how the right work management platform can turn static charts into dynamic execution systems.
Key takeaways
- Map task relationships before work begins: identify which activities must finish before others can start to prevent delays from cascading through your entire project timeline.
- Use dependency diagrams to spot bottlenecks early: visualize where single points of failure could stall multiple workstreams and build contingency plans before problems emerge.
- Transform static plans into dynamic workflows with monday work management: automatically adjust all dependent tasks when timelines shift, keeping your entire team aligned without manual updates.
- Focus on the critical path to accelerate delivery: highlight the sequence of tasks that determines your project’s end date so you can allocate resources where they matter most.
- Monitor resource conflicts across teams: track when multiple tasks compete for the same people or assets to prevent overallocation and scheduling disasters.
What is a dependency diagram?
A dependency diagram is a visual map that shows how tasks, resources, and deliverables connect and rely on each other within a project or workflow. Think of it as your project’s blueprint — one that reveals which work must happen first, what can run in parallel, and where bottlenecks might emerge.
Timelines show when. Dependency diagrams show why. It shows the relationships that drive your project’s flow — making it easier to spot risks, allocate resources, and keep work on track.
For teams managing complex, cross-departmental work, dependency diagrams evolve with your project. When a marketing campaign waits on product features, or when IT infrastructure must be ready before a system launch, these diagrams show exactly how delays ripple through your organization.
Understanding task and resource dependencies
When one task relies on another’s completion, or when multiple teams need the same resource, you’ve got a dependency to manage. Dependencies fall into two main categories:
- Task dependencies: create logical constraints based on the nature of the work itself. A website can’t go live until content is approved. A product can’t ship until quality testing is complete. These relationships are fixed by the work itself — not by who’s available or when.
- Resource dependencies: emerge when multiple tasks compete for the same limited asset. This might be a specialized team member, a piece of equipment, or access to a system. If your lead developer is assigned to both a critical bug fix and a new feature rollout, you’ve created a resource dependency that could delay one or both projects.
Understanding these key differences gives you the power to plan more strategically. Task dependencies often require sequencing adjustments, while resource dependencies might be solved through reallocation or cross-training.
Core elements of effective dependency diagrams
Dependency diagrams use standardized visual elements to show complex relationships at a glance. These core components create a shared language that teams can easily understand.
The essential building blocks of any network diagram include three key elements:
- Nodes: individual units of work, milestones, or deliverables that form your project’s building blocks. Each node typically includes metadata like owners, due dates, and current status.
- Connectors: arrows or lines that show workflow direction, pointing from the predecessor task (what must happen first) to the successor task (what follows).
- Lag and lead indicators: special notations showing if a successor needs to wait after a predecessor finishes (lag) or if tasks can overlap (lead).
Together, these elements show your project’s logic — what needs to happen and how it all fits together.
Business impact of dependency visualization
Gaining visibility into dependencies allows you to proactively identify risks long before deadlines are impacted or budgets are strained. Visualizing these relationships changes how organizations manage complex work.
Dependency visualization does more than track projects:
Risk mitigation becomes proactive rather than reactive
Dependency diagrams expose single points of failure where one delayed task could stall multiple workstreams. Identifying these clusters early allows teams to build contingency plans and alternative paths before problems materialize.
Resource optimization improves dramatically
It’s hugely beneficial when you can see which tasks can run in parallel versus those that must be sequential. This visibility helps managers distribute workloads more effectively through resource optimization, reducing both idle time and overallocation.
Timeline accuracy depends on understanding the critical path through your project
This is particularly critical in complex programs where misaligned dependencies can lock in costly schedules — as seen in major infrastructure projects where more than half of planned vessels are on contract before upstream validation is complete.
Precedence diagrams provide the data needed to build realistic schedules that account for handoffs, review cycles, and the actual sequence of work — not just wishful thinking about parallel execution.
Dependency graph vs dependency diagram
While people often use these terms interchangeably, dependency graphs and dependency diagrams serve different purposes in technical and operational contexts.
A dependency graph typically represents mathematical or abstract relationships used in software engineering and data science to map code structure or data flow. A dependency diagram focuses on project management visualization, mapping workflow logistics, timelines, and human tasks that drive business operations.
Key differences in visualization approaches
Pick based on your audience and what you’re mapping. Each approach works best in different situations, as outlined in the table below:
| Attribute | Dependency graph | Dependency diagram |
|---|---|---|
| Primary focus | Structural relationships and data flow logic | Operational workflow, timing, and task sequencing |
| Target audience | Software architects, developers, data scientists | Project managers, stakeholders, operations teams |
| Complexity | High density; often automated and abstract | Moderate density; focused on readability and actionability |
| Key metric | Connectivity and cyclic relationships | Time, sequence, and resource allocation |
| Visual style | Network nodes with complex, often crossing edges | Linear or hierarchical flow (e.g., PERT, Gantt) |
Choosing the right dependency mapping method
Selecting the correct visualization method prevents information overload and ensures your diagram drives actual decision-making. Consider these factors when determining your approach:
- Is the goal to debug a system or manage a project? If you’re optimizing software architecture, a graph makes sense. If you’re delivering a marketing campaign, you need a diagram.
- Who needs to read and act on this information? C-level executives and cross-functional department heads need dependency diagrams that provide context about time and resources, not abstract network graphs.
- How often does the data change? Workflows involving human handoffs and approval gates benefit from the structured approach of dependency diagrams, which offer stronger visibility into bottlenecks than abstract graphs.
Common applications for each format
Dependency graphs work best in technical environments. Dependency diagrams work best for operational execution.
Dependency graphs work best for:
- Mapping library dependencies in a codebase to prevent circular logic.
- Visualizing foreign key relationships between database tables.
- Analyzing server connections and potential vulnerability paths.
- Tracking module interactions in complex software systems.
Dependency diagrams excel at:
- Coordinating R&D, marketing, and sales tasks for product launches
- Managing construction projects where foundation work must precede framing
- Sequencing vendor bookings and venue preparation for events
- Aligning cross-departmental initiatives with shared deadlines
Accurate dependency mapping starts with defining exactly how tasks relate. Project managers use four distinct logical relationships to model real-world complexity and ensure smooth execution.
4 essential dependency types in projects
Understanding dependency types helps you build accurate timelines and catch bottlenecks before they hit delivery. Each type fits specific workflows and offers different advantages.
Finish-to-start dependencies
Finish-to-Start (FS) dependencies represent the most common logical sequence in projects using arrow diagrams. The predecessor task must reach 100% completion before the successor task can begin. This is the default relationship in most project management software.
For example, a blog post cannot be published until editorial review is complete, and a product cannot ship until packaging is finalized. These relationships offer maximum quality control but extend project timelines since no overlap is possible, making this approach best when quality matters more than speed.
Start-to-start dependencies
Start-to-Start (SS) dependencies enable parallel work in network diagrams, accelerating project timelines. The successor task cannot begin until the predecessor starts, but they don’t need to finish simultaneously.
Frontend user interface development can begin as soon as backend API design starts, allowing both teams to work simultaneously based on initial specifications. Marketing can start creating campaign materials once product development begins, even before the final product is complete.
This approach fast-tracks projects and compresses schedules, but it increases rework risk if initial assumptions change.
Finish-to-finish dependencies
Finish-to-Finish (FF) dependencies link the completion of two tasks. The successor cannot finish until the predecessor finishes, ensuring synchronized delivery of related components.
Quality assurance testing cannot finish until software coding completes. While QA can start testing early builds, they cannot sign off on the release until developers write the final line of code. Documentation cannot be finalized until product development wraps up, though writers can draft content throughout the process.
This dependency type keeps interdependent components synchronized at delivery — preventing work that’s technically done but practically useless.
Start-to-finish dependencies
Start-to-Finish (SF) dependencies are the rarest type, where the predecessor task cannot finish until the successor task starts. This typically relates to resource handovers or continuity requirements.
In 24-hour security operations, the night shift guard cannot finish their shift until the morning shift guard starts. The completion of the first task is triggered by the initiation of the second. Similarly, a legacy system cannot be decommissioned until the new system goes live.
This dependency type works best for just-in-time operations or shift-based work where maintaining continuous coverage is essential.
Create a dependency diagram in 5 steps
Building an effective dependency diagram starts with gathering information, then translating it into visual logic. Follow these handy steps below whether you’re using a whiteboard, spreadsheet, or enterprise work management platform.
Step 1: list all project activities and deliverables
Start with a comprehensive audit of your project scope. Miss a task now, and you’ll find hidden dependencies later — usually as delays.
Review your project charter and break down major deliverables into sub-items. Consult with department leads to capture hidden administrative or approval tasks that often get overlooked. Document every action needed to reach your project goal — from initial planning meetings to final sign-offs.
Don’t forget buffer tasks and contingency activities. These often-forgotten tasks become critical when projects hit obstacles.
Step 2: identify task relationships and constraints
Turn your task list into a network by defining how tasks connect. For every task, ask two essential questions: “What must happen before this can start?” and “What can only happen after this is finished?”
Identify both hard and soft constraints at this stage:
- Hard constraints: non-negotiable requirements like regulatory waiting periods or technical prerequisites.
- Soft constraints: preferences that could be adjusted if needed, such as review cycles or internal approval processes.
Document external dependencies too, such as vendor deliveries or client approvals, which often become critical path items.
Step 3: select your dependency diagram platform
Your platform choice determines how useful your diagram will be. Simple drawing applications work for one-off brainstorms, but complex organizational workflows need dynamic solutions.
The best platforms let you adjust task dates in real time — automatically updating all dependent tasks. Teams using monday work management can establish FS, SS, FF, and SF relationships directly in the Gantt view, watching changes cascade automatically through the entire project timeline.
Look for platforms that integrate with your existing tools, support multiple views, and let teams edit collaboratively.
Step 4: build your dependency visualization
Once your data and platform are ready, build your diagram using visualization best practices. Arrange tasks chronologically from left to right, and highlight critical path items that determine project duration.
Ensure your diagram is easy to interpret:
- Minimize crossing lines to reduce visual confusion.
- Use color coding to distinguish between teams or project phases.
- Ensure labels are readable at a glance.
- Add milestone markers and phase boundaries.
The critical path feature in monday work management instantly highlights the sequence of tasks that determine project duration, allowing managers to focus attention where it matters most.
Step 5: validate dependencies with stakeholders
Your diagram is just a theory until the people doing the work verify it. Schedule review sessions with team leads and stakeholders to confirm mapped relationships reflect reality.
Validation reveals hidden assumptions and missing dependencies. The legal team might need five days for review, not three. Design and copy might not actually be able to work in parallel due to brand guidelines. This keeps your diagram grounded in reality — not theory.
Update your diagram based on feedback and establish a regular review cycle to keep it current as project conditions evolve.
“monday.com has been a life-changer. It gives us transparency, accountability, and a centralized place to manage projects across the globe".
Kendra Seier | Project Manager“monday.com is the link that holds our business together — connecting our support office and stores with the visibility to move fast, stay consistent, and understand the impact on revenue.”
Duncan McHugh | Chief Operations OfficerTypes of dependency diagram platforms and generators
Organizations choose between three types of platforms for managing dependencies typically. Each has advantages and trade-offs and your choice very much determines how much manual maintenance is required to keep projects on track.
Manual dependency charting software
General-purpose diagramming apps give you maximum visual control — they treat dependency diagrams as drawings. They work best for initial concepts and presentations where aesthetics matter.
The big problem? They’re disconnected from actual work. When a task delays in reality, someone must manually update the diagram, leading to version control issues and stale data. Teams often find themselves maintaining multiple versions, unsure which reflects current reality.
Automated dependency graph creators
Specialized project management platforms include features that auto-generate network diagrams from task lists. When you link Task A to Task B, the software automatically draws the connection.
This keeps visuals accurate and eliminates manual drawing. The downside? Rigid layouts. Auto-generated diagrams may be difficult to customize for presentations, focusing purely on logical accuracy over visual appeal.
Enterprise dependency management solutions
Work management platforms integrate dependency visualization directly into execution workflows. The diagram isn’t just a view — it’s an active control panel for your project.
Moving a dependency on the visual timeline in monday work management automatically adjusts due dates, notifies assignees, and recalculates resource availability across the portfolio. This approach connects planning and execution, keeping your dependency map in sync with actual work.
Dependency diagram templates and examples
Templates speed up diagramming by giving you pre-built logic for common workflows. They keep your organization consistent and save you from starting from scratch.
These frameworks cover the most common dependency scenarios — from simple workflows to complex cross-departmental projects.
Project management dependency templates
Standard PM templates are pre-configured for Waterfall or Agile workflows. They include critical path views that highlight the dependencies determining your project’s end date.
These templates also include placeholders for standard phases like Initiation, Planning, Execution, and Closure, with requisite approval gates already linked between phases. Teams can customize templates while keeping the dependency logic that prevents common planning mistakes.
Cross-department process dependencies
Cross-functional templates address the coordination challenge between departments using network diagrams. They visualize handoffs between functions, highlighting deliverables that cross departmental boundaries.
These templates often use swimlanes to show ownership changes and specify where one team’s output becomes another team’s input. Marketing hands off campaign briefs to creative. Product delivers specifications to engineering. Each transition point is clearly marked with its dependencies and requirements.

PMO templates map project-to-project connections, not individual tasks. They track high-level milestones and show how delays in one initiative impact others across the portfolio.
A software release might depend on an infrastructure upgrade. A marketing campaign might require three different product features to be complete. These templates show strategic alignment across your organization and highlight where projects might compete for resources.
Resource allocation dependency charts
Resource-focused templates put people first, showing dependencies based on availability and skills. If a specific specialist is required for three different initiatives, this chart highlights the scheduling conflict.
These templates help with capacity planning — letting managers balance workloads and prevent burnout. The Workload View in monday work management aggregates data across the organization to show exactly who is over-allocated, enabling proactive rebalancing before dependencies cause delays.
7 best practices for dependency management
Dependency management doesn’t stop after you create the diagram. These practices below will keep your dependency tracking accurate and valuable.
These strategies also turn dependency diagrams from static docs into dynamic tools that prevent delays and resource conflicts.
1. Schedule regular dependency reviews
Dependencies evolve as projects progress, so schedule weekly or bi-weekly reviews focused on upcoming handoffs. Weekly or bi-weekly reviews focus specifically on upcoming handoffs, verifying that predecessors are on track to meet their deadlines.
These sessions prevent surprise delays — like when a team discovers they’re waiting without notice. Regular reviews also catch new dependencies that pop up as you understand the project better.
2. Document dependency changes immediately
When a dependency shifts, update your central platform immediately. Documentation lag creates a dangerous gap between plan and execution.
Real-time updates keep automated notifications accurate and everyone working from the same information. This practice is especially critical for cross-functional dependencies where teams might not communicate daily.
3. Communicate dependencies across teams
Dependencies often create friction between departments. Managing them well means setting clear communication protocols.
When a marketing task depends on a product feature, the product team must understand the downstream impact of their delays. Transparent communication turns dependencies from blame points into shared responsibilities.
4. Build buffer time for critical dependencies
Build buffers into your most critical dependencies — especially those on the critical path or involving external vendors.
This buffer absorbs small delays without derailing your schedule. Even a two-day buffer can mean the difference between on-time delivery and cascading delays across multiple teams.
5. Monitor resource dependencies continuously
Resource availability fluctuates due to sick leave, turnover, or urgent requests. Continuous monitoring through workload views allows managers to spot when a resource dependency has become a conflict.
Proactive reallocation keeps work flowing when key contributors become unavailable. This might mean reassigning tasks, adjusting timelines, or bringing in additional support before delays impact the critical path.
6. Create dependency risk mitigation plans
For every critical dependency, develop a backup plan. If the primary vendor fails to deliver, identify an alternative. If API integration is delayed, determine if the frontend can launch with mock data.
Risk mitigation planning involves identifying dependencies with the highest probability of failure and highest impact, then pre-approving alternative paths that keep projects moving.
7. Use dependency data for decision making
Dependency data is a strategic asset that reveals patterns over time. Analyzing past projects shows which teams consistently cause bottlenecks or which types of dependencies most frequently break.
This historical data informs future planning, allowing organizations to set realistic lead times and resource allocations for upcoming initiatives. Teams learn from experience rather than repeating the same dependency-related mistakes.
AI-powered dependency tracking and analysis
Artificial Intelligence transforms dependency management from reactive tracking to predictive optimization. Advanced work management platforms leverage AI to analyze complex relationship webs, offering insights that human oversight might miss.
AI capabilities extend far beyond simple automation too, providing intelligent analysis that helps teams anticipate problems, optimize resource allocation, and make data-driven decisions about project timelines and scope.
Transform static diagrams into dynamic workflows
AI agents within work management platforms monitor every connected item’s status in real time. When a task is marked as stuck or delayed, AI instantly recalculates timelines for all downstream dependencies.
This transforms diagrams from static drawings into dynamic systems that self-adjust. Teams receive always-accurate forecasts of project completion dates based on actual performance, not optimistic estimates. The system learns from historical data to improve prediction accuracy over time.
Automatic dependency risk detection
Machine learning algorithms analyze historical performance to flag risks before they materialize. If a team historically takes five days for a task but is only allocated three days in the current plan, AI highlights this as a high-probability dependency breach.
Portfolio Risk Insights in monday work management scans all project boards simultaneously, flagging potential risks by severity. This early warning system allows managers to intervene weeks before deadlines are missed, adjusting resources or timelines proactively.
Real-time dependency monitoring
AI enables continuous surveillance of the project network without manual oversight. The system tracks not just task completion but the velocity of work, identifying when predecessor tasks are slowing down.
If the pace of work decreases, the system alerts owners of successor tasks that their start date will likely slip. This real-time monitoring keeps stakeholders aligned without constant status meetings or manual updates.
Predictive dependency impact analysis
Advanced AI capabilities offer scenario modeling for dependency changes. Managers can simulate the impact of moving a launch date forward by two weeks, and AI will trace the dependency chain to show exactly which tasks become unfeasible.
This predictive capability empowers data-driven negotiation about scope and timelines. Teams understand the true cost of changes before committing to them, reducing last-minute scrambles and unrealistic commitments.
Visualize dependencies with monday work management
monday work management unifies dependency visualization with execution, providing a centralized platform where strategy and operations align. The platform moves beyond simple drawing applications, offering an interconnected environment where dependencies drive automation, insights, and collaboration.
This integrated approach ensures that dependency diagrams remain connected to actual work execution, automatically updating as project conditions change and providing real-time visibility into cross-functional workflows.
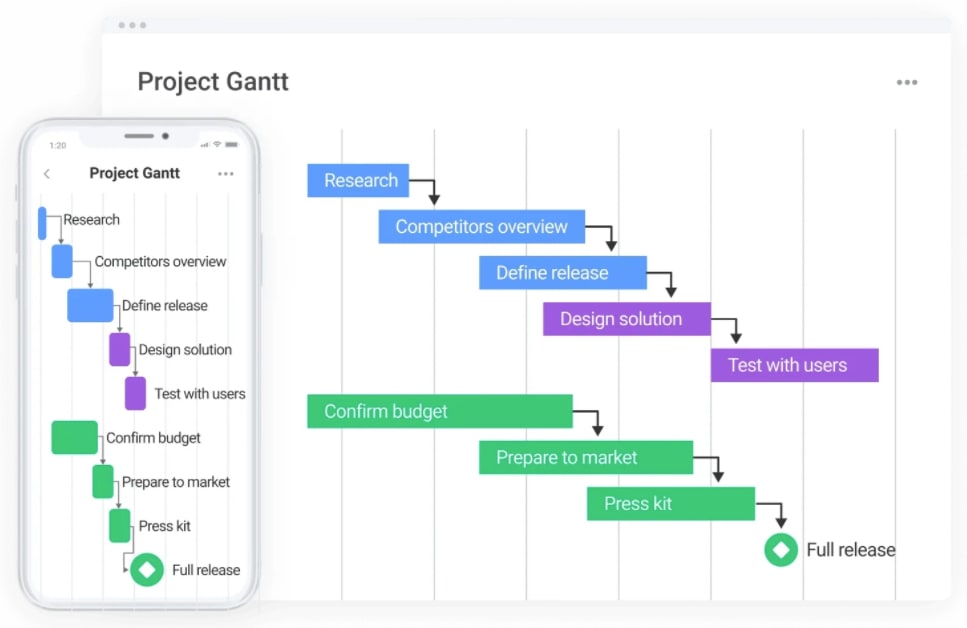
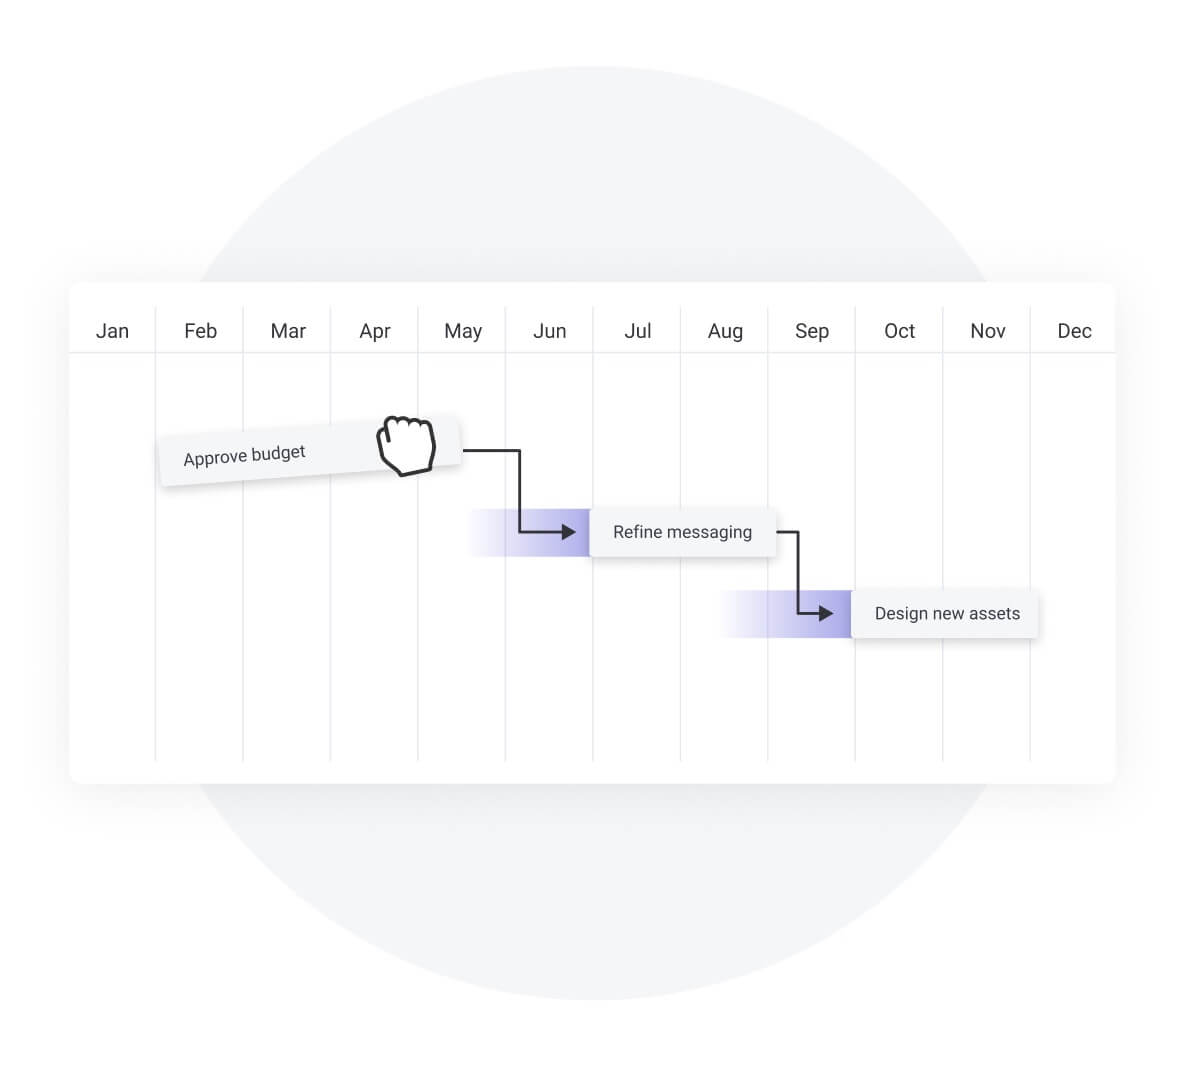
Gantt charts for timeline dependencies
The Gantt view in monday work management transforms task lists into visual timelines where dependencies are established through intuitive drag-and-drop actions. Teams can define all four dependency types directly on the chart.
When timelines shift, the platform offers automatic adjustment of all dependent items, maintaining schedule integrity with a single click. This eliminates the manual cascade of date changes that plague spreadsheet-based planning.
Portfolio risk insights for dependency detection
The Portfolio Risk feature provides leadership with an X-ray view of cross-project health. AI-driven analysis scans multiple boards to identify dependency conflicts spanning different initiatives.
This capability flags potential bottlenecks where a delay in one project threatens another’s viability. Leaders gain the visibility needed to make strategic decisions about resource allocation and project prioritization.
Workload view for resource dependencies

The Workload View visualizes the human side of dependencies by aggregating data across the organization to show exactly who is over-allocated and where resource conflicts are creating bottlenecks.
Managers can reassign tasks directly from the view, immediately resolving resource dependencies. This proactive balancing ensures that dependencies on specific individuals don’t become single points of failure for the entire portfolio.
Automated dependency tracking
Automation recipes handle the mechanics of dependency logic without manual intervention, helping organizations reclaim significant time from manual coordination tasks. Research indicates that merchants could reclaim up to 40% of their time from repetitive, manual processes through intelligent automation. Teams set rules like “When Task A status changes to Done, change Task B status to In Progress” or “When a date changes, notify the owner of the dependent task.”
This eliminates the administrative burden of updating statuses and ensures handoffs happen instantly. The reduction in lag time between tasks can significantly compress project timelines.
Real-time collaboration on dependencies
Dependencies are fundamentally about communication and coordination. The platform embeds collaboration directly into dependency nodes through comments, file attachments, and team member tagging.
When a dependency is at risk, the conversation happens in context. Everyone involved has visibility into the resolution plan, reducing the need for separate status meetings and email chains.
Comparison: monday work management vs alternatives
Understanding how different approaches handle dependency management helps teams make informed platform decisions. Take a look at the table below to see how monday work management stacks up again traditional applications and spreadsheets:
| Feature | monday work management | Traditional diagramming applications | Spreadsheets / manual tracking |
|---|---|---|---|
| Real-time updates | Yes. Changes reflect instantly across all views and dashboards | No. Requires manual redrawing and re-exporting | No. Requires manual data entry and formula checks |
| Actionability | High. Click a node to update status, assign work, or communicate | None. Static image disconnected from actual work | Low. Cells contain text, not active workflows |
| Automation | Native. Automations trigger actions based on dependency status | None | Limited. Requires complex scripts or macros |
| Resource management | Integrated. Workload view connects directly to task dependencies | None | Difficult. Requires separate tabs and manual reconciliation |
| Scalability | Enterprise. Handles cross-project and portfolio dependencies | Limited. Becomes unreadable with high complexity | Poor. Breaks down with large data sets |
Turn dependency chaos into execution clarity
Dependency diagrams transform scattered project information into actionable workflow intelligence. When teams visualize how work connects across departments and timelines, they gain the power to prevent delays before they cascade through the organization.
The most successful organizations treat dependency management as a strategic capability, not just a planning exercise. They use these visual maps to optimize resource allocation, compress project timelines, and build resilience into complex workflows.
Ready to bring order to your project dependencies? Get Started with monday work management and experience how integrated dependency visualization keeps your teams aligned and your projects on track.
Try monday work managementFrequently asked questions
What is a dependency diagram?
A dependency diagram is a visual representation that maps the logical relationships and sequence of tasks, deliverables, or resources within a project. It identifies which activities must be completed before others can begin, helping teams understand workflow logic and prevent bottlenecks. It identifies which activities must be completed before others can begin, helping teams understand workflow logic and prevent bottlenecks.
What is the best chart to show dependencies?
The best chart to show dependencies is the Gantt chart. It is the most effective visualization for showing timeline-based dependencies because it combines task sequencing with duration and allows teams to see the critical path at a glance, making it ideal for project planning and tracking. It combines task sequencing with duration and allows teams to see the critical path at a glance, making it ideal for project planning and tracking.
What are dependency graphs used for?
Dependency graphs are primarily used in software engineering and data science to visualize the structure of code, database relationships, or system architectures. They help developers understand how different modules interact and identify potential issues in system design.
How do dependency diagrams prevent project delays?
Dependency diagrams prevent delays by exposing the critical path and highlighting potential bottlenecks before work begins. This visibility allows managers to allocate resources effectively, create contingency plans, and adjust timelines proactively when issues arise.
Can dependency diagrams track resource conflicts?
Yes, when integrated into a work management platform, dependency diagrams can overlay resource availability to highlight instances where multiple dependent tasks require the same person or asset simultaneously. This helps prevent overallocation and scheduling conflicts.
How does monday work management handle dependency visualization differently?
monday work management integrates dependency visualization directly with workflow execution, meaning the diagram is interactive and self-updating. It combines Gantt charts, workload views, and cross-project automation to manage dependencies dynamically, unlike static diagramming tools that require manual updates.