
Effective sales teams run on accurate, real-time information. Yet, many organizations still rely on static spreadsheets and delayed reports, creating a gap between what their team is doing and what leadership can see. This lack of instant visibility makes it difficult to spot risks, coach effectively, and forecast revenue with any real confidence.
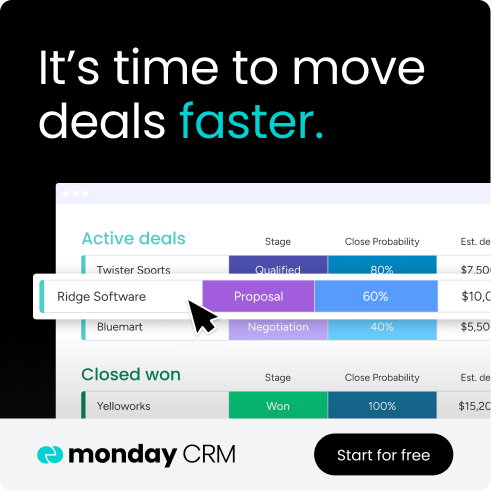
A modern sales dashboard closes this gap by turning scattered data into a single, visual view of your pipeline. It provides an up-to-the-minute look at your entire sales operation, from individual activities to overall pipeline health.
This guide breaks down 11 essential sales dashboard templates that support revenue growth. You’ll see dashboards for pipeline management, sales performance, and executive reporting, along with ways to turn raw numbers into actionable insights. We’ll also show how monday CRM makes it simple to build and customize these views for every role on your team.
Try monday CRMKey takeaways
- Real-time dashboards give sales teams live visibility into pipeline health, activities, and revenue, instead of relying on static reports.
- Focusing on core metrics like pipeline value, conversion rates, and deal velocity makes it easier to coach teams and spot risks early.
- monday CRM’s no-code dashboard builder lets any team member create custom sales dashboards using drag-and-drop widgets and AI-powered insights.
- Mobile-ready dashboards keep reps, managers, and executives connected to critical data wherever they work.
- Role-based views give each role the right level of detail, so reps, managers, and leaders can focus on decisions that move revenue forward.
What makes an effective sales dashboard template?
A sales dashboard is a visual display that shows your sales data in real time, and implementing one as part of a CRM system can lead to an average increase of 29% in sales. This means you can see your team’s performance, track deals, and spot trends instantly with a sales dashboard — all in one place.
A sales dashboard gives you a single source of truth for your pipeline. Instead of digging through spreadsheets or waiting for weekly reports, you get immediate answers to questions like “How many deals are closing this month?” or “Which rep needs coaching?”
The most effective dashboard templates share 4 key characteristics that set them apart from basic reporting:
- Real-time data sync: Your numbers update automatically as deals progress
- Customizable metrics: You choose which KPIs matter most to your business
- Mobile accessibility: Check your data from anywhere, on any device
- Role-based views: Each person sees only what they need for their job
Real-time data synchronization
Real-time sync means your dashboard updates the moment something changes in your sales process. When a rep moves a deal forward or a new lead comes in, you see it immediately.
This instant visibility changes how you approach sales management. No more waiting for end-of-day reports or wondering if your data is current. You can spot opportunities and address issues as they happen.
Customizable metrics and KPIs
KPIs (key performance indicators) are the specific numbers that tell you if your sales team is winning. Every business tracks different metrics based on what drives its success, so flexibility matters.
You might focus on monthly recurring revenue if you run a subscription business, or average deal size if you sell to enterprises. The right template lets you pick and display exactly what matters to your team.
Mobile-first design
Mobile-first design ensures your dashboard works perfectly on phones and tablets. In fact, organizations using mobile CRM are significantly more likely to reach their sales targets — 65% of the time compared to just 22% for those without mobile access.
Role-based access controls
Not everyone needs to see everything. Role-based access means each person gets a view tailored to their responsibilities.
Sales reps see their own pipeline and targets. Managers view team performance and coaching opportunities. Executives get high-level revenue trends. This focused approach keeps everyone aligned without overwhelming them with irrelevant data.
11 best sales dashboard templates for revenue growth
Ready to transform your sales tracking? These 11 templates address the most common challenges revenue teams face. Each one solves a specific problem and can work alone or as part of a complete system.
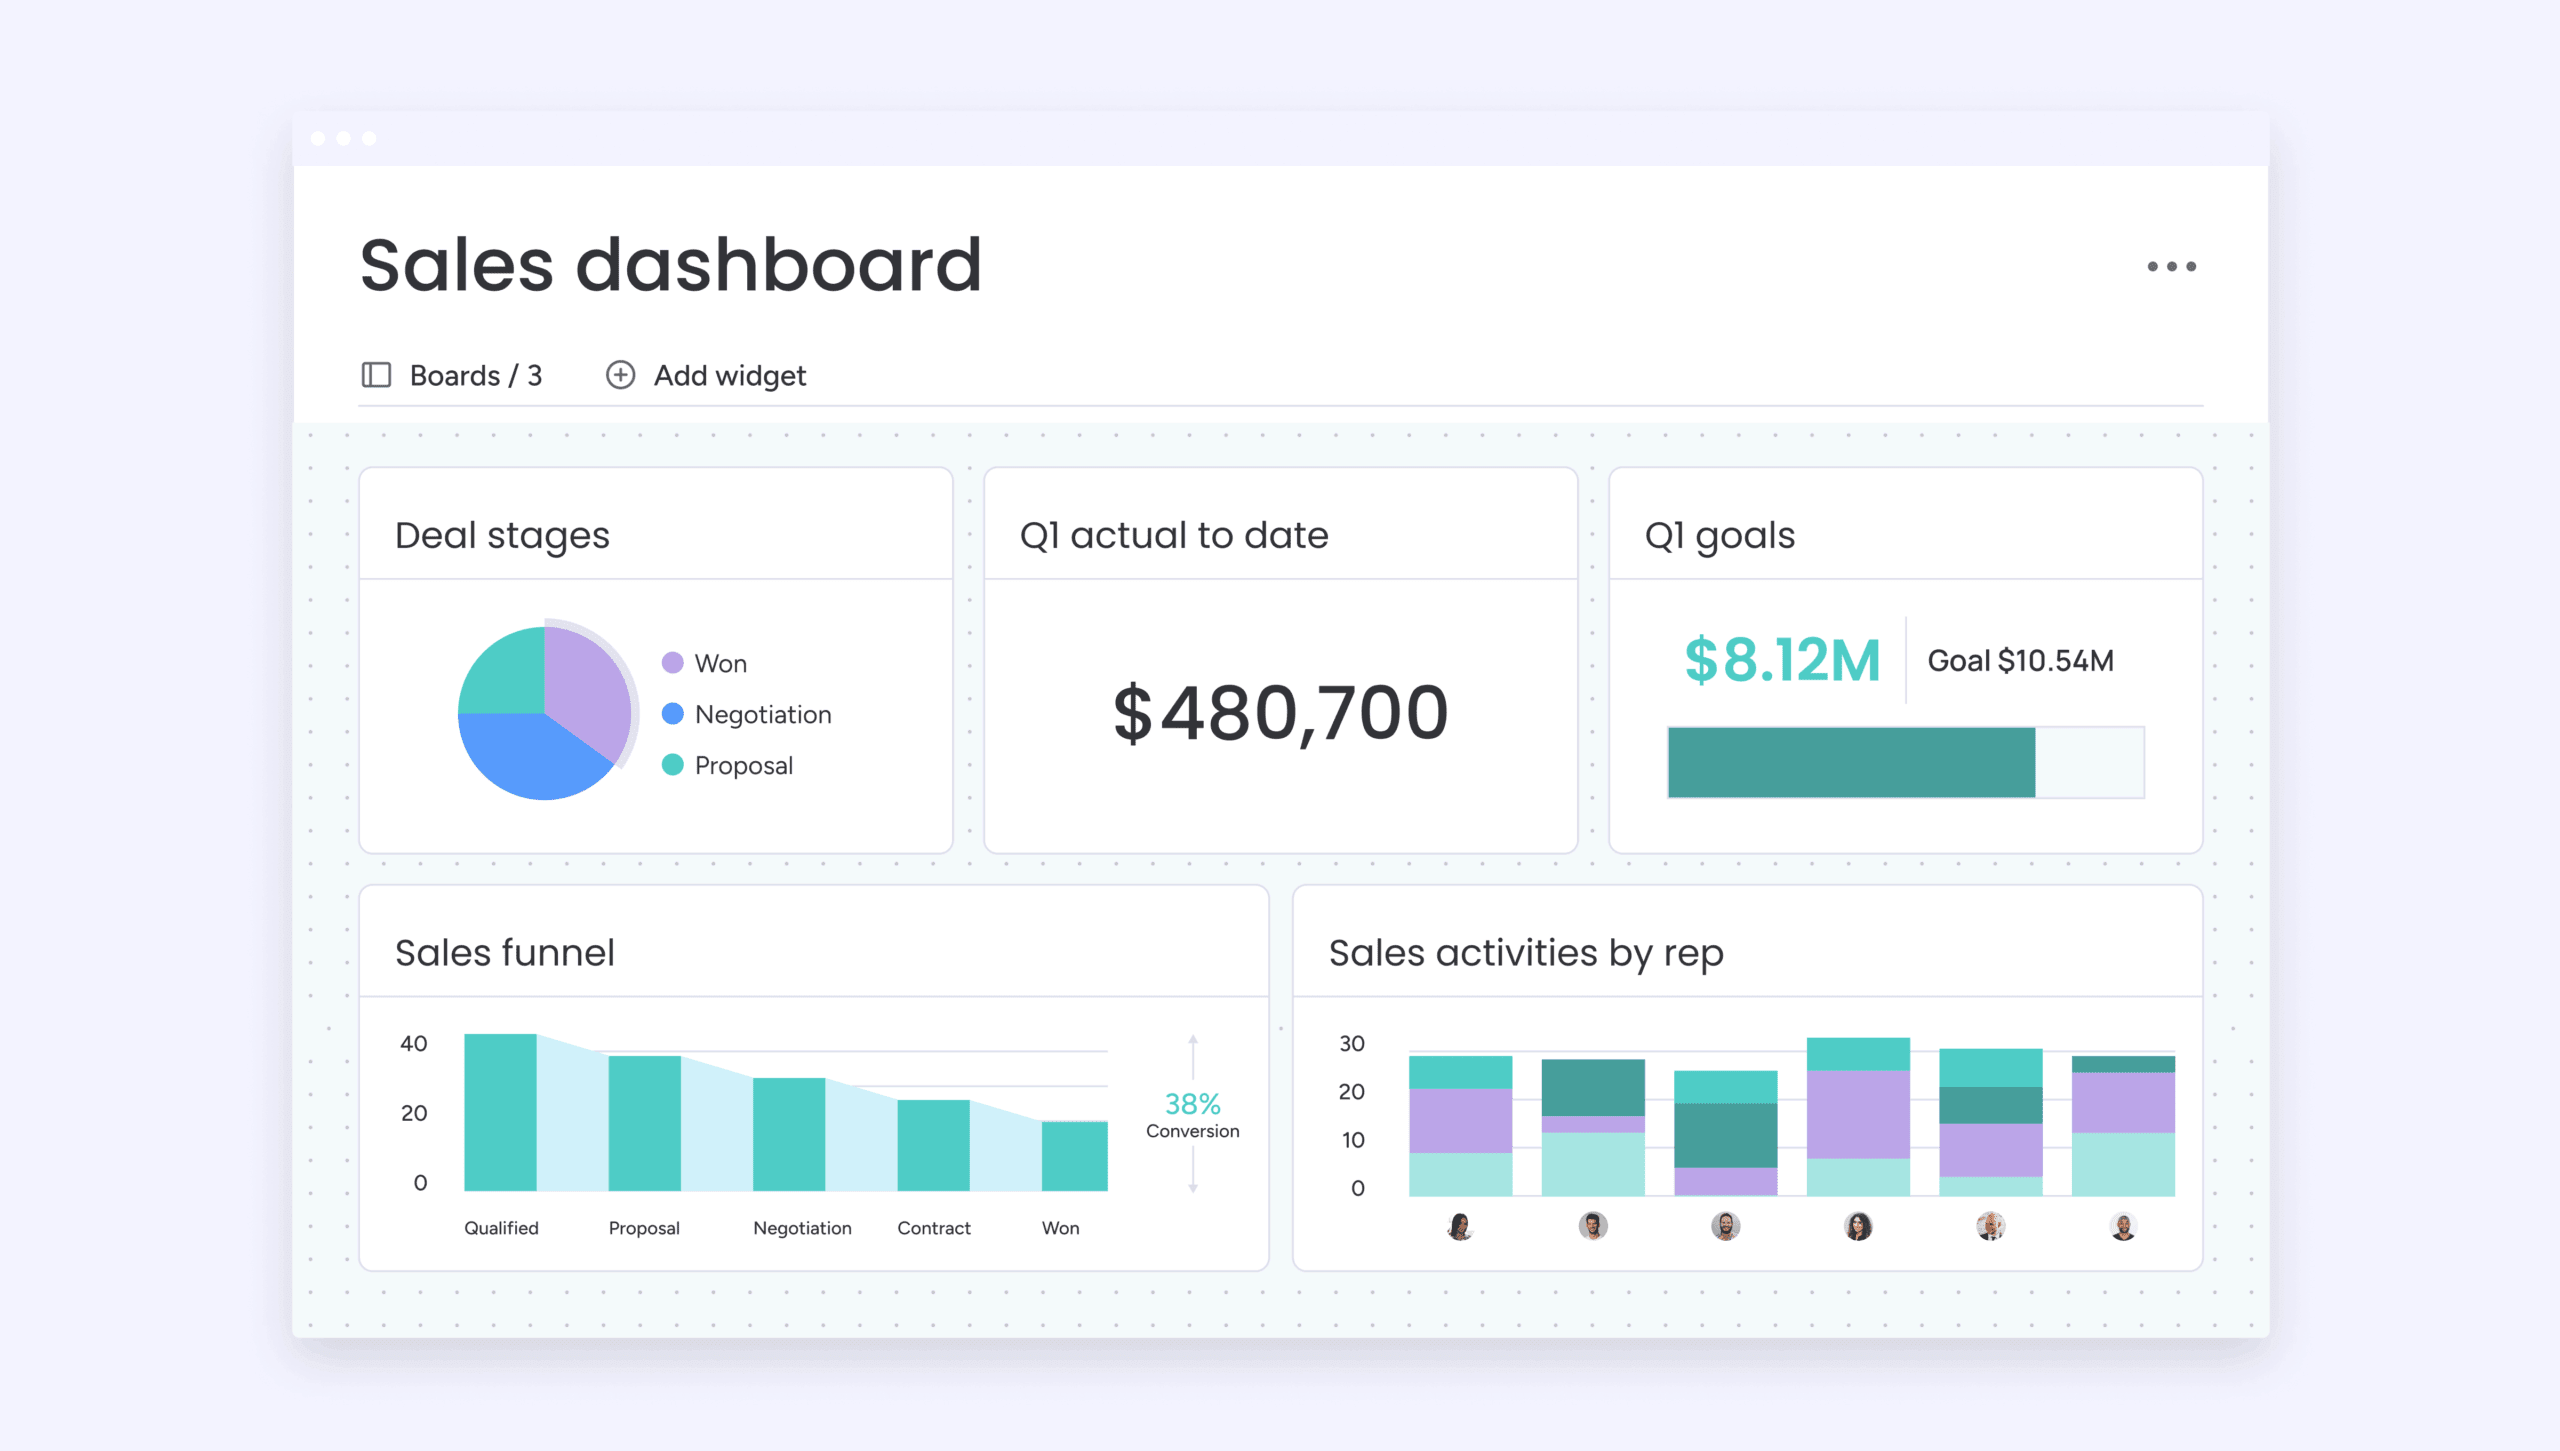
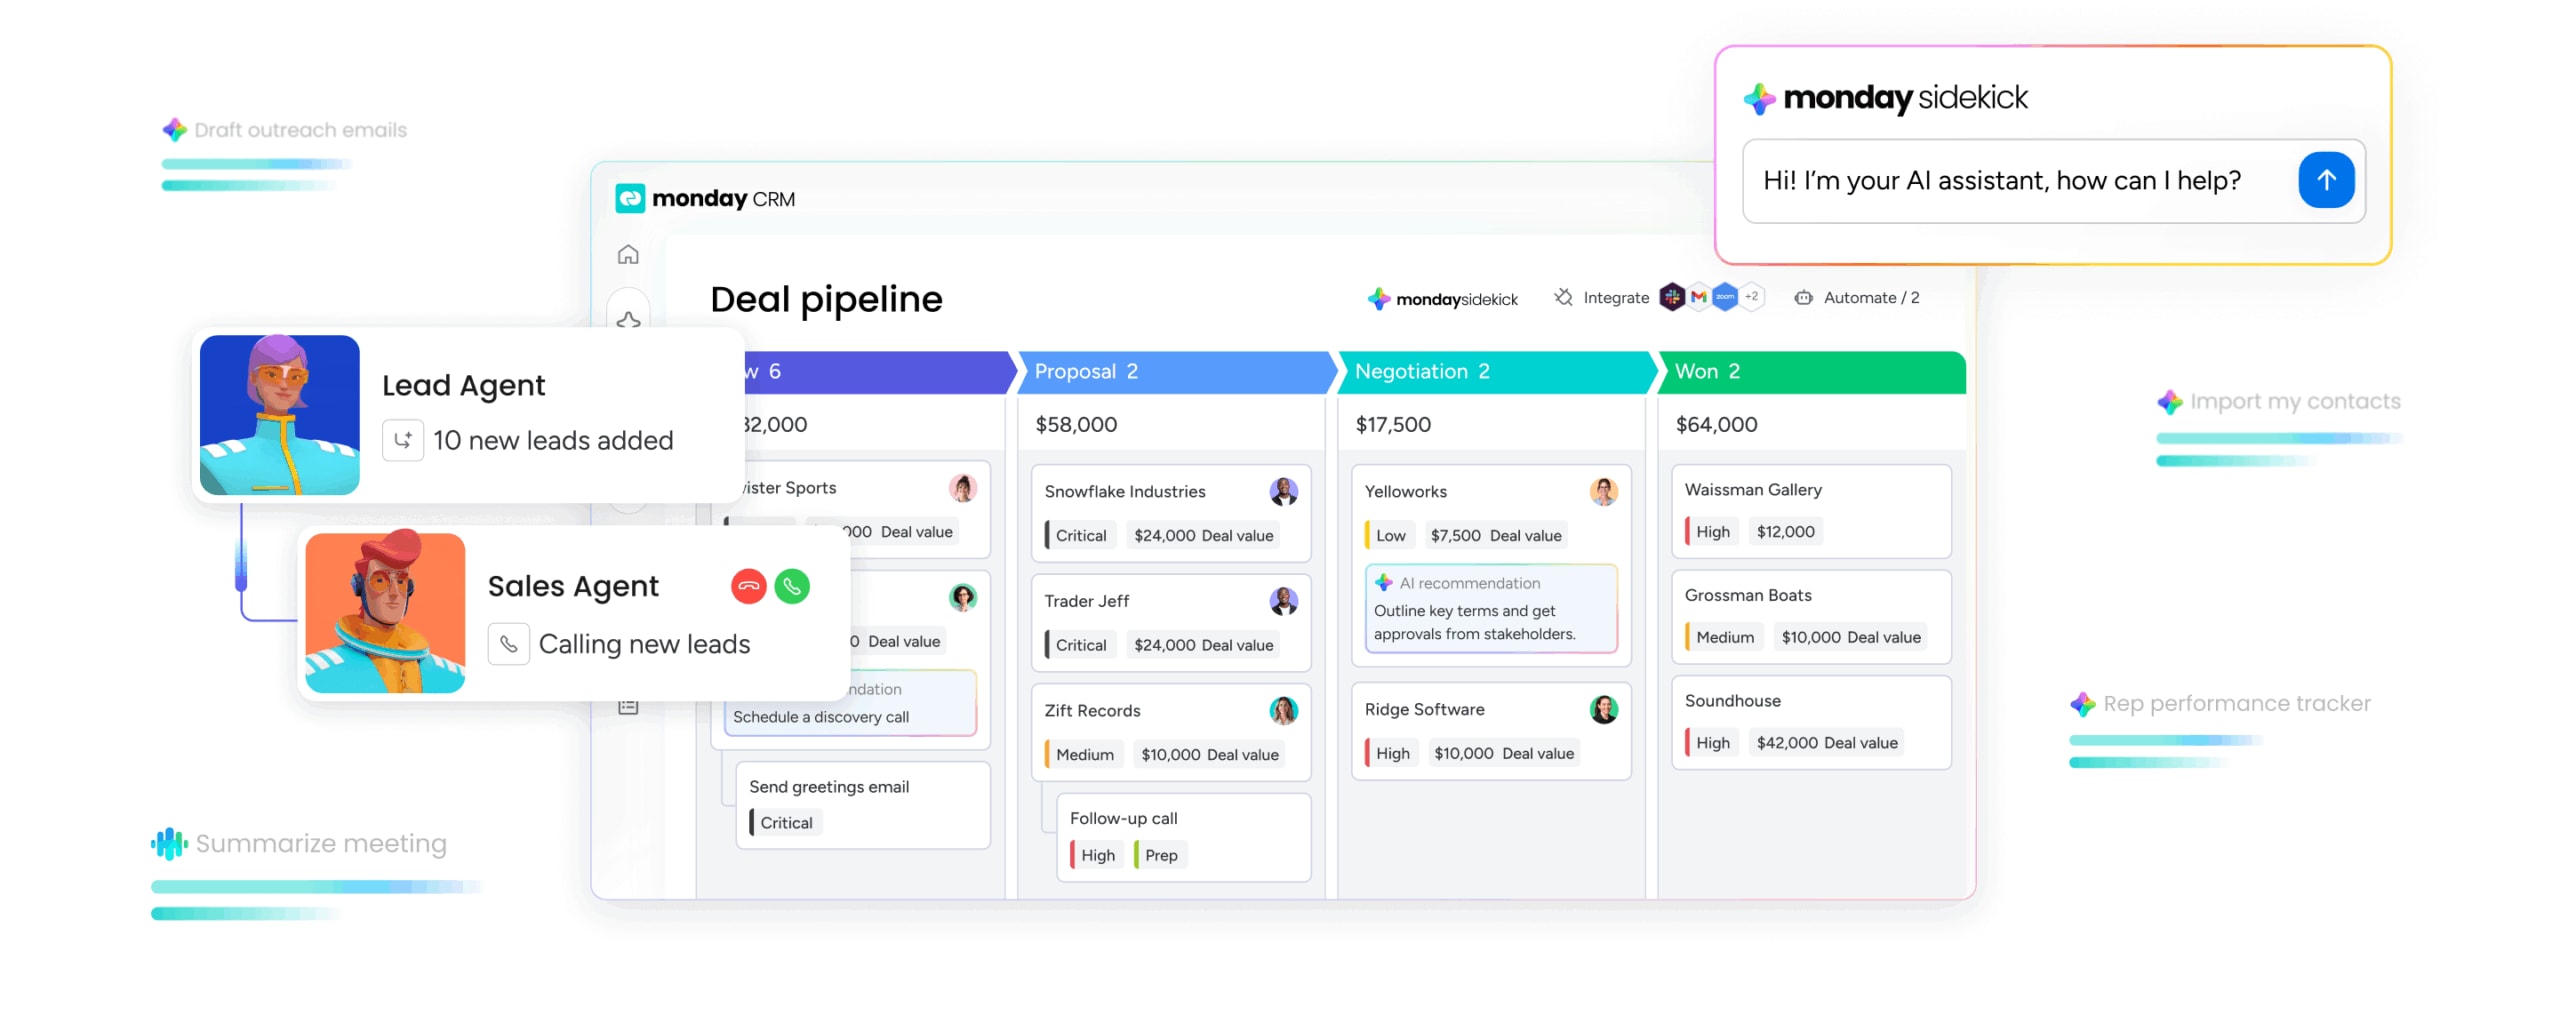
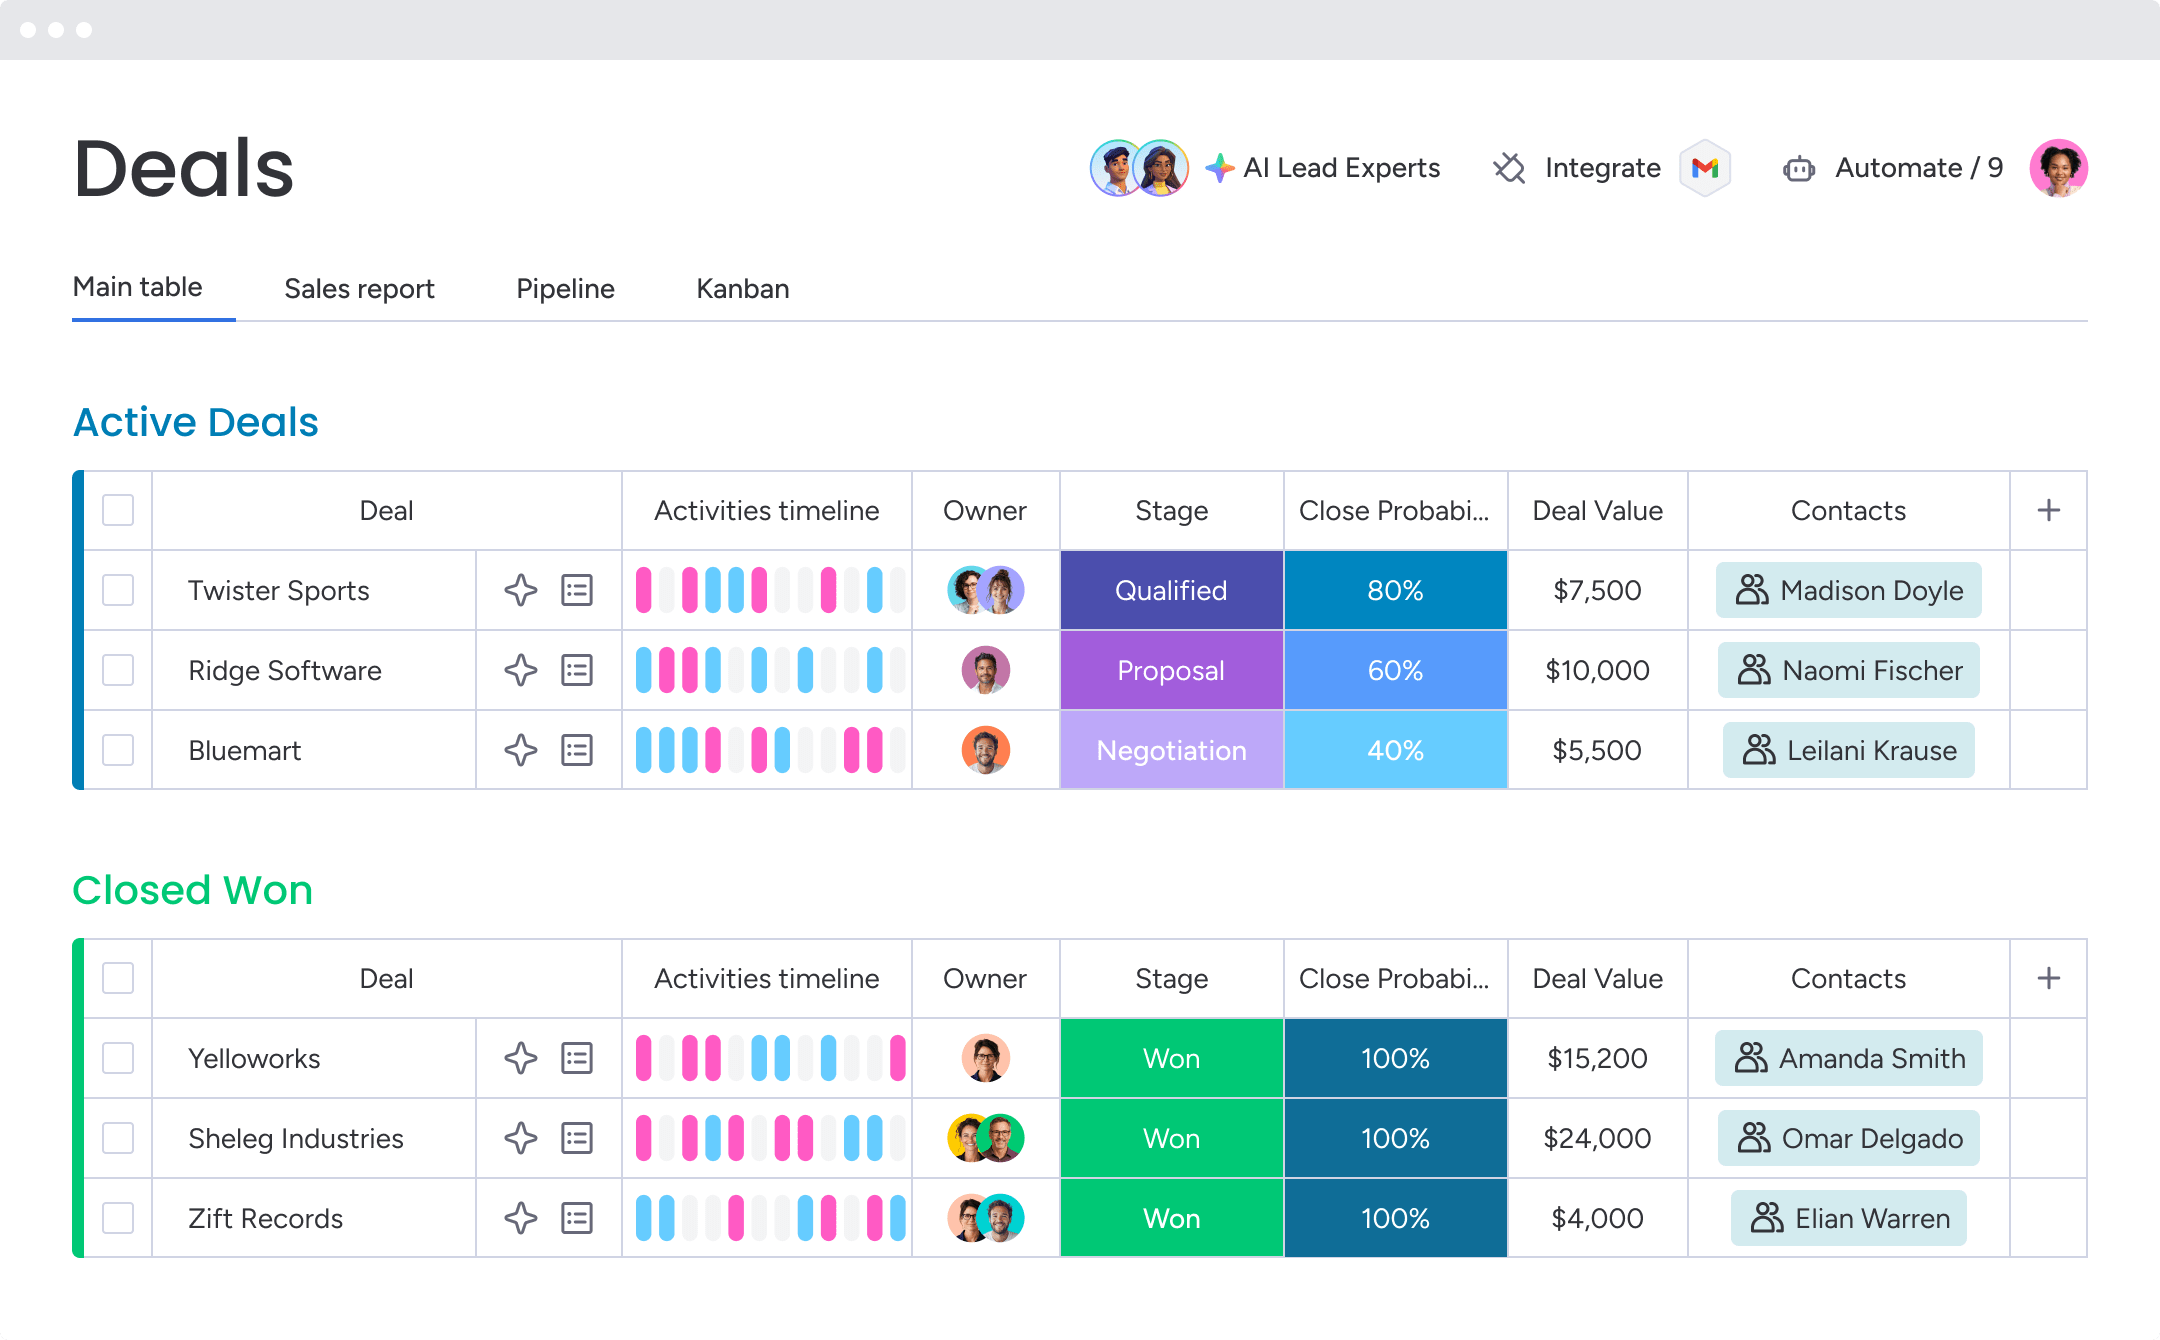
1. Sales pipeline dashboard template
A pipeline dashboard shows every deal’s journey from first contact to closed sale. You see exactly where deals are, which ones are stuck, and which opportunities are most likely to close.
Most pipeline dashboards organize deals by stage (like “Qualified” or “Proposal Sent”) and show the total value at each step. This visual approach helps you allocate resources and predict revenue with confidence.
Deal stage visualization
Visual tools like funnel charts or kanban boards make complex data simple to understand, which is essential for managing your sales funnel.
Color coding adds another layer of insight. Red might show stalled deals, while green indicates healthy progress. This instant visual feedback helps teams prioritize their efforts where they’ll have the most impact.
Pipeline velocity tracking
Pipeline velocity measures how fast deals move through your sales process. Faster velocity means shorter sales cycles and quicker revenue.
By tracking velocity, you can identify which stages slow deals down. Maybe proposals take too long to generate, or negotiations drag on unnecessarily. Once you know where the delays happen, you can fix them.
Bottleneck identification
Bottlenecks are the spots where deals get stuck. Your dashboard should highlight these problem areas automatically, but a pipeline report can further clarify where the bottlenecks occur.
monday CRM’s pipeline dashboards highlight bottlenecks and suggest improvements based on your data patterns, so you can solve problems before they impact revenue.
2. Sales performance dashboard template
Performance dashboards focus on results, not just activities. They show you who’s hitting their numbers, who needs help, and what strategies work best.
These dashboards are essential for fair performance reviews and smart territory planning. They take the guesswork out of managing your team.
Individual rep scorecards
Scorecards give each rep a clear view of their performance against goals. Key metrics typically include:
- Revenue generated: How much they’ve brought in this period
- Deals closed: Number of successful sales completed
- Quota attainment: Percentage of their target achieved
- Win rate: How often they convert opportunities to sales
This transparency motivates improvement and celebrates success equally, especially since employees who understand how their success is measured are 2x more likely to feel motivated.
Team achievement metrics
Team metrics show collective performance and help identify patterns across your entire sales organization. You might track total team revenue, average deal sizes, or overall conversion rates.
Comparing teams or time periods reveals best practices worth sharing. It also highlights systemic issues that need leadership attention.
Performance trend analysis
Trends tell you where things are heading. Are your win rates improving? Is average deal size growing? These patterns help you forecast future performance and make strategic decisions.
Historical sales analysis also validates whether new strategies are working. You can see the impact of training programs, process changes, or new territories over time.
3. Sales activity dashboard template
Activity dashboards track the daily actions that eventually lead to closed deals. They help you understand the relationship between effort and results.
Activity alone doesn’t guarantee success. Tracking key activities helps your team maintain the consistent effort needed for long-term wins.
Call and email volume tracking
Volume metrics show outreach levels across your team. But quantity isn’t everything. You also need to track:
- Response rates: How often prospects engage back
- Conversion to meetings: Which outreach turns into conversations
- Time of day patterns: When you get the best responses
This balanced view prevents mindless activity and encourages strategic outreach.
Meeting conversion rates
Meeting conversion shows how well your team turns conversations into next steps. High conversion rates indicate strong discovery skills and compelling presentations.
Low rates might mean you need better qualification processes or meeting preparation. The data points you toward specific improvements.
Activity-to-outcome correlation
Which activities actually drive revenue? This analysis connects daily work to final results, helping teams focus on what matters most.
Just remember that correlation doesn’t equal causation. Combine data insights with feedback from successful reps to get the full picture.
4. Revenue dashboard template
Revenue dashboards give executives the financial view they need for strategic decisions. These templates track the money metrics that matter most to business growth.
Revenue by product line
Product-specific tracking reveals which offerings drive the most value. This insight shapes everything from inventory planning to sales team focus.
You can quickly identify star performers and underachievers. Then double down on winners while fixing or retiring weak products.
Monthly recurring revenue growth
MRR is the lifeblood of subscription businesses. It shows predictable income you can count on each month.
Tracking MRR growth helps with cash flow planning and investor conversations. You can see whether your business is accelerating or needs attention.
Customer lifetime value metrics
CLV tells you how much revenue to expect from each customer relationship over time. Higher CLV justifies spending more to acquire and retain customers.
This metric guides pricing strategies and helps prioritize customer segments. Focus on the customers who bring the most long-term value.
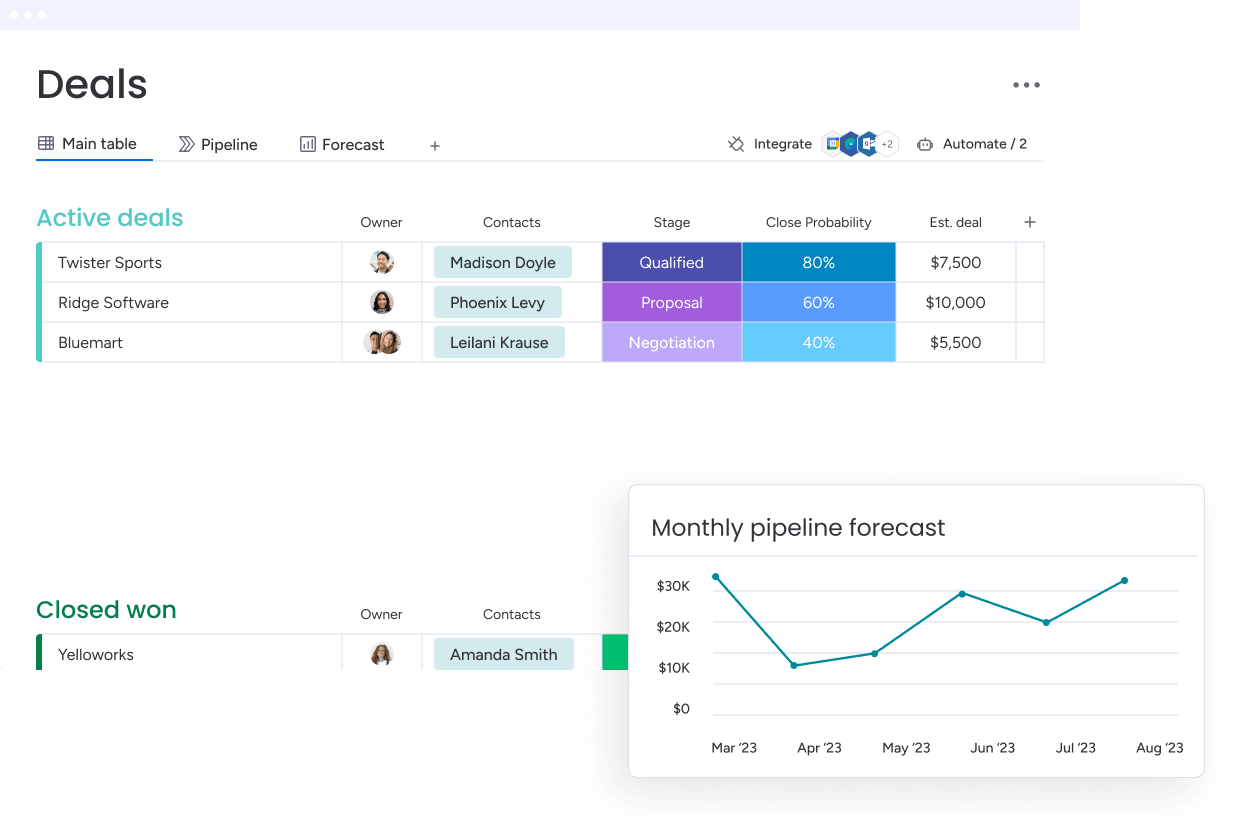
5. Sales forecasting dashboard template
Forecasting dashboards predict future performance using current data and historical patterns. They turn guesswork into data-driven planning.
Accurate forecasts support smarter hiring, budgeting, and resource allocation decisions across the business.
AI-driven pipeline predictions
AI analyzes your historical deals to predict which current opportunities will likely close. monday CRM’s AI considers deal size, stage duration, and customer patterns to generate probability scores.
These predictions help reps focus on winnable deals while flagging those that need extra attention.
Quota attainment projections
Will your team hit their targets? Quota projections show you early whether you’re on track or falling behind.
Early warning gives you time to course-correct. Add resources, adjust territories, or implement incentive programs before it’s too late.
Win rate analysis
Win rates reveal what percentage of your opportunities turn into closed deals. Tracking this metric across different segments shows where you’re most successful.
Use win rate insights to replicate successful approaches and fix areas with low conversion.
6. Lead generation dashboard template
Lead dashboards bridge marketing and sales efforts. They track how prospects enter your funnel and progress toward becoming opportunities.
Effective lead analytics ensures marketing generates quality prospects while sales follows up appropriately.
Lead source performance
Which channels bring your best leads? Source analysis might reveal:
- Social media: Generates high volume but lower quality
- Referrals: Fewer leads but much higher conversion
- Content marketing: Steady flow of educated prospects
- Events: High-cost but high-value connections
This data guides marketing spend and sales preparation strategies.
Conversion funnel metrics
Funnels show how leads progress from initial interest to sales opportunity. You can see exactly where prospects drop off and optimize those weak points.
Small improvements in conversion rates compound into significant revenue gains over time.
Lead scoring analytics
Lead scoring ranks prospects by their likelihood to buy. Higher scores get immediate attention while lower scores might need nurturing first.
Effective scoring combines demographic data (company size, industry) with behavioral signals (email opens, content downloads). This comprehensive view helps sales teams prioritize perfectly.
7. Sales manager dashboard template
Manager dashboards provide the oversight needed for effective team leadership. They balance high-level metrics with individual performance details.
These templates support both strategic planning and daily coaching activities.
Team productivity overview
Productivity metrics show how efficiently your team converts effort into results. Look beyond just activity counts to understand true productivity.
Key indicators include deals per rep, revenue per activity, and sales cycle efficiency. These reveal where process improvements would have the biggest impact.
Individual coaching metrics
Data-driven coaching focuses development where it matters most. Your dashboard might track:
- Skill assessments: Where each rep excels or struggles
- Improvement trends: Whether coaching is working
- Specific behaviors: Call quality, email effectiveness, presentation skills
This objective approach makes coaching conversations more productive and less personal.
Territory performance analysis
Territory analysis shows sales results across different regions or market segments. You might discover that certain territories consistently outperform others.
These insights guide resource allocation and expansion planning. Invest more in successful territories while fixing underperformers.
8. Executive sales dashboard template
Executive dashboards provide the strategic view needed for company-wide decisions. They focus on trends and comparisons rather than operational details.
Company-wide revenue trends
Revenue trends show your business trajectory over time. Are you growing, plateauing, or declining? These patterns inform major strategic decisions.
Executives use trend data for investor communications, board meetings, and long-term planning.
Market share analytics
How do you stack up against competitors? Market share analysis provides crucial context for your sales results.
Understanding your position helps shape pricing, product development, and competitive strategies.
Strategic initiative tracking
Major sales initiatives need executive oversight. Track progress on key programs to ensure they deliver expected results.
This visibility helps executives identify successful initiatives to expand and struggling programs that need intervention.
9. Sales rep dashboard template
Individual rep dashboards empower salespeople to manage their own success. They provide personal metrics and guidance for daily priorities.
Personal performance metrics
Reps need clear visibility into their own numbers. Personal dashboards typically show:
- Current pipeline value: Total potential revenue in play
- Deals by stage: Where opportunities stand
- Activity metrics: Calls, emails, meetings completed
- Progress to quota: How close they are to targets
Commission tracking
Transparent commission tracking motivates reps by showing exactly what they’ve earned. Real-time calculations help them understand which deals to prioritize for maximum earnings.
Clear commission visibility also reduces disputes and confusion around compensation.
Next best actions
AI-powered recommendations suggest which leads to call, which deals need attention, and what activities will drive the best results.
monday CRM’s intelligent suggestions help reps make smart decisions about where to focus their limited time.
10. Customer success dashboard template
Customer success dashboards focus on keeping and growing existing accounts. They’re essential for businesses that rely on recurring revenue.
Retention rate monitoring
Retention rates show what percentage of customers stay with you over time, which is why customer tracking is essential to identify churn risks early. High retention indicates strong product-market fit and customer satisfaction.
Monitoring retention by segment reveals which customer types are most successful with your solution.
Upsell opportunity tracking
Existing customers often represent your best growth opportunities. Upsell tracking identifies accounts ready for expansion based on:
- Usage patterns: Heavy users who might need more capacity
- Account growth: Companies that have expanded since signing
- Feature adoption: Customers using basic features who could benefit from advanced ones
These warm opportunities typically close faster than new business.
Customer health scores
Health scores predict which accounts might churn or expand. They combine usage data, support tickets, and engagement metrics into a single indicator.
Proactive monitoring lets you intervene before problems escalate or capitalize on growth opportunities quickly.
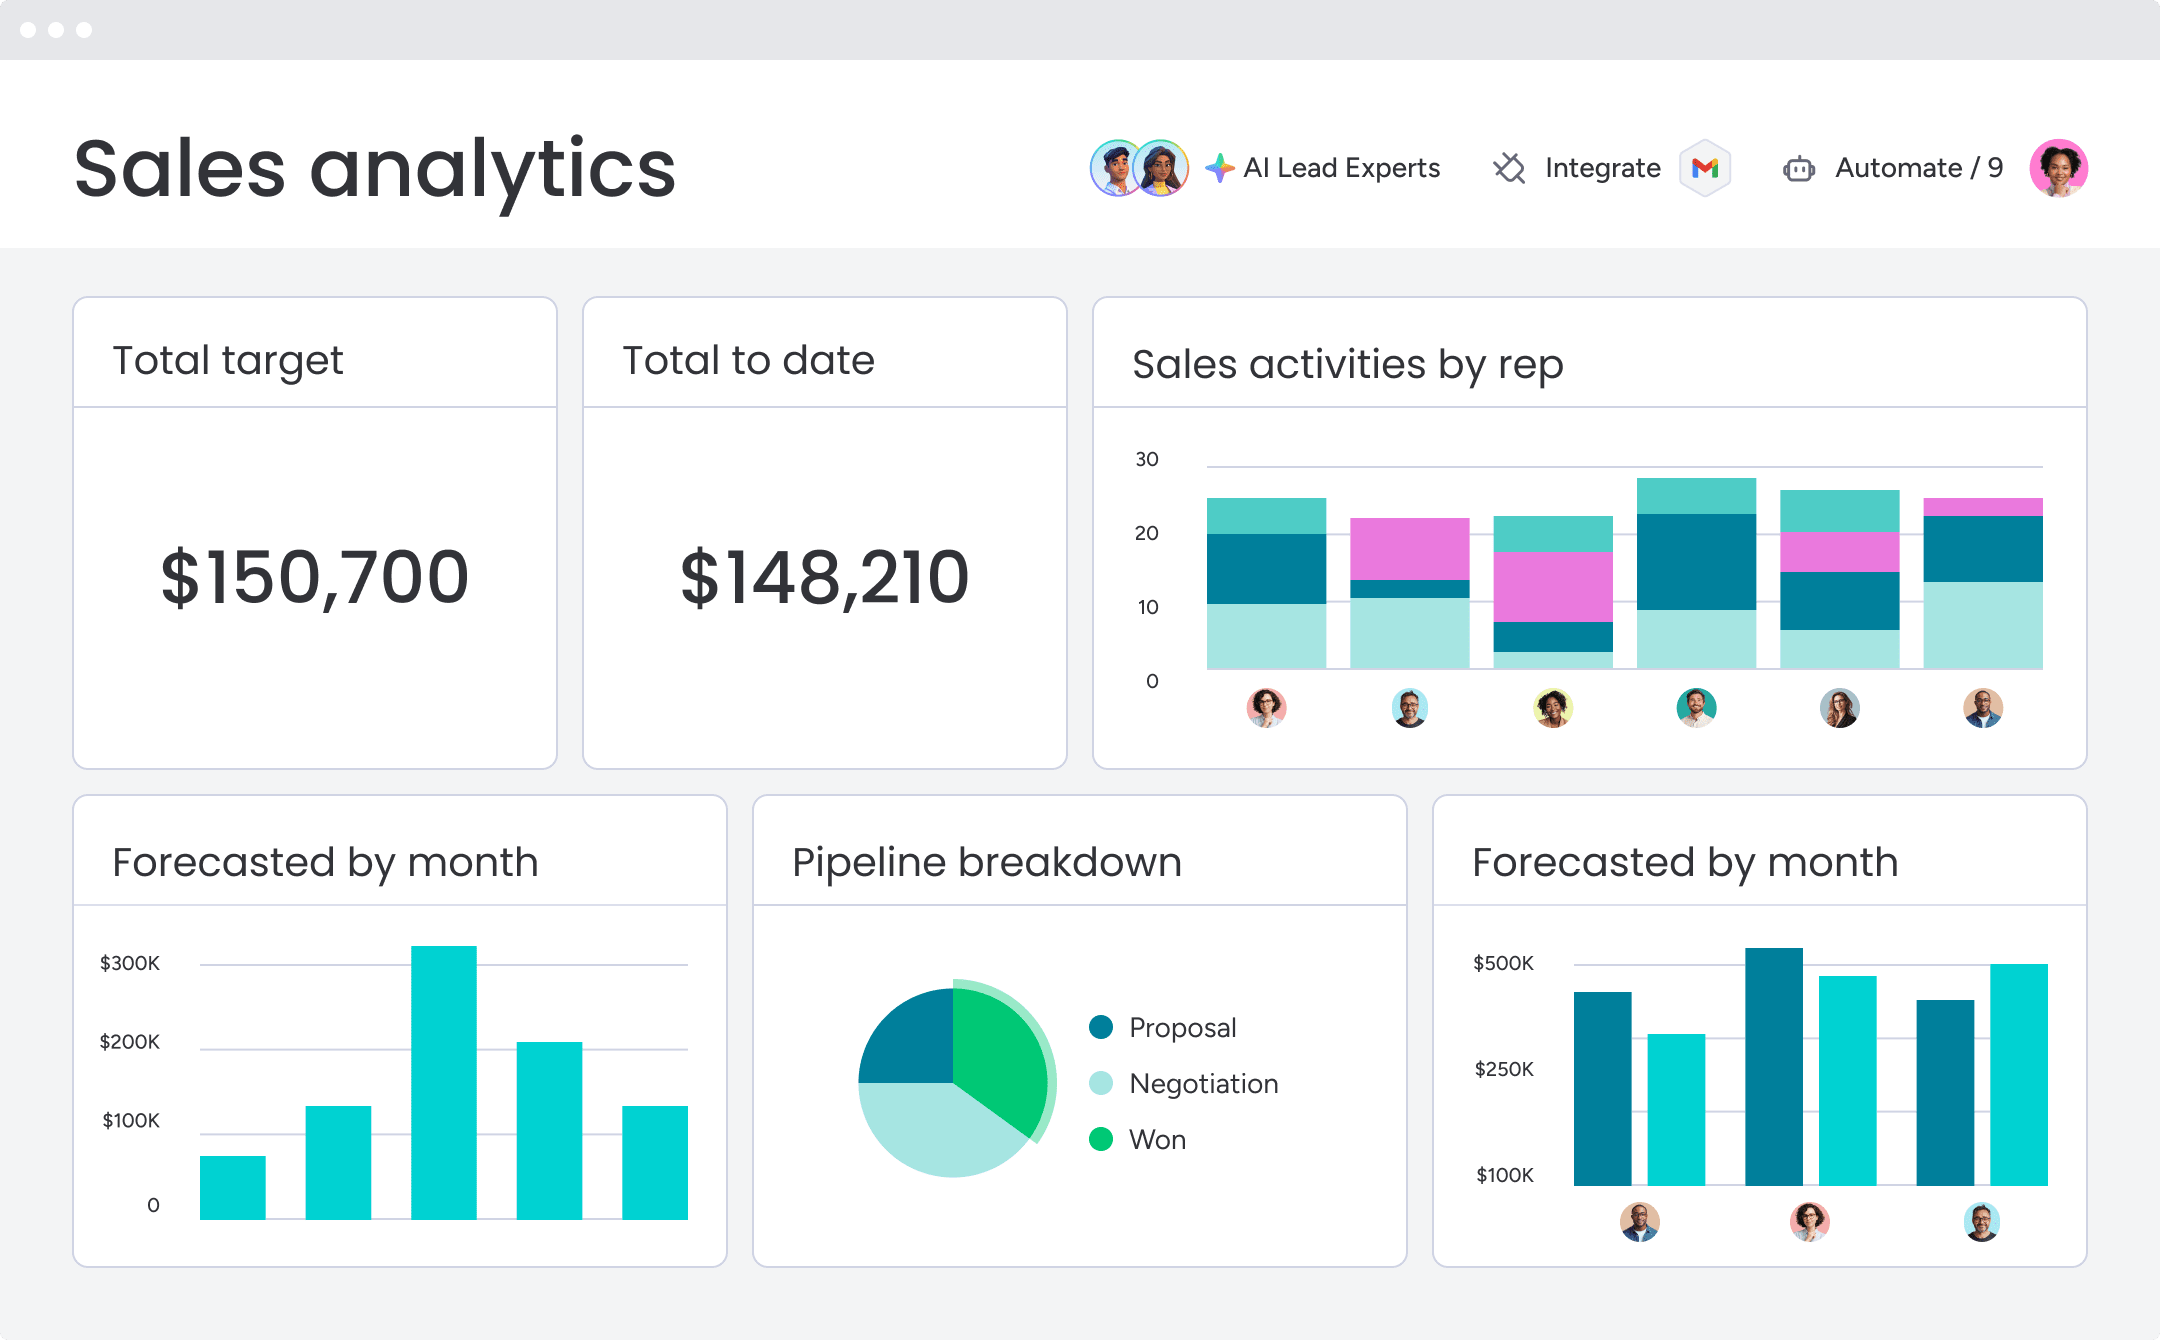
11. AI-powered sales analytics dashboard template
AI transforms traditional dashboards from reporting tools into prediction engines, yet with only 51% of sales professionals currently using AI, according to monday’s world of work report, there’s a major opportunity for teams that adopt it. These templates use machine learning to surface insights humans might miss.
Predictive lead scoring
AI examines thousands of data points to score leads more accurately than rule-based systems. The models improve continuously as they process more data.
This dynamic scoring adapts to market changes and evolving customer behaviors automatically.
Automated insight generation
Instead of manually analyzing data, AI surfaces important patterns and anomalies automatically using advanced sales analytics. You might discover that deals with certain characteristics close faster or that specific industries have higher win rates.
These insights save hours of analysis time while uncovering opportunities for improvement.
Anomaly detection
AI flags unusual patterns that deserve attention. Maybe a top performer’s activity suddenly dropped, or a neglected territory is showing unexpected growth.
Early detection of anomalies helps you address problems quickly and capitalize on emerging opportunities.
Build custom sales dashboards with monday CRM
monday CRM makes these dashboard templates easy to implement without technical expertise. The platform combines powerful features with intuitive design for fast results.
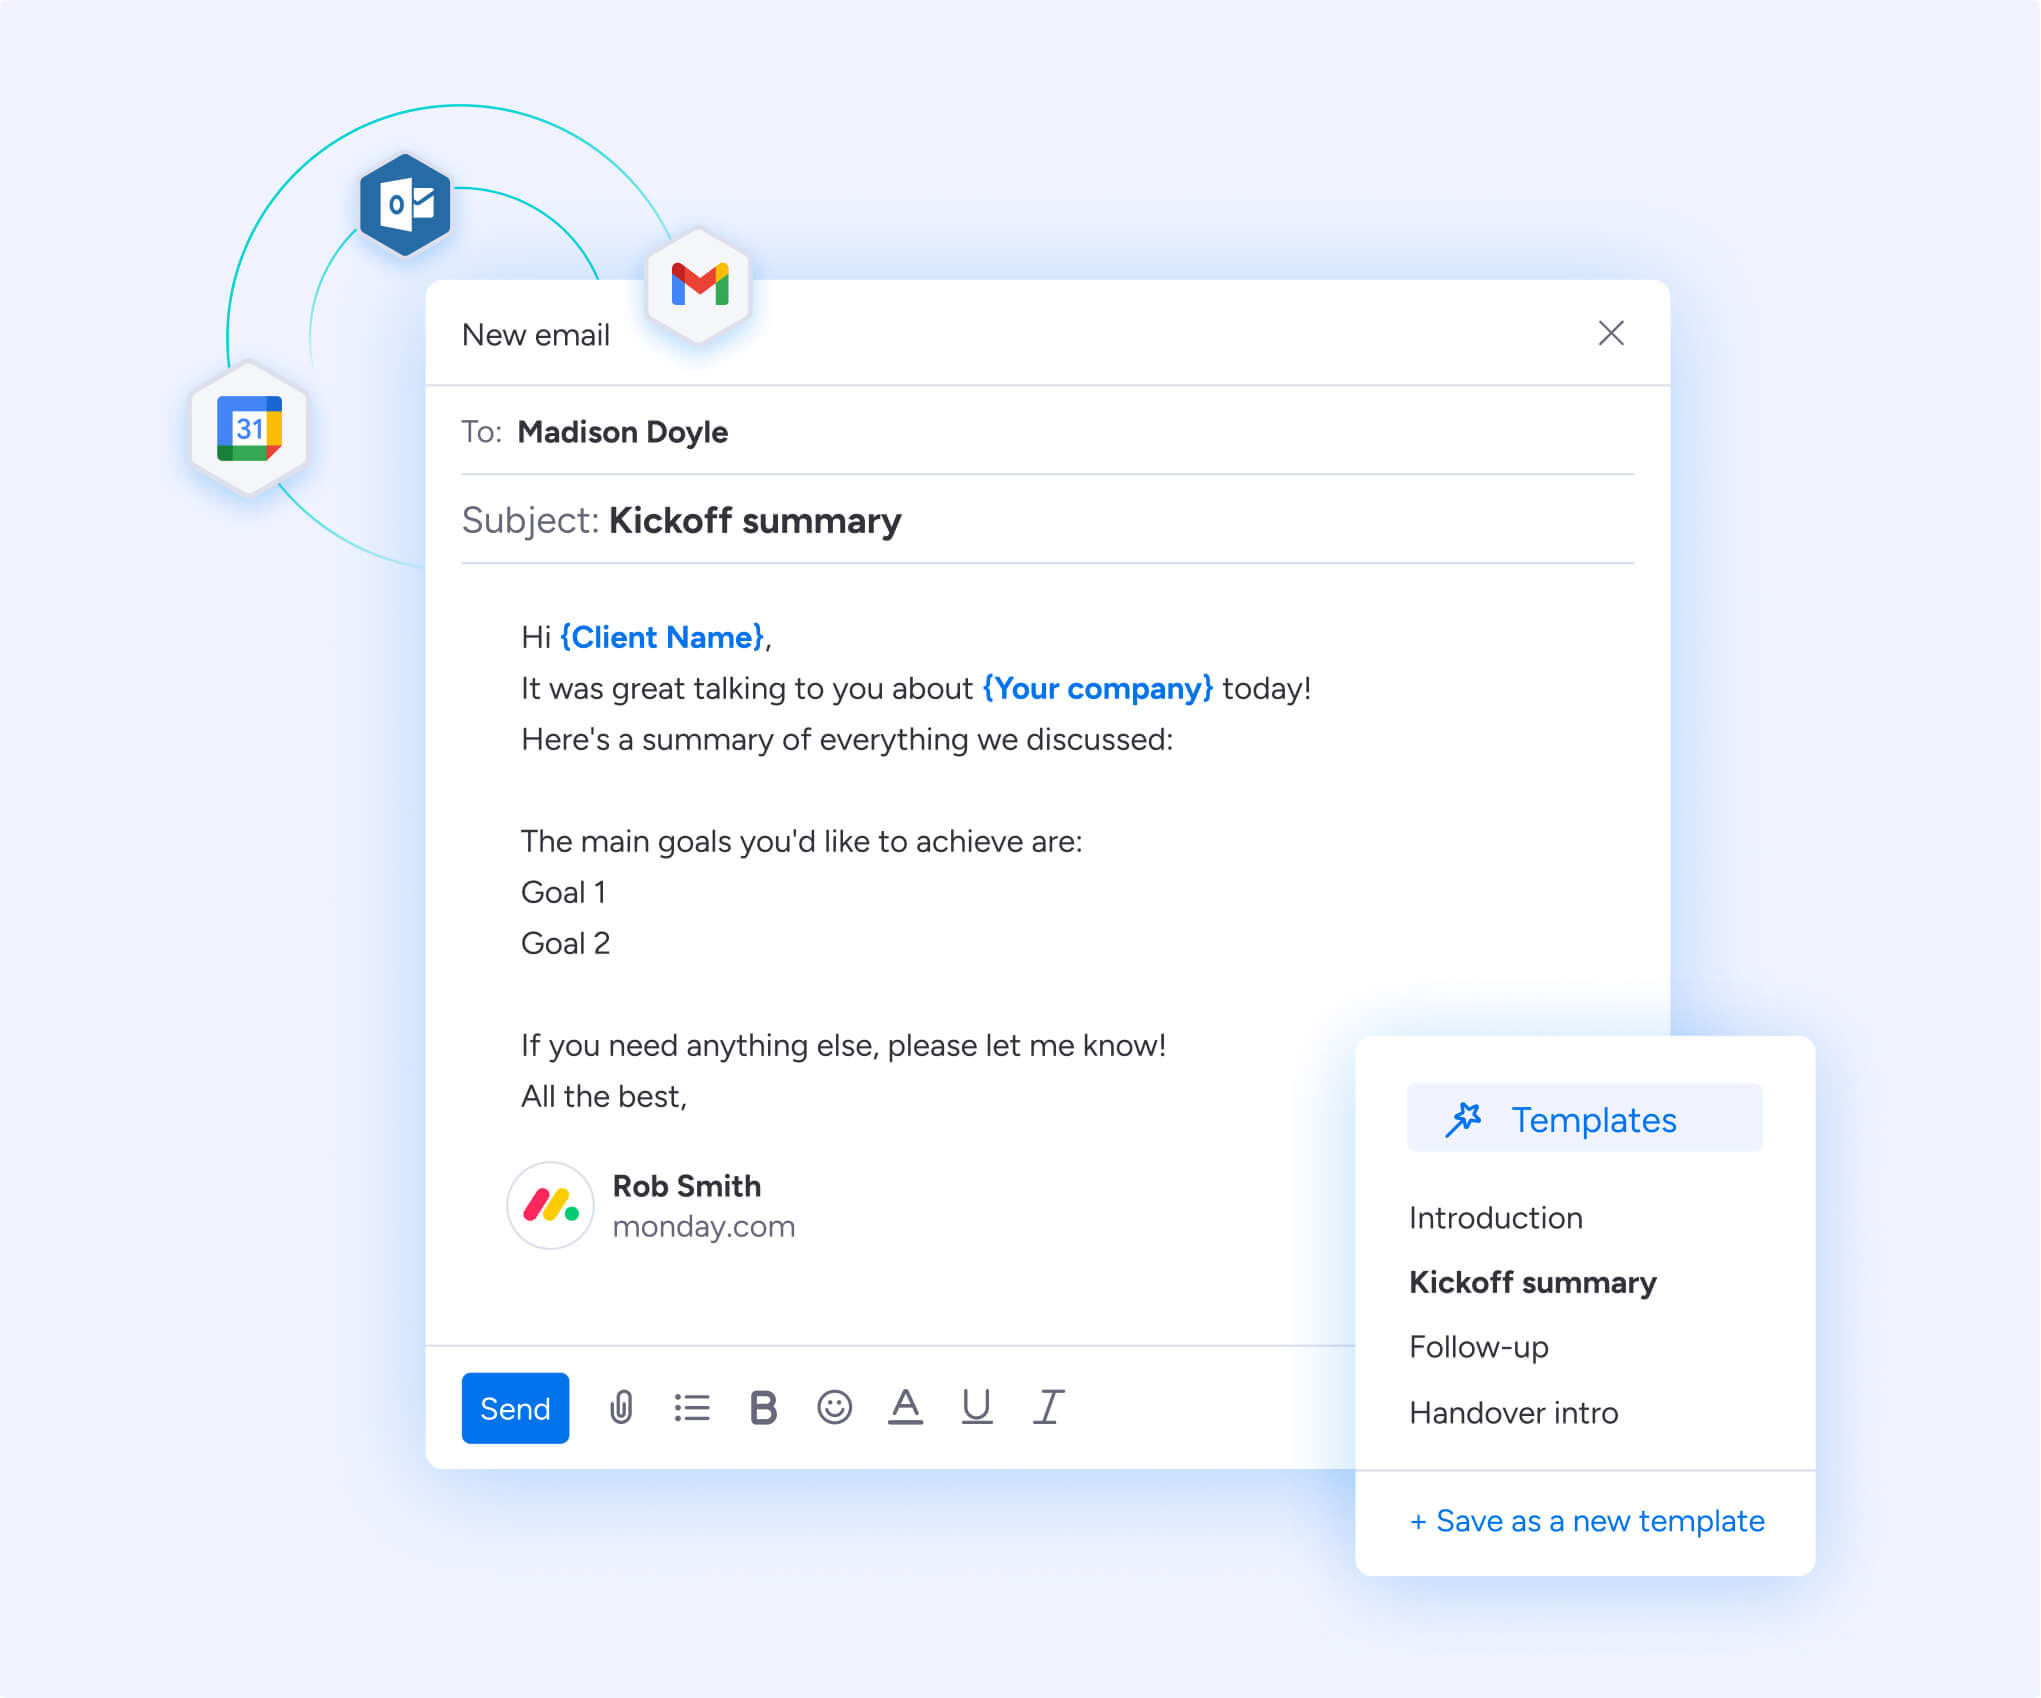
No-code dashboard builder
Create professional dashboards using simple drag-and-drop tools. No coding, no IT tickets, no waiting.
You can start with templates and customize them to match your exact needs. As your business evolves, adapt your dashboards just as easily.
AI blocks for sales intelligence
Add AI capabilities to any dashboard with monday CRM’s AI blocks. These include:
- Predictive scoring: Identify your hottest leads automatically
- Sentiment analysis: Understand customer emotions from communications
- Automated summaries: Get instant insights from long conversations
- Smart recommendations: Receive AI-powered next best actions
The modular approach lets you add AI features gradually as your team gets comfortable.
Native CRM data integration
All your sales data connects automatically within monday CRM. No complex integrations or manual data entry required.
This native connection ensures your dashboards always show current, accurate information across all your sales processes.
Transform your sales reporting today with monday CRM
The right sales dashboard templates give your team real-time visibility, AI-driven insights, and mobile access that support faster decisions and better results.
Stop wrestling with spreadsheets and start working from a clear view of your pipeline. With monday CRM’s intuitive platform, you can implement these templates quickly, keep metrics current, and make sales reporting more accurate than ever.
Try monday CRM and see how powerful sales dashboards can accelerate your revenue growth.
Try monday CRMFAQs
How quickly can I set up sales dashboard templates in monday CRM?
Most teams can set up sales dashboard templates in monday CRM in a few hours. You can start from pre-built templates, customize them with drag-and-drop widgets, and begin tracking key metrics the same day.
What's the difference between a sales dashboard and a sales report?
A sales dashboard shows live data that updates automatically as your pipeline changes. A sales report is a static snapshot created at a specific point in time.
Which KPIs should small sales teams track on their dashboards?
Small sales teams should focus on total pipeline value, conversion rates between stages, average deal size, and sales cycle length. These KPIs provide a clear view of performance without overwhelming the team.
Can monday CRM dashboards integrate with my existing sales tools?
Yes. monday CRM dashboards pull in data from connected tools through native integrations and APIs, so you can combine email, calling, and other sales activity data in one place.
How do I get my sales team to use the dashboard templates?
To drive dashboard adoption, involve your team in choosing the metrics, show how dashboards make their work easier, and review dashboards in regular team meetings. Role-based views and mobile access also help dashboards become part of daily routines.
Do I need technical skills to customize sales dashboard templates?
No. monday CRM uses visual, no-code tools, so anyone can create and update dashboards with drag-and-drop components and simple configuration options.