
Your sales team reviews the pipeline every week, but can you confidently say which deals will actually close this quarter? Sales pipeline reports give you clarity by showing exactly where every deal stands in your process — including stage progression, deal value, and movement patterns that reveal true pipeline health.
This guide shows you how to build pipeline reports your team will actually use. You’ll discover 9 essential metrics that drive action, explore 10 practical report examples that answer your biggest questions, and learn how visual dashboards create the real-time visibility that transforms sales execution.
Try monday CRMKey takeaways
- Focus on visual dashboards over spreadsheets and use color-coded stages and interactive charts to help spot pipeline problems instantly instead of hunting through rows of data.
- Track pipeline coverage ratio as your north star metric, aiming for 3:1 pipeline value to revenue target.
- Create role-specific views for higher adoption — sales reps need personal pipeline priorities while managers need team overviews, as one-size-fits-all reports serve nobody well.
- Identify stuck deals before they become lost deals by flagging opportunities that haven’t moved within expected timeframes.
- Build real-time visibility with monday CRM’s automated sales tracking, including live dashboards that update as deals move, giving you current data for immediate intervention.
What is a sales pipeline report?
A sales pipeline report is a visual snapshot of where all your deals stand in your sales process right now. Think of it as your sales team’s mission control: you see deal values, which stage each opportunity sits in, and how deals move from first contact to closed-won. Revenue teams rely on pipeline reports to spot which opportunities are progressing smoothly, which ones need attention, and whether the overall pipeline has enough coverage to hit targets.
The good news is that visual dashboards have replaced spreadsheet gymnastics. Automated reporting systems deliver actionable reports instantly, eliminating the need for complex formulas or manual updates to understand pipeline health. Revenue teams of any size can now see real-time pipeline insights through dashboards that show what matters, automatically.
Pipeline reports vs. sales forecasts
Pipeline reports and sales forecasts serve different purposes, though many teams confuse them. Here’s how they’re different:
| Aspect | Pipeline reports | Sales forecasts |
|---|---|---|
| Purpose | Show current deal status and pipeline health | Predict future revenue outcomes |
| Timeframe | Real-time snapshot of today's pipeline | Project 30–90+ days ahead |
| Data type | All open opportunities with current values | Weighted probabilities and expected close dates |
| Primary users | Sales managers and reps for daily decisions | Executives and finance teams for planning |
They work together. You need both. Accurate pipeline reports lead to reliable forecasts. You can’t predict future revenue without knowing what’s in your pipeline right now. Many CRM platforms integrate both views, but this article focuses specifically on pipeline reporting and the reports that drive daily sales execution.
Real-time visibility vs. static snapshots
Pipeline reports used to be static snapshots. Think exported spreadsheets, weekly email updates, or monthly presentations. They showed what was true at one moment — usually outdated by the time anyone looked at them.
- Static snapshots require someone to manually compile and distribute data, typically weekly or monthly. By the time a static report is reviewed, the pipeline has already changed.
- Real-time visibility reflects current deal status as changes happen. When a rep logs an activity, updates a deal stage, or adds a new opportunity, the pipeline report updates automatically. Managers access current data on-demand from any device, seeing live deal movement without waiting for the next report cycle.
Real-time visibility lets managers intervene the moment deals stall. Plus, your team can spend more time on what works instead of hoping for the best, which is critical when employees who understand how their success is measured are 2x as likely to feel motivated.
What makes a good sales pipeline report?
The difference between useful pipeline reports and those that gather dust comes down to design intent. Good reports drive action, not just display data. They’re built for how sales teams actually work: mobile, visual, and role-specific.
What sets useful pipeline reports apart from dashboards that just look pretty is visual design, role-based views, and mobile accessibility. Let’s take a deeper look at each.

Visual dashboards beat complex spreadsheets
Sales managers need to spot patterns and problems fast. Visual dashboards work because your brain processes images faster than rows of numbers.
The best pipeline dashboards include these elements:
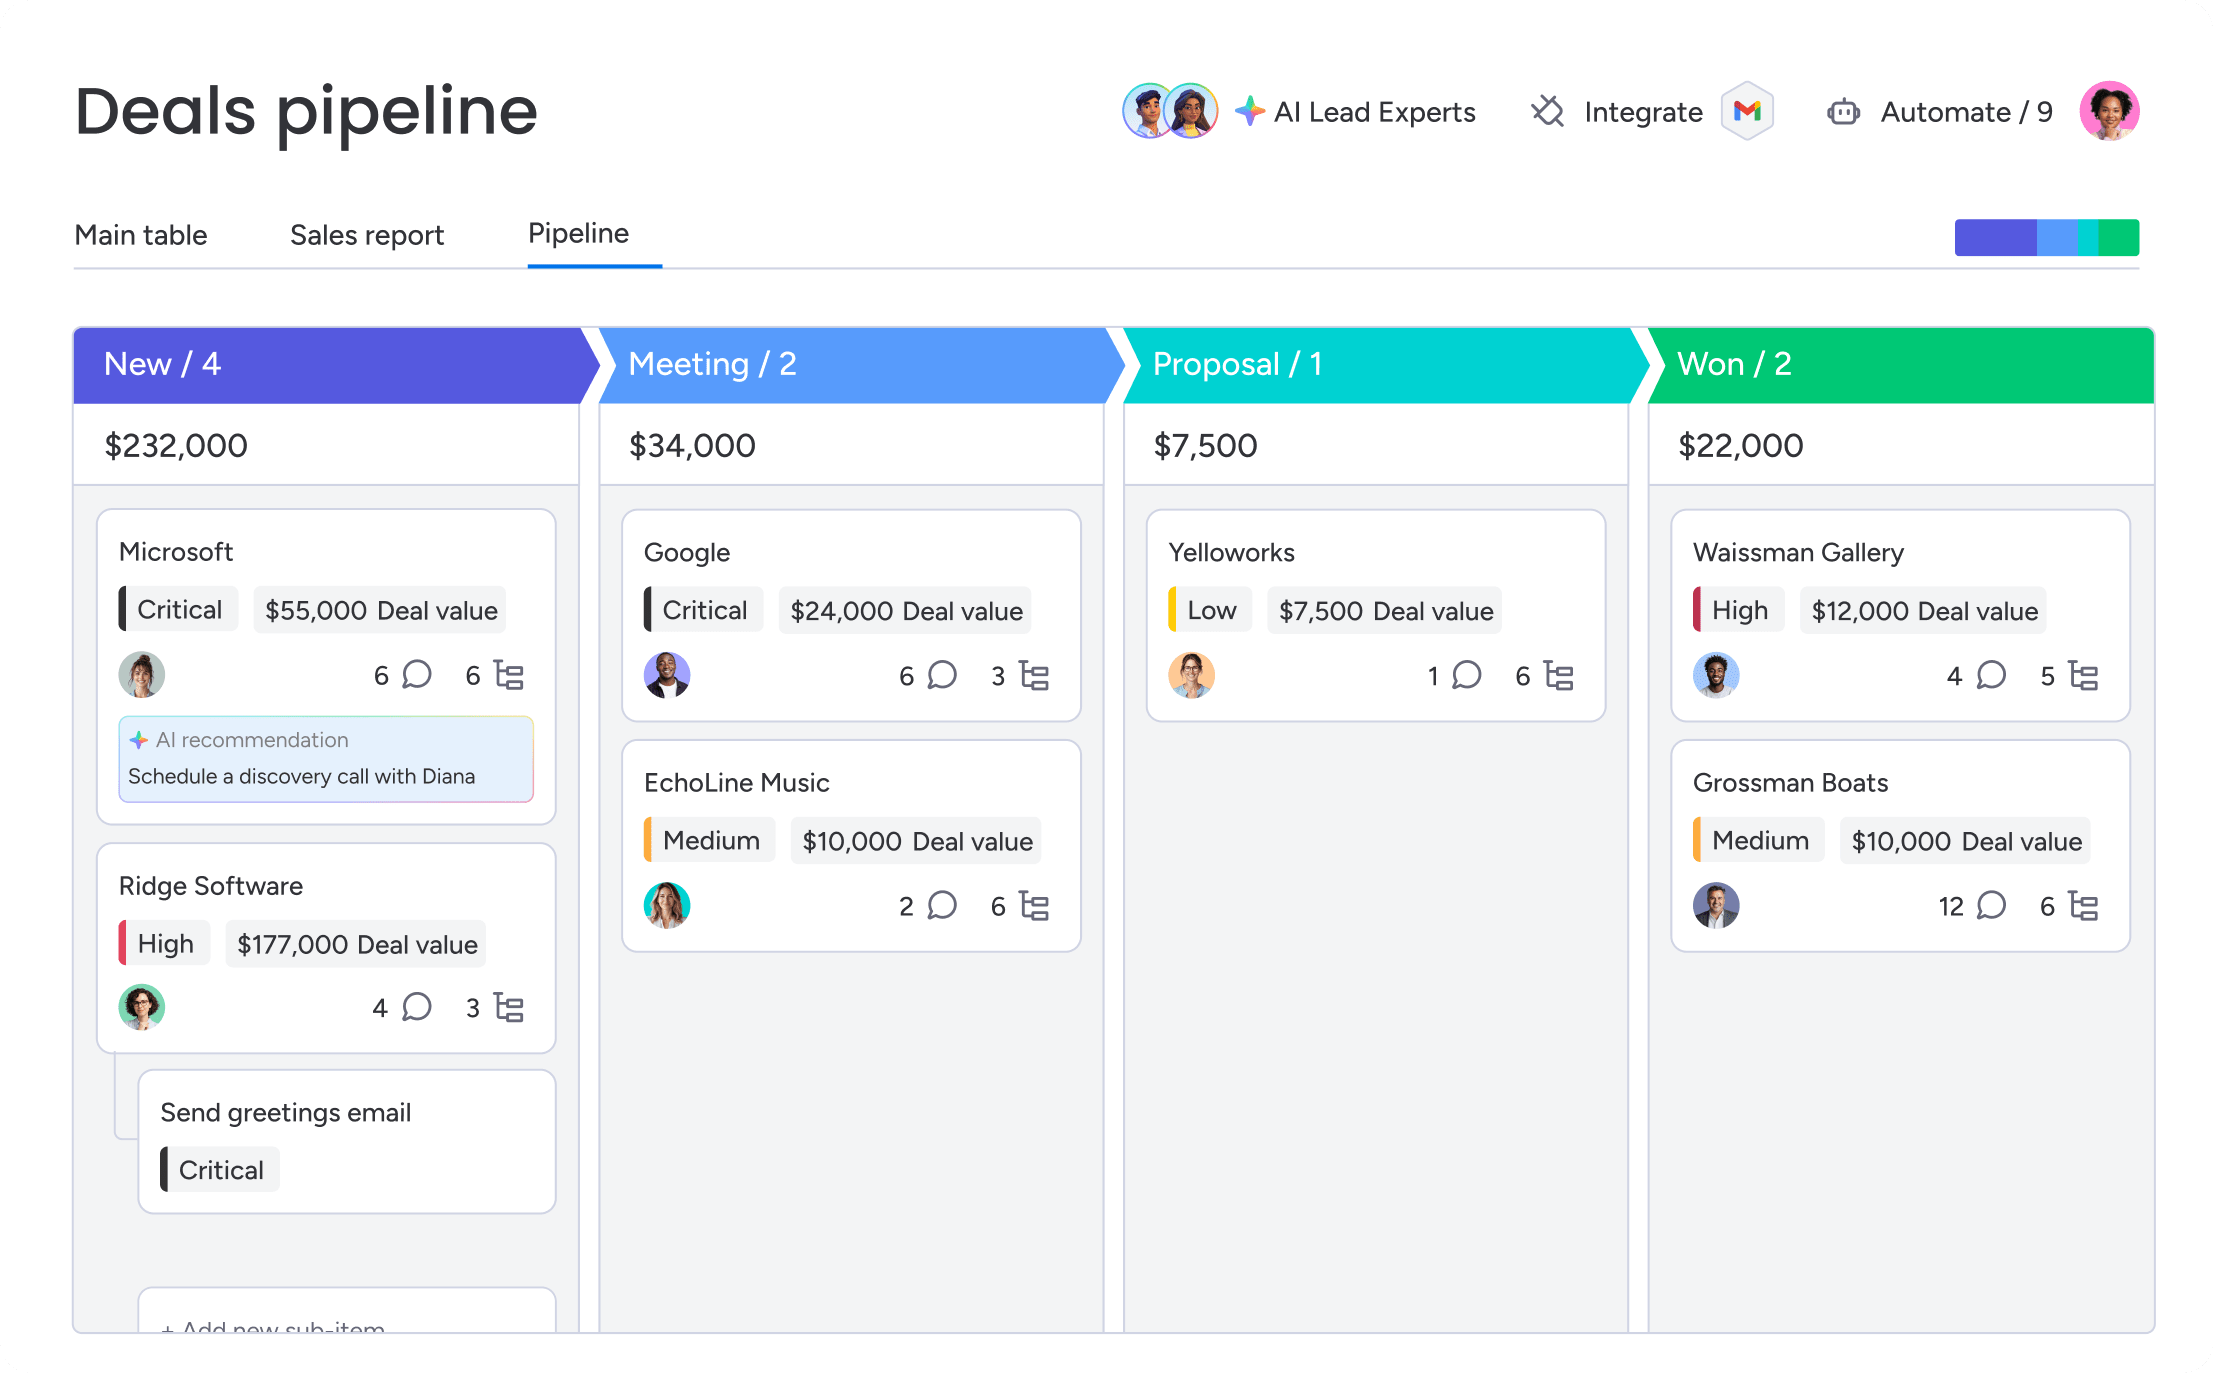
- Color-coded deal stages: Green shows healthy deal progression, yellow signals attention needed, and red flags at-risk deals
- Progress bars and gauges: Quick assessment of quota attainment and pipeline coverage through visual indicators
- Trend charts: Pipeline growth or contraction over time becomes obvious at a glance
- Interactive deal cards: Move deals between stages, click for details, and take action without opening multiple tabs
Spreadsheets bury these patterns. Spotting that 40% of your pipeline is stuck in the proposal stage requires scanning hundreds of rows and doing mental math. A visual dashboard shows this immediately through a simple bar chart or stage distribution view. Revenue teams using monday CRM leverage the sales pipeline widget and funnel widget to get exactly this kind of visual intelligence, seeing pipeline strengths and weaknesses instantly.
Role-based views ensure clarity
Good pipeline reports show different information depending on who’s looking. A sales rep needs different data than a VP of Sales. Tailored reports ensure every team member gets the exact information they need.
| Role | What they need | Primary question |
|---|---|---|
| Sales reps | Personal pipeline, next actions, deal age, follow-ups, quota progress | “What do I need to do today?” |
| Sales managers | Team overview, rep comparisons, deals needing intervention, stage conversion rates | “Where should I coach and what’s at risk?” |
| Revenue leaders | Pipeline coverage, forecast accuracy, velocity across teams/regions, year-over-year trends | “Will we hit our number?” |
Leading platforms achieve these role-based views through custom dashboards and permissions, ensuring everyone works from the same source of truth while seeing information relevant to their responsibilities.
Mobile-ready reports support field sales teams
Sales doesn’t happen at a desk. Pipeline reports need to work on mobile — really work, not just technically load. Mobile-ready pipeline reports include:
- Responsive design: Automatic adjustment to screen size without horizontal scrolling or tiny text
- Touch-friendly interactions: Tap to drill down into deal details, swipe to navigate between views
- Offline access: View cached pipeline data even without connectivity
- Quick updates: Log activities and update deal stages directly from mobile view
Reps check pipeline between meetings. Managers review deals while traveling. Requiring desktop access slows decisions and disconnects your pipeline from the moments that matter. Teams stay connected to their pipeline through monday CRM’s dedicated mobile experience, keeping pipeline information available wherever work happens.
Try monday CRM9 essential sales pipeline metrics to track
Your pipeline reports are only useful if you’re tracking the right sales metrics. These 9 metrics provide comprehensive pipeline health visibility, from high-level coverage ratios to granular deal-level indicators that signal risk.

1. Pipeline coverage ratio
Pipeline coverage ratio is the total pipeline value divided by the revenue target for a given period. Most teams aim for 3:1 coverage. That’s $3 in pipeline for every $1 of quota — because not all deals close.
Example calculation:
- Q1 revenue target: $500,000
- Current pipeline value: $1,500,000
- Coverage ratio: 3:1
Coverage below 2:1 signals risk, meaning there simply aren’t enough opportunities to hit targets even with strong close rates. Coverage greater than 5:1 might mean poor qualification or inflated deal values.
2. Average deal size by stage
This metric tracks how deal values change as opportunities progress through pipeline stages. It’s the average value of all deals in each stage.
- Values increase through stages: This indicates good discovery and expansion selling. Document and replicate this approach across your team.
- Values decrease through stages: This signals over-optimistic early estimates. Focus on improving initial qualification to set realistic deal values from the start.
- Dramatic drops at specific stages: This means scope clarification is happening too late in the process. Move scoping conversations earlier to avoid surprises.
Some decrease is normal as deals get refined, but big drops need attention.
3. Sales velocity score
Sales velocity measures the speed at which deals move through the pipeline. The formula:
(Number of Opportunities × Average Deal Value × Win Rate) ÷ Sales Cycle Length
Track how velocity changes over time, not just the raw numbers. Improving any of the 4 components increases velocity, but shortening sales cycles usually works fastest. It affects how fast improvements in other areas turn into revenue.
4. Stage conversion rates
Stage conversion rates measure the percentage of deals that successfully move from one pipeline stage to the next. Unlike overall win rate, this shows exactly where deals move forward or get stuck.
Low conversion at specific stages shows you where deals get stuck. A 30% conversion from Proposal to Negotiation suggests issues with proposal quality, pricing, or competitive positioning. Stage conversion rates tell you more than overall win rates because they show exactly where you’re losing deals.
5. Deal age and stuck opportunities

Deal age is the number of days an opportunity has been in the pipeline. Stuck opportunities are deals that haven’t moved to the next stage when they should have. Stuck deals rarely close — and they distort your pipeline. They eat up rep time, make your pipeline look healthier than it is, and usually mean deals you’ve already lost but haven’t marked closed yet.
6. Win rate by lead source
Win rate by lead source measures the percentage of closed-won deals segmented by where the lead originated, such as through inbound marketing, outbound prospecting, referrals, events, partnerships, and so on.
Some lead sources work better than others. This metric shows which sources generate the best opportunities, helping you decide where to spend marketing budget and focus prospecting. It also gives marketing and sales real data to talk about lead quality instead of arguing about it.
7. Pipeline value per rep
Pipeline value per rep is the total value of open opportunities assigned to each sales rep. This metric shows how pipeline is spread across your team and helps spot capacity issues, territory imbalances, or performance gaps.
A rep with $200,000 quarterly quota and 25% win rate needs approximately $800,000 in pipeline for reasonable confidence in hitting target. Really low pipeline might mean a rep needs help with prospecting. Really high pipeline might mean a rep can’t give each deal enough attention.

8. Quota attainment progress
Quota attainment progress is the percentage of quota achieved to date, tracked against the time elapsed in the period. A rep should hit roughly 50% of quota at the quarter’s midpoint, depending on sales cycle length.
This metric warns you about shortfalls early, so you can step in before the quarter ends. Waiting until month 3 to fix performance gaps leaves no time to turn things around.
9. At-risk deal indicators
At-risk indicators signal a deal might not close as expected, even if it looks like it’s moving through stages normally. Common risk factors include lack of stakeholder engagement, missing next steps, or competitive pressure. There can also be budget uncertainty, an extended timeline, or low activity volume.
AI-powered platforms like monday CRM can detect sentiment in communications and flag at-risk deals based on activity patterns. This shifts pipeline management from reactive to proactive.
Try monday CRM10 sales pipeline report examples that drive results
Once you know which metrics matter, the next step is building reports that surface them clearly. These 10 reports answer specific questions and help you take action.
- Weekly pipeline movement dashboard: This report tracks how pipeline value and deal count changed over the past week. It answers “Is our pipeline growing or shrinking?” and displays net pipeline change, new opportunities added, deals advanced, deals closed, and deals stalled or lost
- Stalled deal analysis report: This report identifies opportunities that haven’t progressed within expected timeframes. It answers “Which deals need immediate attention?” by segmenting deals by age bucket and highlighting those requiring intervention.
- Quarterly pipeline coverage view: This report assesses whether sufficient pipeline exists to hit quarterly revenue targets. It displays target revenue, current pipeline value, coverage ratio, weighted pipeline, and a gap analysis.
- Sales team performance leaderboard: This report compares individual rep performance across key pipeline metrics. It answers “Who’s performing well and who needs support?” Teams leverage monday CRM’s leaderboard widget to make this comparison visual and immediate.
- Deal velocity tracker: This report measures how quickly deals move from stage to stage. It answers “Where are deals moving fast or slow?” and helps identify bottlenecks while studying what top-velocity reps do differently.
- Win/loss pattern analysis: This report identifies common characteristics of won versus lost deals. It reveals your ideal customer profile and competitive positioning across dimensions like deal size, lead source, industry, and sales cycle length.
- Lead source attribution report: This report tracks pipeline value and closed revenue by lead origin. It answers “Which marketing and prospecting efforts generate the best opportunities?”
- Stage duration heatmap: This report visualizes how long deals spend in each pipeline stage using color coding to highlight problem areas. Heatmaps make patterns immediately obvious that would be hidden in tables of numbers.
- Forecast accuracy scorecard: This report measures how accurately the team predicts which deals will close. It tracks forecast vs. actual results, accuracy by rep, slipped deals, and surprise wins.
- Customer expansion pipeline tracker: This report tracks upsell, cross-sell, and renewal opportunities within the existing customer base. Existing customers typically have higher win rates and shorter sales cycles, making this pipeline segment critical to track.

How to build a sales pipeline report
Building effective pipeline reports doesn’t take technical expertise. You just need to think about what questions you need answered and what actions you want to take. These 5 steps show you how to create reports your team will actually use.
Step 1: Map your sales process stages
Good pipeline reports start with clear sales stages. Stages should focus on the buyer, not overlap, follow a sequence, and tell reps what to do. If reps use stages inconsistently, your pipeline reports mean nothing. If reps interpret stages differently, you can’t compare performance or forecast accurately.
Step 2: Identify your key metrics
Figure out which metrics matter most for your business. Start by identifying your primary challenge, then focus on metrics that solve those problems. Common challenges include missing revenue targets, long sales cycles, low win rates, forecast unreliability, and uneven team performance.
Step 3: Design role-appropriate views
Different roles need different views of the same data. Design views that answer each role’s main questions without burying them in details they don’t need.
Step 4: Set up automated data capture
Your pipeline reports are only as good as the data going into them. Automated data capture reduces manual entry burden and improves data quality. Automations can capture activity data and enforce required fields, while triggering reminders when deals lack required information. Automations can also flag deals that haven’t been updated within expected timeframes
Step 5: Establish review cadences
Reports that don’t get reviewed regularly just sit there looking pretty. Set up a regular review schedule, such as daily for personal pipeline priorities and monthly for forecast accuracy.
Example pipeline dashboard layout
- Top row: Pipeline coverage ratio | Quota attainment | Sales velocity
- Middle section: Stage distribution chart | Stalled deal list
- Bottom section: Rep leaderboard | Forecast gap analysis
How monday CRM transforms sales pipeline reporting
Instead of stitching together spreadsheets, BI tools, and CRM exports, teams build these reports directly inside their sales workflow. With monday CRM, you can turn pipeline reporting from a technical challenge into a strategic advantage. The platform combines visual dashboards, intelligent automation, and AI-powered insights to help revenue teams build reports that actually drive decisions — no dedicated analysts or complex configurations required.
Here’s how monday CRM helps teams build more effective pipeline reports:
- Visual pipeline widgets that update in real-time: The sales pipeline widget displays deals across stages with drag-and-drop functionality, automatically updating as your team moves opportunities forward.
- AI-powered deal risk detection: AI in monday CRM analyzes communication patterns, activity levels, and engagement signals to flag at-risk deals before they stall. The system detects sentiment shifts in emails, identifies deals with declining engagement, and alerts managers to opportunities that need intervention.
- Intelligent automation for data quality: Set up automations that alert managers when deals haven’t moved within expected timeframes, enforce required fields before stage progression, and trigger follow-up reminders based on deal age. These automations ensure your pipeline reports reflect accurate, current data.
- Funnel widgets that reveal conversion patterns: Track how deals flow through stages and identify exactly where conversion rates drop, revealing specific coaching opportunities. When you see 80% of deals advancing from Discovery to Demo but only 30% moving from Demo to Proposal, you know precisely where to focus training efforts and refine your sales process.
- Role-based dashboards with smart permissions: Build separate views for reps, managers, and executives using filters and permissions so everyone sees information relevant to their role. Reps get personal pipeline priorities and next actions, managers see team performance patterns and coaching opportunities, and executives access strategic metrics without individual deal noise.
- Automatic activity capture through integrations: Connect email, calendar, and communication tools to capture touchpoints without manual logging. Gain reliable data for identifying truly engaged prospects versus those going cold while AI analyzes these interactions to surface insights about deal health.
- Smart conditional formatting and alerts: Apply color coding based on deal age, value, close date, or AI risk scores to make urgent opportunities stand out immediately.Visual prioritization combined with AI recommendations helps managers scan dozens of deals and instantly identify the ones that need attention today.

Transform your pipeline management with actionable reports
Effective pipeline reports surface the metrics that matter most — pipeline coverage, velocity, conversion rates, and at-risk deals — so your team can act before problems impact revenue.
Using monday CRM, build these reports simply with drag-and-drop pipeline widgets, AI-powered risk detection, and automated data capture that keeps your dashboards current without manual updates. Start with the essential reports your team needs today, then expand as your process evolves — no technical expertise required.
Try monday CRMFAQs
What is a sales pipeline?
A sales pipeline is a visual representation of your sales process, showing all active deals organized by stage from first contact to close. It tracks the path prospects take as they move toward becoming customers.
How often should you update a sales pipeline report?
Sales pipeline reports should update in real-time through automated data capture. Review them daily for individual reps and weekly for the whole team. This keeps your data current and useful.
What is the difference between a sales pipeline and a sales funnel?
A sales pipeline tracks individual deals through stages. A sales funnel measures conversion rates and volume at each stage. Pipelines show deal progression. Funnels show conversion metrics.
How do you calculate pipeline coverage?
Pipeline coverage is total pipeline value divided by your revenue target for the period. Most teams target a 3:1 ratio because not all deals close.
What makes a deal "at-risk" in a pipeline report?
A deal is at-risk when you see warning signs: no recent stakeholder engagement, missing next steps, pushed close dates, or low activity. These signs mean the deal probably won't close as expected.
Can small businesses benefit from pipeline reporting?
Small businesses get a lot from pipeline reporting. It shows deal status, helps prioritize follow-ups, and supports better decisions — without needing big teams or complex systems. Even simple visual dashboards change how small teams manage opportunities.