
Sales performance analysis transforms raw data into revenue-driving insights that help your team close more deals and hit targets consistently. Instead of waiting for quarterly reports to reveal problems, you can spot trends early, optimize your sales process in real-time, and turn every rep into a top performer.
This guide shows you how to build a sales performance analysis framework that delivers results. You’ll discover the key metrics that predict success, practical implementation steps, and how AI-powered tools help you move from reactive reporting to proactive performance management that drives sustainable revenue growth.
Key takeaways
- Analyze patterns and correlations in your sales data to identify root causes of performance changes, not just track what occurred.
- Focus on leading indicators like pipeline velocity and stage conversion rates that predict future performance problems before they impact revenue, giving you time to course-correct.
- Use AI to spot at-risk deals and coaching opportunities automatically, leveraging technology to identify performance patterns humans miss and enable proactive management rather than reactive firefighting.
- Establish regular review rhythms that turn insights into action by creating daily, weekly, and monthly analysis cycles with specific owners and deadlines to ensure performance improvements actually happen.
- Build a unified data foundation where monday CRM centralizes deals, contacts, and activities in one workspace so teams can analyze complete performance pictures instead of piecing together scattered information.
What is sales performance analysis?
Sales performance analysis means measuring, evaluating, and interpreting your sales data to see how effectively your team hits targets — and where you need to improve. You go beyond basic reporting to uncover the patterns and correlations that reveal what’s actually driving results.
Think of it this way: When your quarterly sales report shows a 15% drop in win rates, that’s reporting. When you discover that drop correlates with longer sales cycles in the enterprise segment because a new competitor entered the market, that’s analysis. The distinction matters because CRM reporting shows what happened, while analysis explains why it happened and what to do about it.
Sales performance analysis covers several key areas:
- Individual rep productivity: Track how each salesperson performs against their targets and peers.
- Team-wide conversion rates: Measure how effectively prospects move through your pipeline.
- Pipeline health: Assess the quality and quantity of opportunities at each stage.
- Revenue trends: Identify patterns in deal size, velocity, and customer segments.
- Customer acquisition patterns: Understand which sources and strategies drive the most valuable deals.
Traditional analysis relied on manual spreadsheet work and backward-looking metrics that arrived too late to be useful. Contemporary approaches use sales analytics software that consolidates data sources and provides real-time visibility into performance trends.
Why sales performance analysis drives revenue growth
Sales performance analysis matters because it directly impacts revenue outcomes. Here are reasons why analysis is essential for revenue teams:
Improve forecast accuracy and pipeline predictability
Revenue leaders need to predict whether their teams will hit targets — and they’re under constant pressure to get it right. Without analysis, forecasts rely on gut feeling and optimistic projections from reps who want to look confident about their deals.
Analyze historical conversion rates, deal velocity, and seasonal trends. You get data-backed projections executives can actually trust. When you know 40% of deals in negotiation close within 30 days, you can forecast based on evidence — not hope.
You can spot which pipeline stages consistently bottleneck and adjust your forecasts. Accurate forecasts lead to smarter resource allocation, hiring decisions, and strategic planning. When leadership knows what Q3 revenue will look like, they can commit to investments, approve headcount, and set realistic expectations with the board.
Identify performance gaps and coaching opportunities
Without analysis, managers discover performance issues too late — when deals are already lost or quotas missed. By then, it’s too late to coach.
Analysis surfaces specific skill gaps you’d miss with generic observation:
- Discovery expertise: One rep might excel at discovery calls but struggle with objection handling during negotiations
- Qualification challenges: Another might have strong activity levels but poor conversion rates, suggesting targeting or qualification problems
- Process adherence: Data reveals which reps consistently follow best practices versus those who skip critical steps
This level of detail lets you coach specifically — not run generic training sessions. Data-driven coaching focuses your efforts where they matter most. You improve team performance without adding headcount.
Make faster data-driven decisions
Sales leaders constantly make decisions: territory assignments, compensation structures, product focus, market prioritization. Without analysis, you’re deciding based on incomplete information — or whoever talks the loudest.
Sales analytics provides evidence for strategic decisions. When data shows enterprise healthcare deals close at twice the rate of mid-market retail deals, territory and targeting decisions are obvious.
You see which products have the highest win rates, which segments convert fastest, and which lead sources produce the most revenue. Real-time analysis lets you spot emerging trends and adjust course quickly. If conversion rates in a segment start declining, you can investigate and respond before the problem spreads across multiple quarters.
Key metrics to evaluate rep performance and team success
Track the right metrics. These sales metrics fall into 3 categories that together provide a complete performance picture: pipeline health, activity and productivity, and revenue outcomes.
1. Pipeline health and conversion metrics
A sales funnel analysis reveals how effectively prospects move through your sales process and where deals stall or fall out. These metrics help you spot process improvements and forecast more accurately.
| Metric | What it measures | Why it matters |
|---|---|---|
| Win rate | Percentage of opportunities that close successfully | Indicates overall sales effectiveness and deal qualification quality |
| Pipeline velocity | Average time from lead creation to closed deal | Reveals process efficiency and identifies stage-specific bottlenecks |
| Stage conversion rates | Percentage of deals advancing from each pipeline stage to the next | Pinpoints exactly where prospects drop off |
| Pipeline coverage ratio | Total pipeline value divided by quota | Shows whether pipeline volume is sufficient |
| Deal slippage rate | Percentage of forecasted deals pushed forward | Indicates forecast reliability issues |
These metrics show process health — not just closed revenue. A team can hit quota while hiding serious pipeline problems. Compare these metrics across reps, territories, or product lines to see where you need to improve.
2. Activity and productivity indicators
Activity metrics measure sales behaviors and effort levels. They help you tell the difference between skill issues and effort issues. The difference matters — it changes how you intervene. These indicators help you diagnose performance challenges:
- Outreach volume: Number of calls, emails, and meetings conducted provides a baseline measure of sales effort. Low activity with low results suggests an effort problem; high activity with low results suggests a skills or targeting problem.
- Response rates: Percentage of outreach attempts that generate prospect engagement indicates messaging effectiveness. If reps are making calls but no one calls back, the problem isn’t effort.
- Meeting-to-opportunity conversion: How many discovery calls or demos convert to qualified pipeline shows qualification skills. Reps who take lots of meetings but create few opportunities may be meeting with the wrong people.
- Activities per closed deal: Average touches required to close business reveals sales cycle efficiency. If one rep needs 50 touches to close while another needs 20, that’s a coaching opportunity.
- Time allocation: How reps distribute time across prospecting, nurturing, closing, and administrative work identifies productivity drains.
Learn more: Top AI platforms for sales productivity
3. Revenue and customer retention metrics
Revenue metrics measure business outcomes and long-term customer value — not just initial sales. These metrics connect sales performance to broader business health and show sustainable growth patterns.
Key revenue indicators include:
- Revenue per rep: Total revenue generated divided by number of reps indicates team productivity and capacity planning needs
- Average deal size: Mean value of closed opportunities reveals whether reps are selling to the right accounts and maximizing deal value
- Customer acquisition cost (CAC): Total sales and marketing spend divided by new customers shows efficiency of revenue generation
- Customer lifetime value (CLV): Projected total revenue from a customer relationship indicates long-term business health
- Net revenue retention: Revenue from existing customers including expansions and churn measures account management effectiveness
- Quota attainment distribution: Percentage of reps hitting various quota thresholds reveals whether targets are realistic and performance is consistent
High acquisition costs or low retention rates signal problems pipeline metrics won’t catch. Analyze these alongside activity and pipeline metrics for the complete picture.
The 6-component sales performance analysis framework
Sales performance analysis is more than tracking metrics. You need a framework that connects data collection, analysis, and action. This 6-component framework provides the structure revenue teams need to move from ad-hoc reporting to continuous sales performance management.
1. Unified data foundation
Most sales teams have data scattered everywhere: CRM systems, email platforms, call recording tools, marketing automation, spreadsheets. This fragmentation makes real analysis nearly impossible.
A unified data foundation consolidates all sales-related information into a single source of truth. This includes customer interactions, deal progression, activity logs, and revenue outcomes.
Building this foundation requires:
- Standardized data entry: Consistent field definitions and naming conventions
- Automated data capture: Minimize manual input errors through integrations
- Regular cleanup processes: Identify and correct duplicate or outdated records
2. Performance benchmarking standards
Metrics only become meaningful when compared against standards. Without benchmarks, teams can’t determine whether a 30% win rate is excellent or concerning.
You should establish 4 types of benchmarks to create meaningful context for performance evaluation:
- Historical baselines: Your team’s past performance across quarters and years provides the foundation for understanding improvement or decline
- Top performer standards: Metrics achieved by your highest-performing reps show what’s possible within your specific market and sales motion
- Industry averages: Typical performance ranges for your sector and deal size provide external context for internal performance
- Target thresholds: Minimum acceptable performance levels tied to business goals define the floor below which intervention is required
Benchmarks should be specific to role, territory, and product line rather than one-size-fits-all. An SDR benchmark differs from an AE benchmark; an enterprise territory benchmark differs from mid-market.
3. Predictive analytics and forecasting
While historical analysis shows what happened, predictive analytics forecasts what’s likely to happen based on current pipeline health, historical patterns, and leading indicators.
Predictive analytics enables teams to:
- Identify at-risk deals: Spot deals likely to slip before they slip
- Forecast quota performance: Predict which reps will miss quota based on current activity levels
- Project revenue accuracy: Generate end-of-quarter revenue projections with greater accuracy than rep-submitted forecasts
4. Real-time monitoring systems
Traditional analysis based on monthly or quarterly reviews identifies problems too late to correct them. By the time a quarterly business review reveals declining conversion rates, 3 months of deals have already been affected.
Continuous monitoring surfaces issues as they emerge. You can spot a sudden drop in outreach activity, declining response rates, or deals stalling at specific pipeline stages immediately.
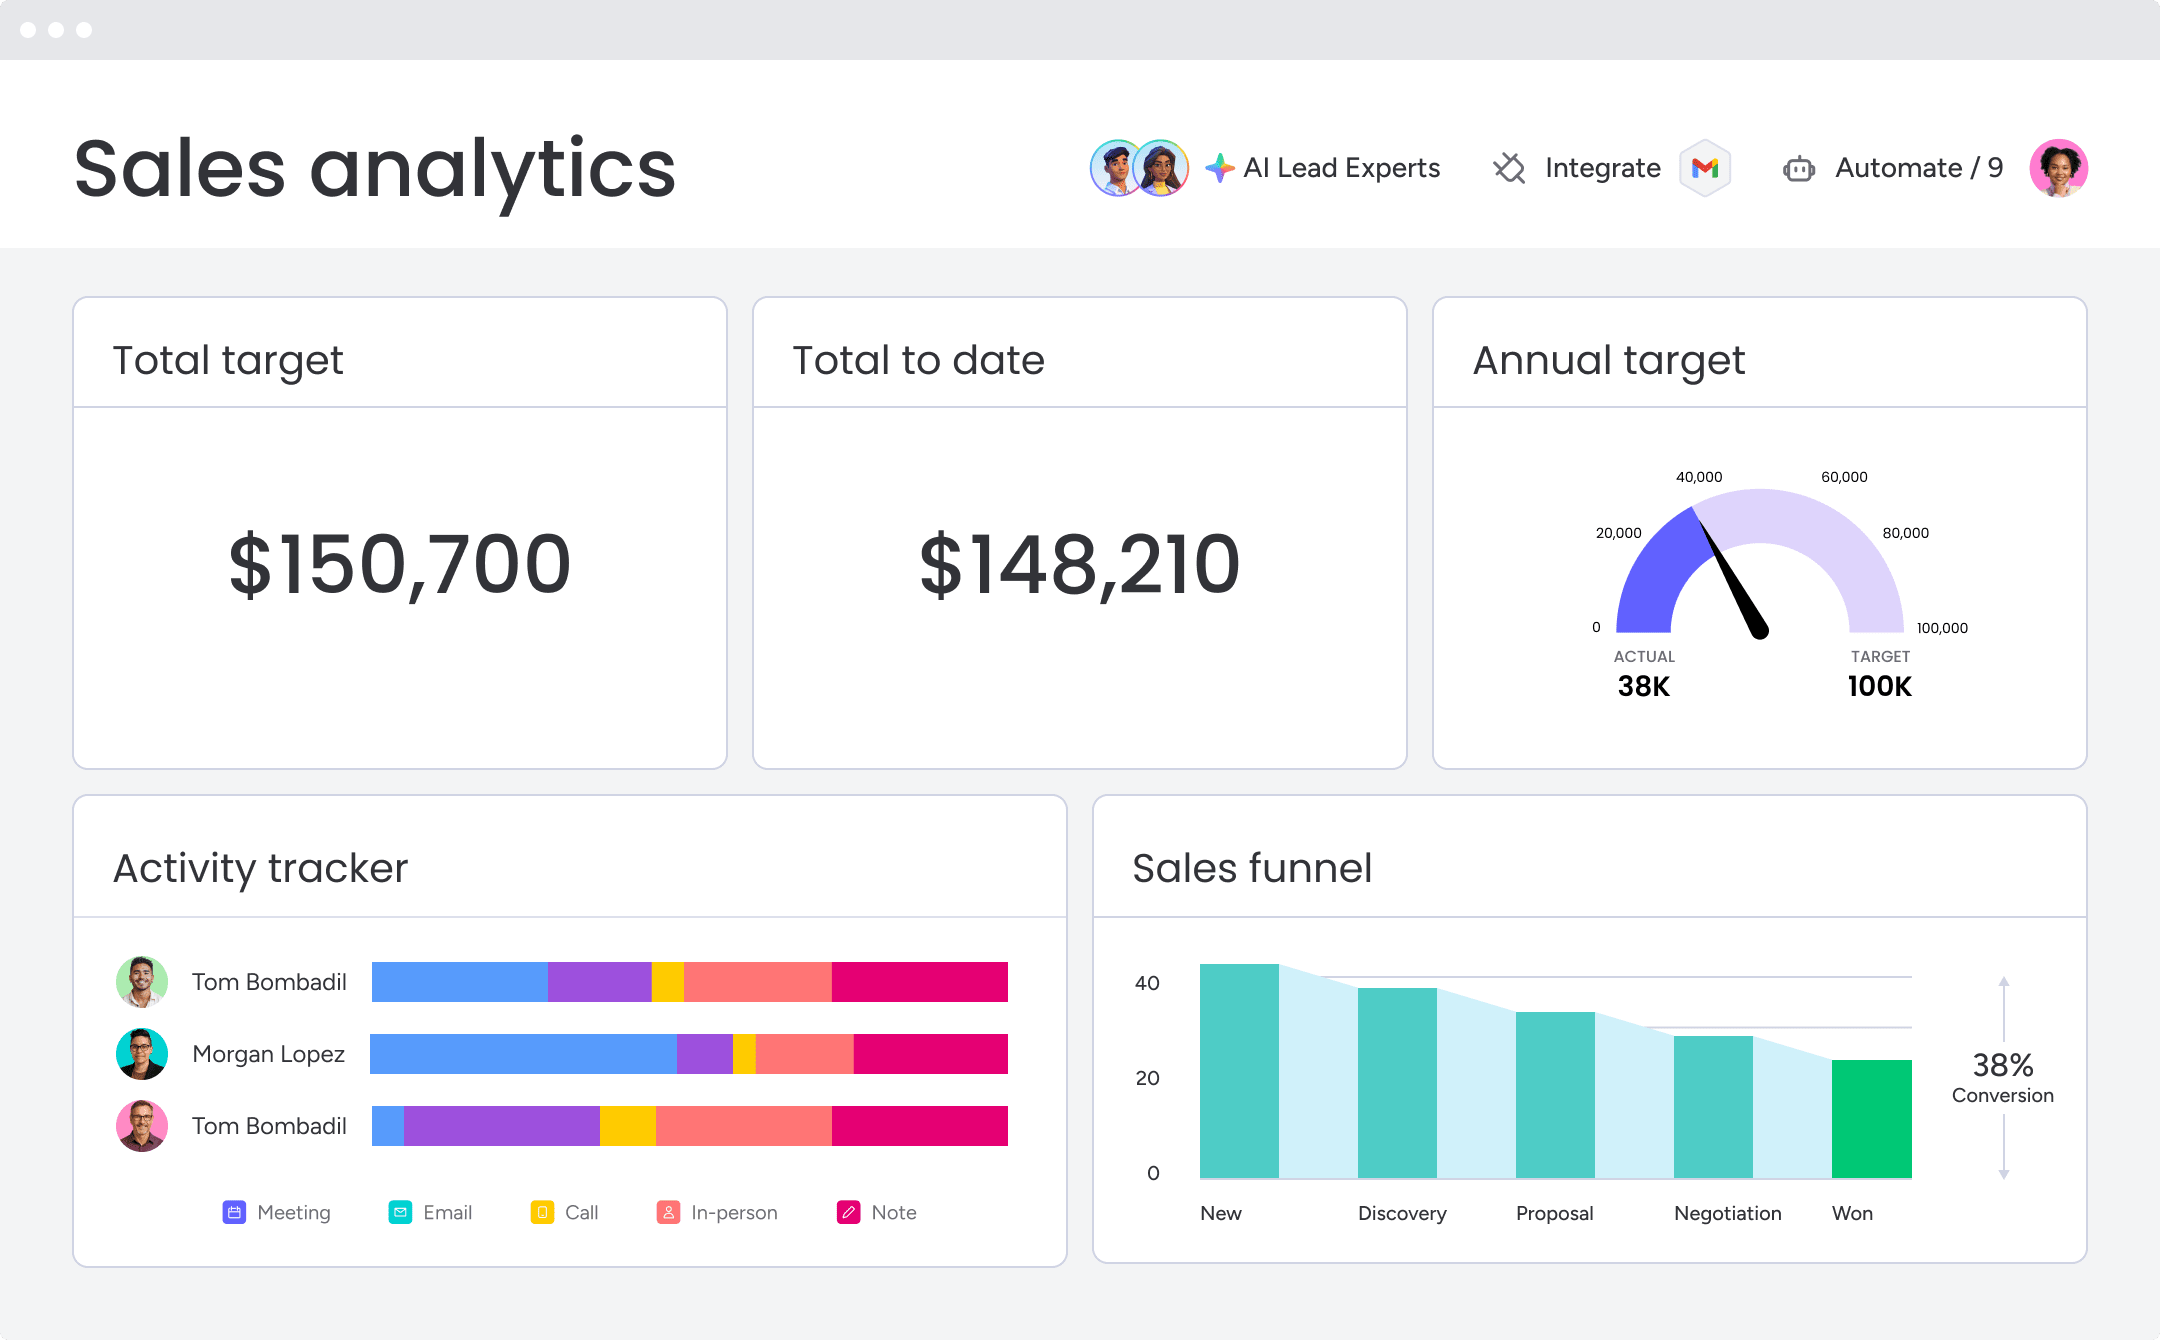
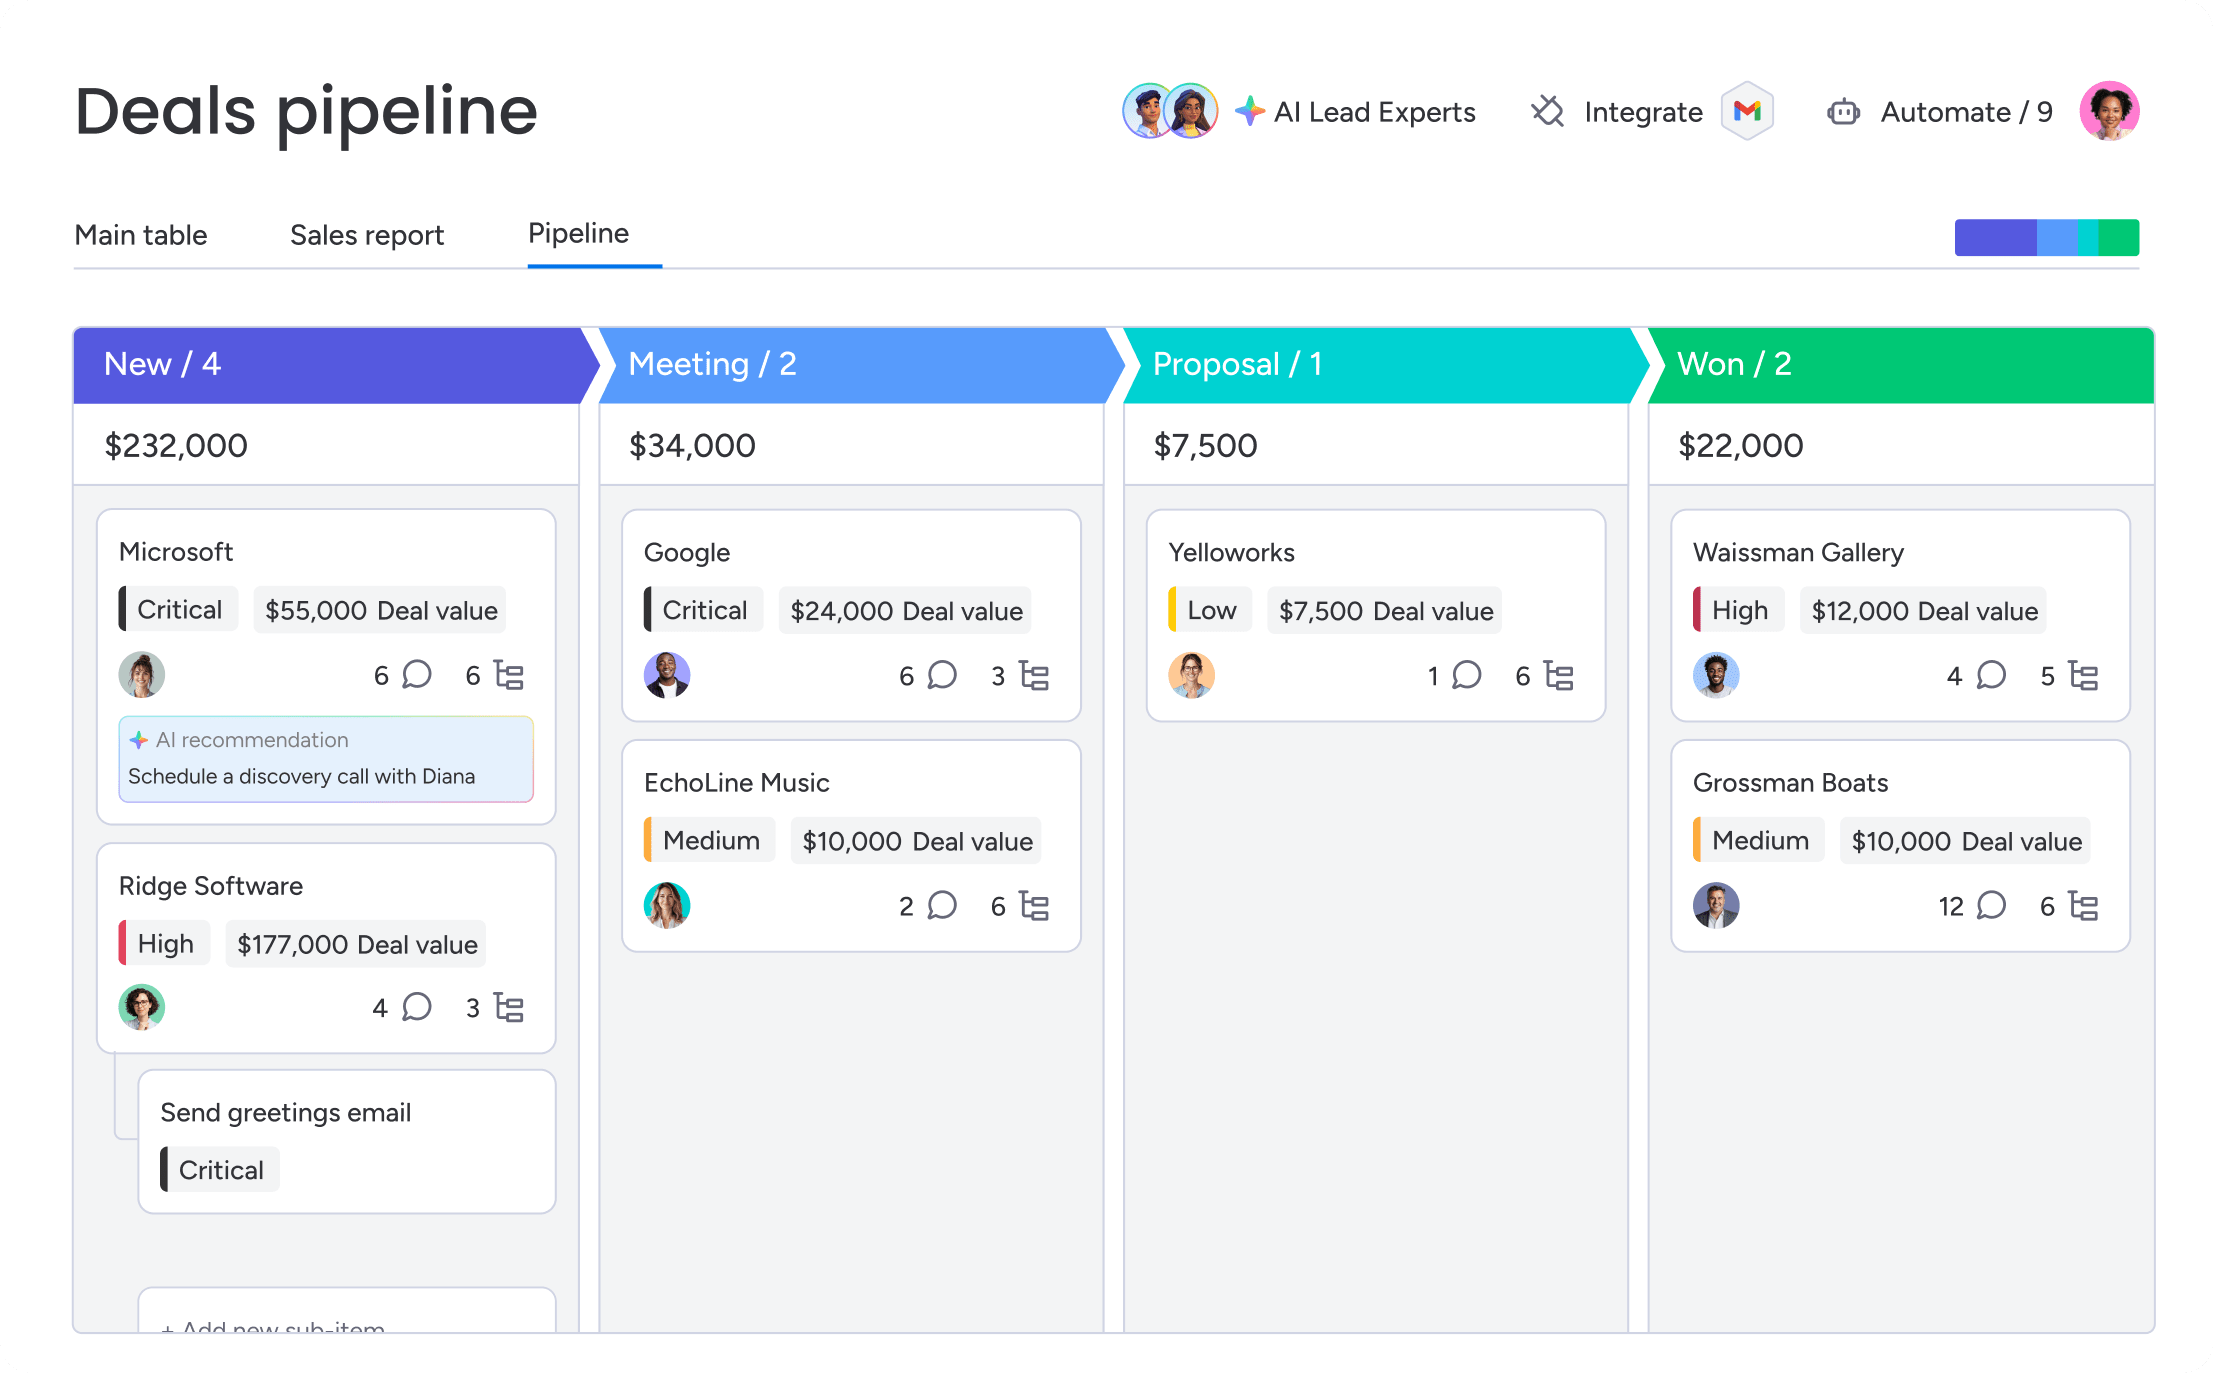
This enables immediate intervention rather than post-mortem analysis. Effective real-time monitoring requires visual dashboards that surface exceptions and trends without requiring manual data analysis. The platform’s sales-specific widgets, including the leaderboard widget, sales funnel widget, and sales pipeline widget, provide this visibility without requiring technical expertise.
5. Coaching and development insights
Performance analysis should directly inform coaching priorities by identifying specific skill gaps, behavioral patterns, and development opportunities for each rep.
Managers can extract several types of coaching insights from performance data:
- Skill-specific gaps: Which reps struggle with discovery, objection handling, or closing
- Behavioral patterns: Activity levels, follow-up consistency, and pipeline management habits that correlate with success
- Comparative performance: How individual reps compare to top performers on specific metrics
6. Cross-functional revenue metrics
Comprehensive performance analysis must connect sales metrics to broader sales operations, including marketing contribution, customer success impact, and overall business health.
Key cross-functional metrics to track include:
- Lead source performance: Which marketing channels produce the highest-quality, fastest-converting opportunities
- Marketing-to-sales handoff efficiency: How quickly and effectively leads transition from marketing to sales engagement
- Post-sale expansion rates: How well account managers grow customer relationships after initial purchase
- Customer health correlation: How sales process quality impacts long-term retention and satisfaction
The platform supports workflows beyond pipeline, including onboarding progress, renewals, client projects, and collection tracking. This gives revenue leaders visibility across the full customer journey, not just the initial sale.
Try monday CRM Analysis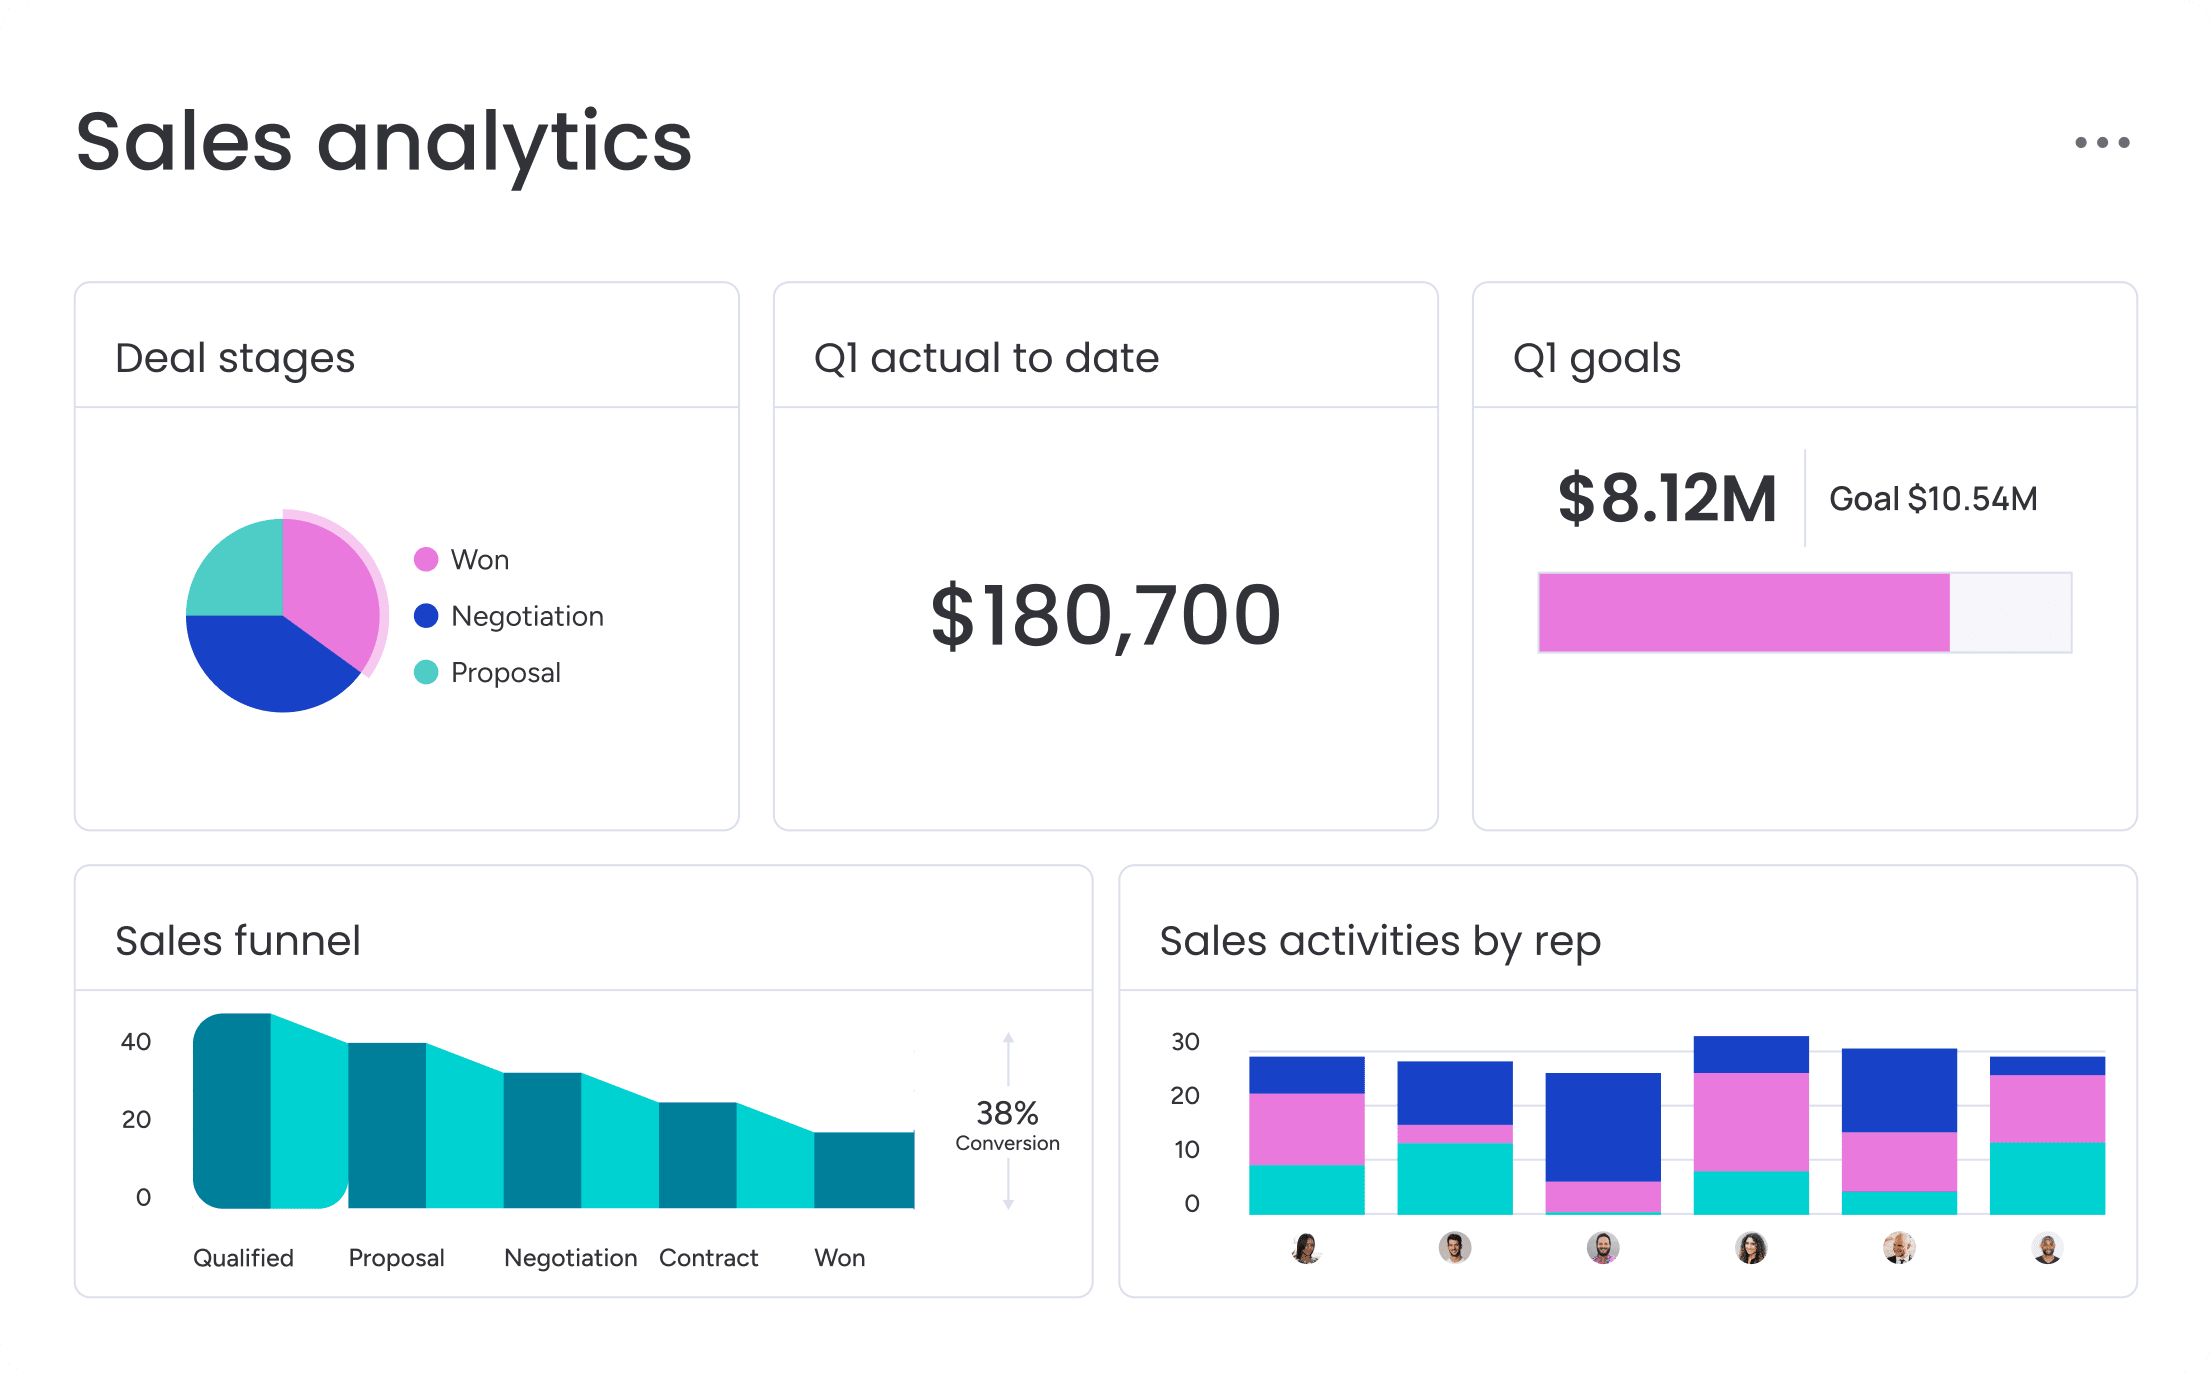
How to analyze sales data in 5 practical steps
Understanding the framework is one thing, but implementing sales performance analysis requires a practical, sequential approach. These 5 steps provide a roadmap for teams building their analysis capability from the ground up.
Step 1: Consolidate your sales data sources
Start by auditing where sales data currently lives. The audit often reveals surprising fragmentation: deal data in the CRM, activity data in email, notes in spreadsheets, and call recordings in yet another system.
The consolidation process involves:
- Identify source systems: Map where each type of sales data currently resides
- Establish data integration: Connect platforms or migrate to a unified system
- Eliminate redundant entry: Remove duplicate data collection points
| Requirement | Description | Impact on analysis |
|---|---|---|
| Standardized fields | Consistent naming conventions and formats | Enables accurate aggregation and comparison |
| Required vs. optional data | Defined rules for required fields | Ensures sufficient data for analysis |
| Automated capture | Reduce manual entry via integrations | Minimizes human error |
| Regular cleanup | Remove duplicates and outdated records | Maintains long-term accuracy |
Step 2: Define performance KPIs and targets
Select metrics that directly connect to business goals rather than tracking everything possible. Choose leading indicators alongside lagging indicators for a balanced view.
Each KPI needs:
- Defined calculation method: Everyone agrees on how the metric is computed
- Appropriate measurement frequency: Daily, weekly, monthly, or quarterly tracking
- Realistic targets: Based on historical performance and business requirements
All stakeholders need to understand which KPIs matter, how they’re calculated, and why they were chosen.
Step 3: Build your analytics infrastructure
Effective analysis requires systems that can process data, identify patterns, and surface insights without requiring technical expertise from sales teams.
Infrastructure components include:
- Data processing capability: Aggregates and calculates metrics automatically
- Segmentation capabilities: Slices data by rep, territory, product, or time period
- Trend identification: Highlights changes and anomalies over time
The platform includes analytics capabilities designed specifically for sales performance analysis, providing code-free, customizable dashboards that eliminate the need for separate business intelligence tools.
Step 4: Create visual dashboards and reports
Even perfect data becomes useless if stakeholders can’t quickly understand what it means. Visual sales dashboard templates transform numbers into actionable insights.
Different roles need different views:
- Sales reps: Quota progress, activity tracking, and pipeline health
- Sales managers: Team performance comparisons, coaching priorities, and forecast accuracy
- Executives: Revenue trends, team capacity, and strategic metric alignment
Step 5: Implement review rhythms and action plans
Many teams build excellent analytics but fail to translate insights into action. Establishing regular review rhythms ensures analysis drives actual performance improvement.
| Review type | Frequency | Focus |
|---|---|---|
| Daily huddles | Daily | Pipeline coverage, activity levels, priorities |
| Weekly one-on-ones | Weekly | Rep performance and coaching |
| Monthly team reviews | Monthly | Trends and strategy adjustments |
| Quarterly business reviews | Quarterly | Strategic performance evaluation |
Each review should produce specific, assigned action items with owners and deadlines. Tracking whether action plans are implemented and whether they improve performance closes the loop.
Using AI to transform sales performance analysis
AI tools for sales performance optimization are fundamentally changing how teams conduct sales performance analysis by automating pattern recognition, surfacing insights humans might miss, and providing real-time recommendations. AI capabilities enable revenue teams to scale analysis beyond what manual processes can achieve.
Automated pipeline risk detection
Managers traditionally identify at-risk deals through manual pipeline reviews, relying on intuition and experience to spot warning signs. This approach misses subtle patterns and doesn’t scale across large pipelines.
AI analyzes multiple signals simultaneously:
- Deal stagnation patterns: Identifies deals that haven’t progressed in unusual timeframes
- Engagement drop-offs: Flags accounts where communication frequency has declined
- Activity anomalies: Spots unusual patterns in rep behavior or prospect responses
- Historical indicators: Compares current deals to thousands of historical win/loss patterns
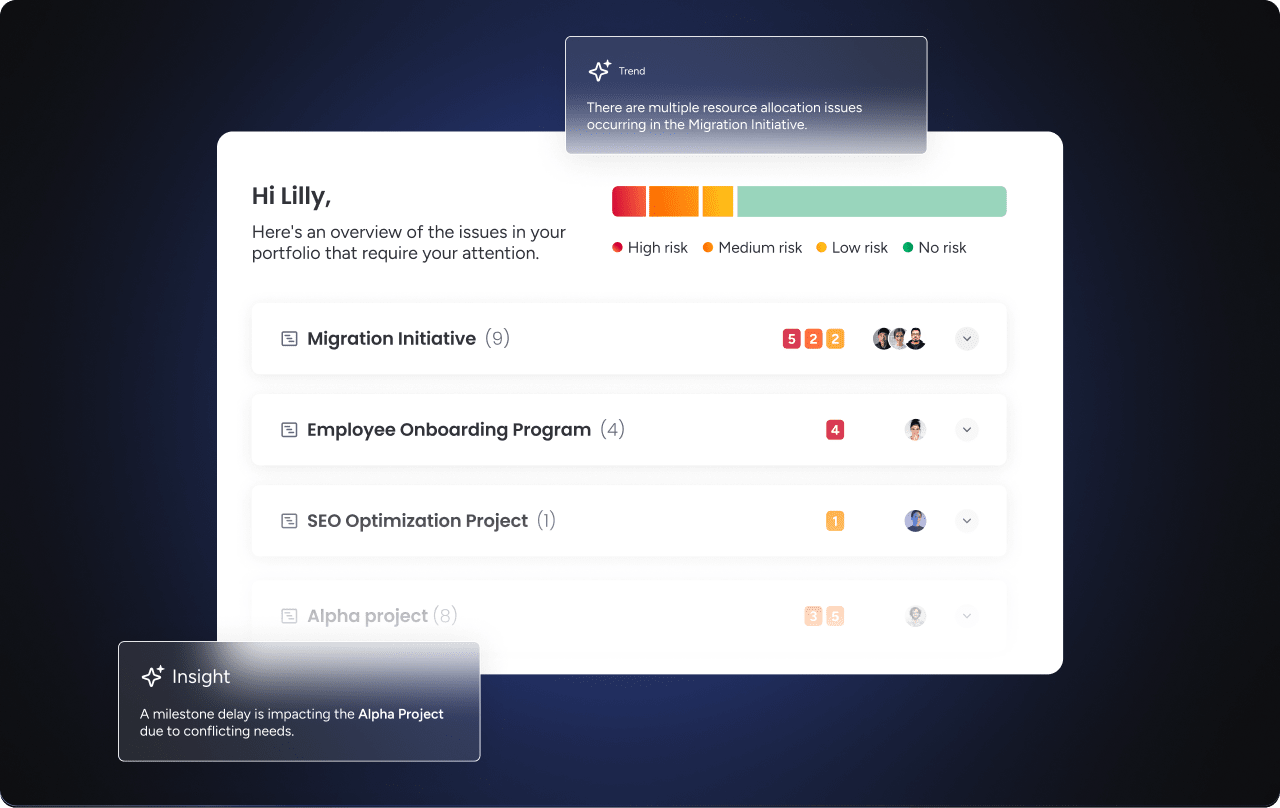
Teams leveraging monday CRM’s AI capabilities include sentiment detection that can flag at-risk accounts or frustrated prospects. The Assign label feature can automatically categorize deals based on risk signals, enabling proactive deal management rather than reactive firefighting.
Real-time coaching recommendations
Effective coaching requires managers to deeply understand each rep’s performance patterns, identify specific improvement areas, and provide timely, relevant guidance. This is nearly impossible when managing teams of 8-12 reps with competing demands on manager time.
AI analyzes individual rep performance across multiple dimensions:
- Performance comparison: Compares behaviors to top performers automatically
- Skill gap identification: Identifies specific areas where reps deviate from successful patterns
- Process adherence: Tracks whether reps follow proven methodologies consistently
The AI Timeline Summary creates short summaries of all communication events, helping sales managers quickly review account history before coaching conversations.
Predictive revenue modeling
Traditional forecasting relies on rep-submitted predictions and manager judgment, both subject to optimism bias and limited visibility into leading indicators.
AI builds revenue models based on:
- Historical conversion patterns: Analyzes thousands of past deals to identify success factors
- Current pipeline characteristics: Evaluates deal quality, stage progression, and engagement levels
- Rep performance trends: Factors in individual rep capabilities and recent performance
- External factors: Incorporates seasonality, market conditions, and competitive dynamics
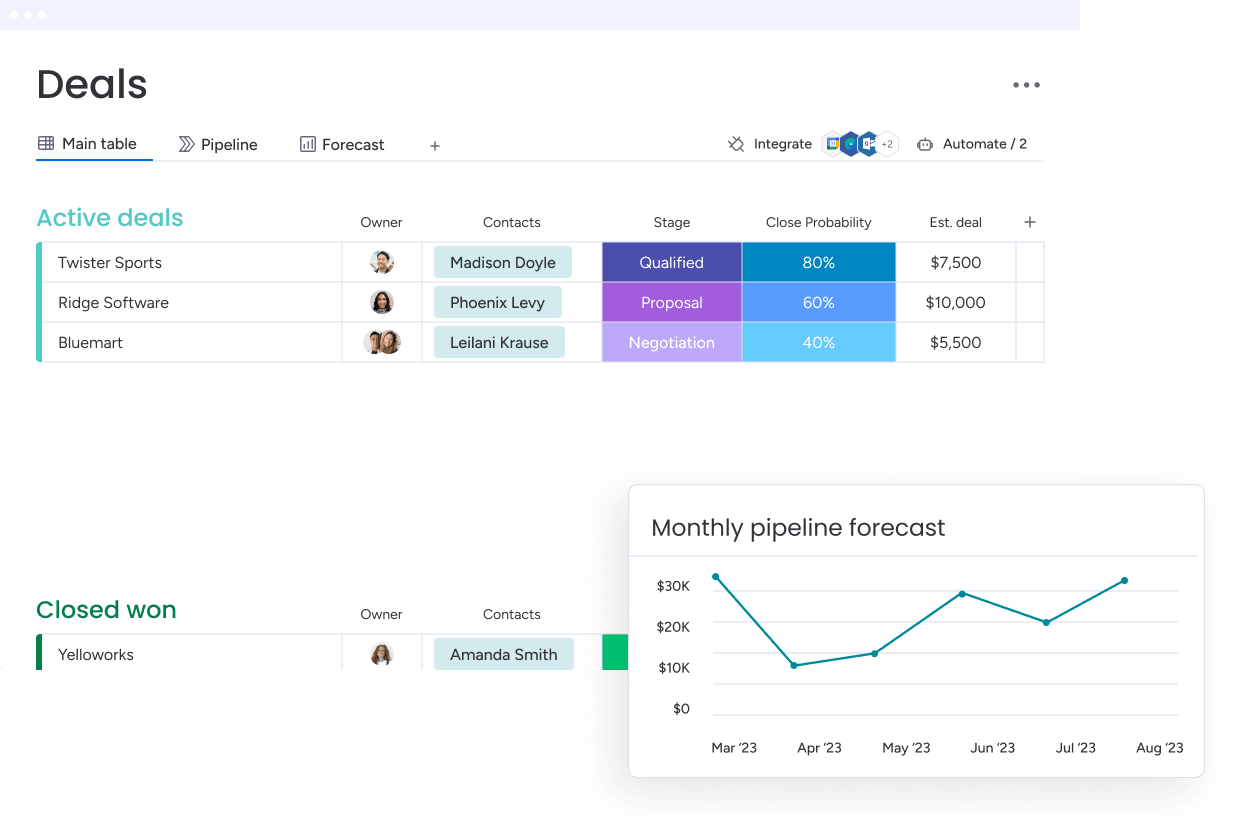
These models continuously update as new data arrives, providing forecasts that improve over time. Organizations using monday CRM support this through forecasting capabilities that track forecast vs. actual sales, allowing teams to build increasingly accurate projections based on historical patterns.
Analyzing buyer journeys across channels
Traditional sales performance analysis focused primarily on direct sales activities, but buyers today research independently, engage across multiple channels, and involve numerous stakeholders before ever speaking with sales. Revenue teams need customer behavior analysis across the complete buyer journey to optimize performance effectively.
Digital self-serve path measurement
Many buyers complete significant portions of their evaluation process through self-serve channels before engaging with sales teams. Traditional sales metrics miss this critical pre-sales engagement.
Teams should track:
- Content engagement depth: Which resources prospects consume and for how long
- Self-serve conversion triggers: What actions prompt prospects to request sales contact
- Time to sales engagement: How long prospects research before reaching out
- Self-serve drop-off points: Where prospects disengage without converting
Understanding self-serve behavior helps sales teams personalize outreach based on what prospects have already researched.
Multi-stakeholder attribution analysis
According to Gartner’sB2B Buying Report, purchase decisions involve 5–11 stakeholders across departments, each with their own priorities and concerns. Traditional analysis attributes deals to single contacts or reps, missing the reality that multiple stakeholders and touchpoints influence outcomes.
Multi-stakeholder tracking includes:
- Stakeholder mapping: Identifying all decision-makers and influencers
- Engagement distribution: Tracking interactions across the buying committee
- Influence assessment: Understanding each stakeholder’s role and impact
- Relationship strength: Measuring engagement quality with each contact
Deals with broader stakeholder engagement typically have higher win rates and faster close times.
Unified online and offline performance tracking
Connecting online and offline activities into a single customer journey view is essential. This means linking website visits to sales calls, email engagement to meeting outcomes, and product trial behavior to deal progression.
Revenue teams using monday CRM benefit from the platform’s centralized approach to contact and account management. Teams can see all connected deals, accounts, contacts, and projects in one place, with every interaction logged in one timeline regardless of channel.
How monday CRM powers sales performance analysis

Revenue teams get everything they need to implement comprehensive sales performance analysis in monday CRM without requiring technical expertise or juggling multiple disconnected tools. The platform consolidates data, automates insights, and turns analysis into action through an intuitive workspace designed specifically for sales teams.
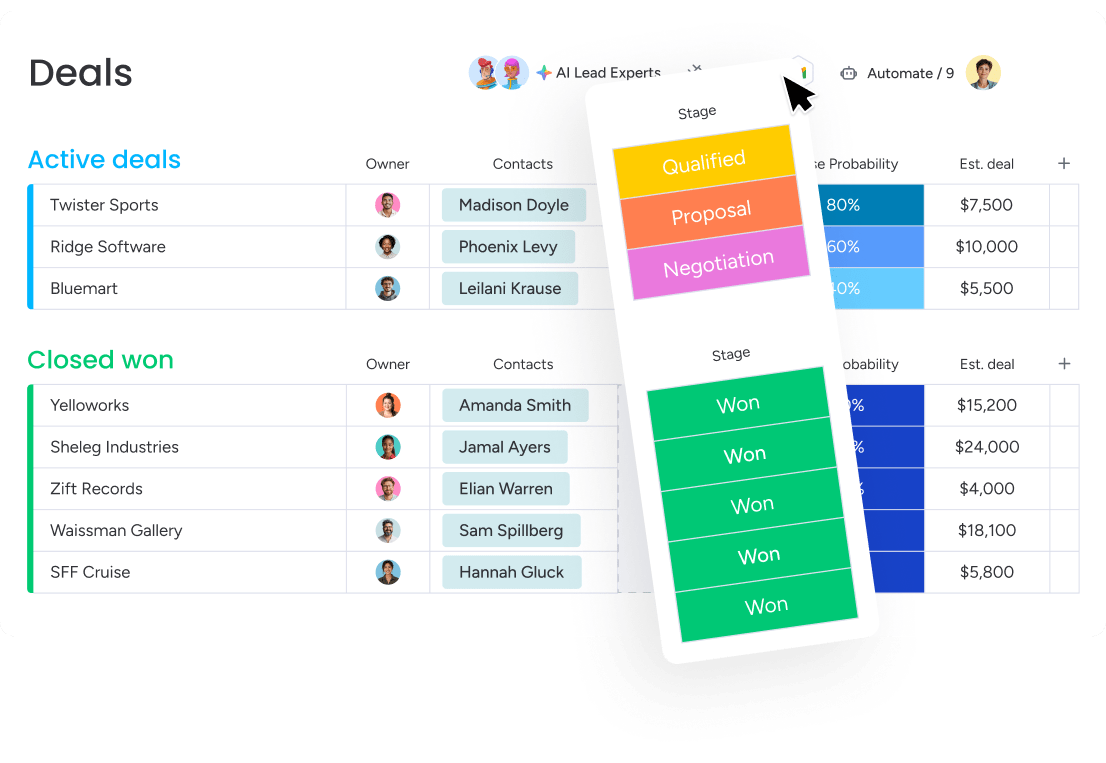
- Unified data foundation in one workspace: Centralize all deals, contacts, activities, and communications in a single platform that eliminates data fragmentation and provides complete visibility into every customer interaction across your entire revenue cycle.
- Real-time dashboards and visual analytics: Access pre-built sales widgets including pipeline views, funnel analysis, and performance leaderboards that surface insights instantly without requiring manual reporting or spreadsheet work.
- AI-powered performance insights: Leverage built-in AI capabilities that automatically detect at-risk deals, summarize communication timelines, analyze sentiment, and provide coaching recommendations based on patterns across your entire sales organization.
- Customizable tracking for your sales process: Configure fields, stages, and metrics that match your specific sales methodology, then track performance against benchmarks that matter to your business without rigid, one-size-fits-all structures.
- Cross-functional revenue visibility: Connect sales performance to broader operations including marketing attribution, customer success activities, and post-sale expansion, giving leadership complete visibility across the customer journey.
- Automated workflows that drive action: Transform insights into improvements through automated notifications, task assignments, and review processes that ensure performance analysis actually changes behavior and drives results.
“With monday CRM, we’re finally able to adapt the platform to our needs — not the other way around. It gives us the flexibility to work smarter, cut costs, save time, and scale with confidence.”
Samuel Lobao | Contract Administrator & Special Projects, Strategix“Now we have a lot less data, but it’s quality data. That change allows us to use AI confidently, without second-guessing the outputs.”
Elizabeth Gerbel | CEO“Without monday CRM, we’d be chasing updates and fixing errors. Now we’re focused on growing the program — not just keeping up with it."
Quentin Williams | Head of Dropship, Freedom Furniture“There’s probably about a 70% increase in efficiency in regards to the admin tasks that were removed and automated, which is a huge win for us.“
Kyle Dorman | Department Manager - Operations, Ray White"monday CRM helps us make sure the right people have immediate visibility into the information they need so we're not wasting time."
Luca Pope | Global Client Solutions Manager at Black Mountain“In a couple of weeks, all of the team members were using monday CRM fully. The automations and the many integrations, make monday CRM the best CRM in the market right now.”
Nuno Godinho | CIO at Velv
“monday.com provides developmental flexibility, operational efficiency, and data transparency — all in one place. We became a company that moved from chasing data to leading with it.”
Hyunghan Lee | Team Lead, Sandbox Network
"monday.com brought every part of our business into one connected space. The harmony between work management and CRM has become our operating system — giving us the clarity and confidence to scale.”
Jennifer Chinburg | Executive Vice President of Corporate Development & Brand, Chinburg Properties
“We just weren’t getting value from our old CRM. With monday.com, it's a thousand times better. Our sales teams are more informed, more consistent, and far more connected."
James Arnold | Chief Operating Officer, CenversaTransform your revenue operations with data-driven insights
Sales performance analysis transforms how revenue teams operate by turning raw data into actionable insights that drive consistent growth. When you track the right metrics, establish regular review rhythms, and leverage AI-powered tools, you move from reactive firefighting to proactive performance management that improves forecasting accuracy, accelerates deal velocity, and maximizes team productivity.
With monday CRM, you get the unified platform you need to consolidate sales data, visualize performance trends, and identify coaching opportunities — all without requiring technical expertise. Start building your data-driven revenue engine today and discover how real-time analysis turns every rep into a top performer.
Try monday CRM AI CapabilitiesFAQs
What is the difference between sales performance analysis and sales reporting?
The difference between sales performance analysis and sales reporting is that reporting shows what happened (e.g., revenue closed), while analysis explains why it happened and what to do about it, providing insights rather than just data.
How often should sales teams conduct performance analysis?
Sales performance analysis should happen at multiple frequencies: daily monitoring for activity levels, weekly analysis for coaching conversations, monthly reviews for team-wide trends, and quarterly analysis for strategic planning.
What are the most important sales metrics to track for performance analysis?
The most important sales metrics to track for performance analysis include a mix of outcome and leading indicators. Core metrics include win rate, pipeline velocity, and pipeline coverage ratio, while activity metrics like outreach volume and meeting-to-opportunity conversion help diagnose performance issues.
How can small sales teams implement performance analysis without dedicated analysts?
Small teams can implement effective analysis by adopting platforms with built-in analytics capabilities, focusing on 5-7 core metrics, using visual dashboards that surface insights automatically, and establishing simple review rhythms.
What role does AI play in sales performance analysis?
The role AI plays in sales performance analysis is to automate and scale insights. AI automates pattern recognition, identifies at-risk deals, provides real-time coaching recommendations, and builds predictive revenue models that improve forecast accuracy.
How do you measure sales performance across multiple channels?
Measuring performance across multiple channels requires unified tracking that connects online and offline activities into a single customer journey view, linking website engagement with CRM records and tracking self-serve touchpoints alongside direct sales interactions.