
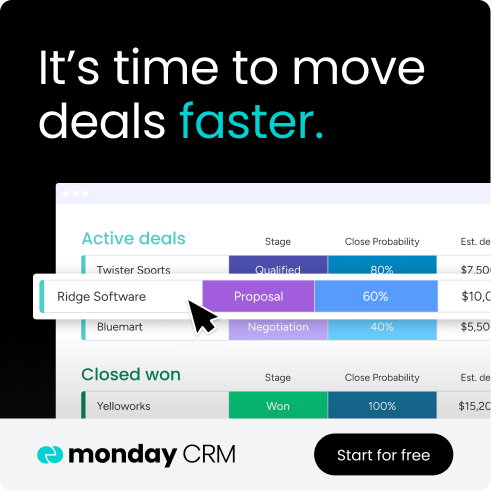
Every sales leader wants predictable revenue, but forecasting often feels more like guesswork than science. Relying on intuition and scattered spreadsheets can prevent teams from anticipating changes and hitting their targets consistently. Effective sales analytics replaces that uncertainty with clear, data-driven direction, giving you the visibility to make confident decisions.
This guide breaks down how to build a data-driven sales engine. We will explore the four types of analytics, from basic reporting to predictive forecasting. You will also learn the essential metrics for tracking performance and the steps to implement an analytics program that your team will actually use.
Putting these pieces together gives you a complete view of your sales operation, from lead to close. It helps you spot what is working, fix what is not, and build confidence in your team’s ability to hit its goals. The first step is understanding what sales analytics truly means for your business.
Try monday CRMKey takeaways
- Sales analytics transforms guesswork into data-driven decisions by collecting information from every customer touchpoint and turning it into actionable insights that help you forecast accurately and hit your targets consistently.
- The four types of analytics (descriptive, diagnostic, predictive, and prescriptive) work together to show you what happened, why it happened, what will happen next, and what actions you should take to improve results.
- Focus on 15 essential metrics like revenue growth, sales cycle duration, lead conversion rate, and pipeline velocity to get complete visibility into your sales performance without drowning in data overload.
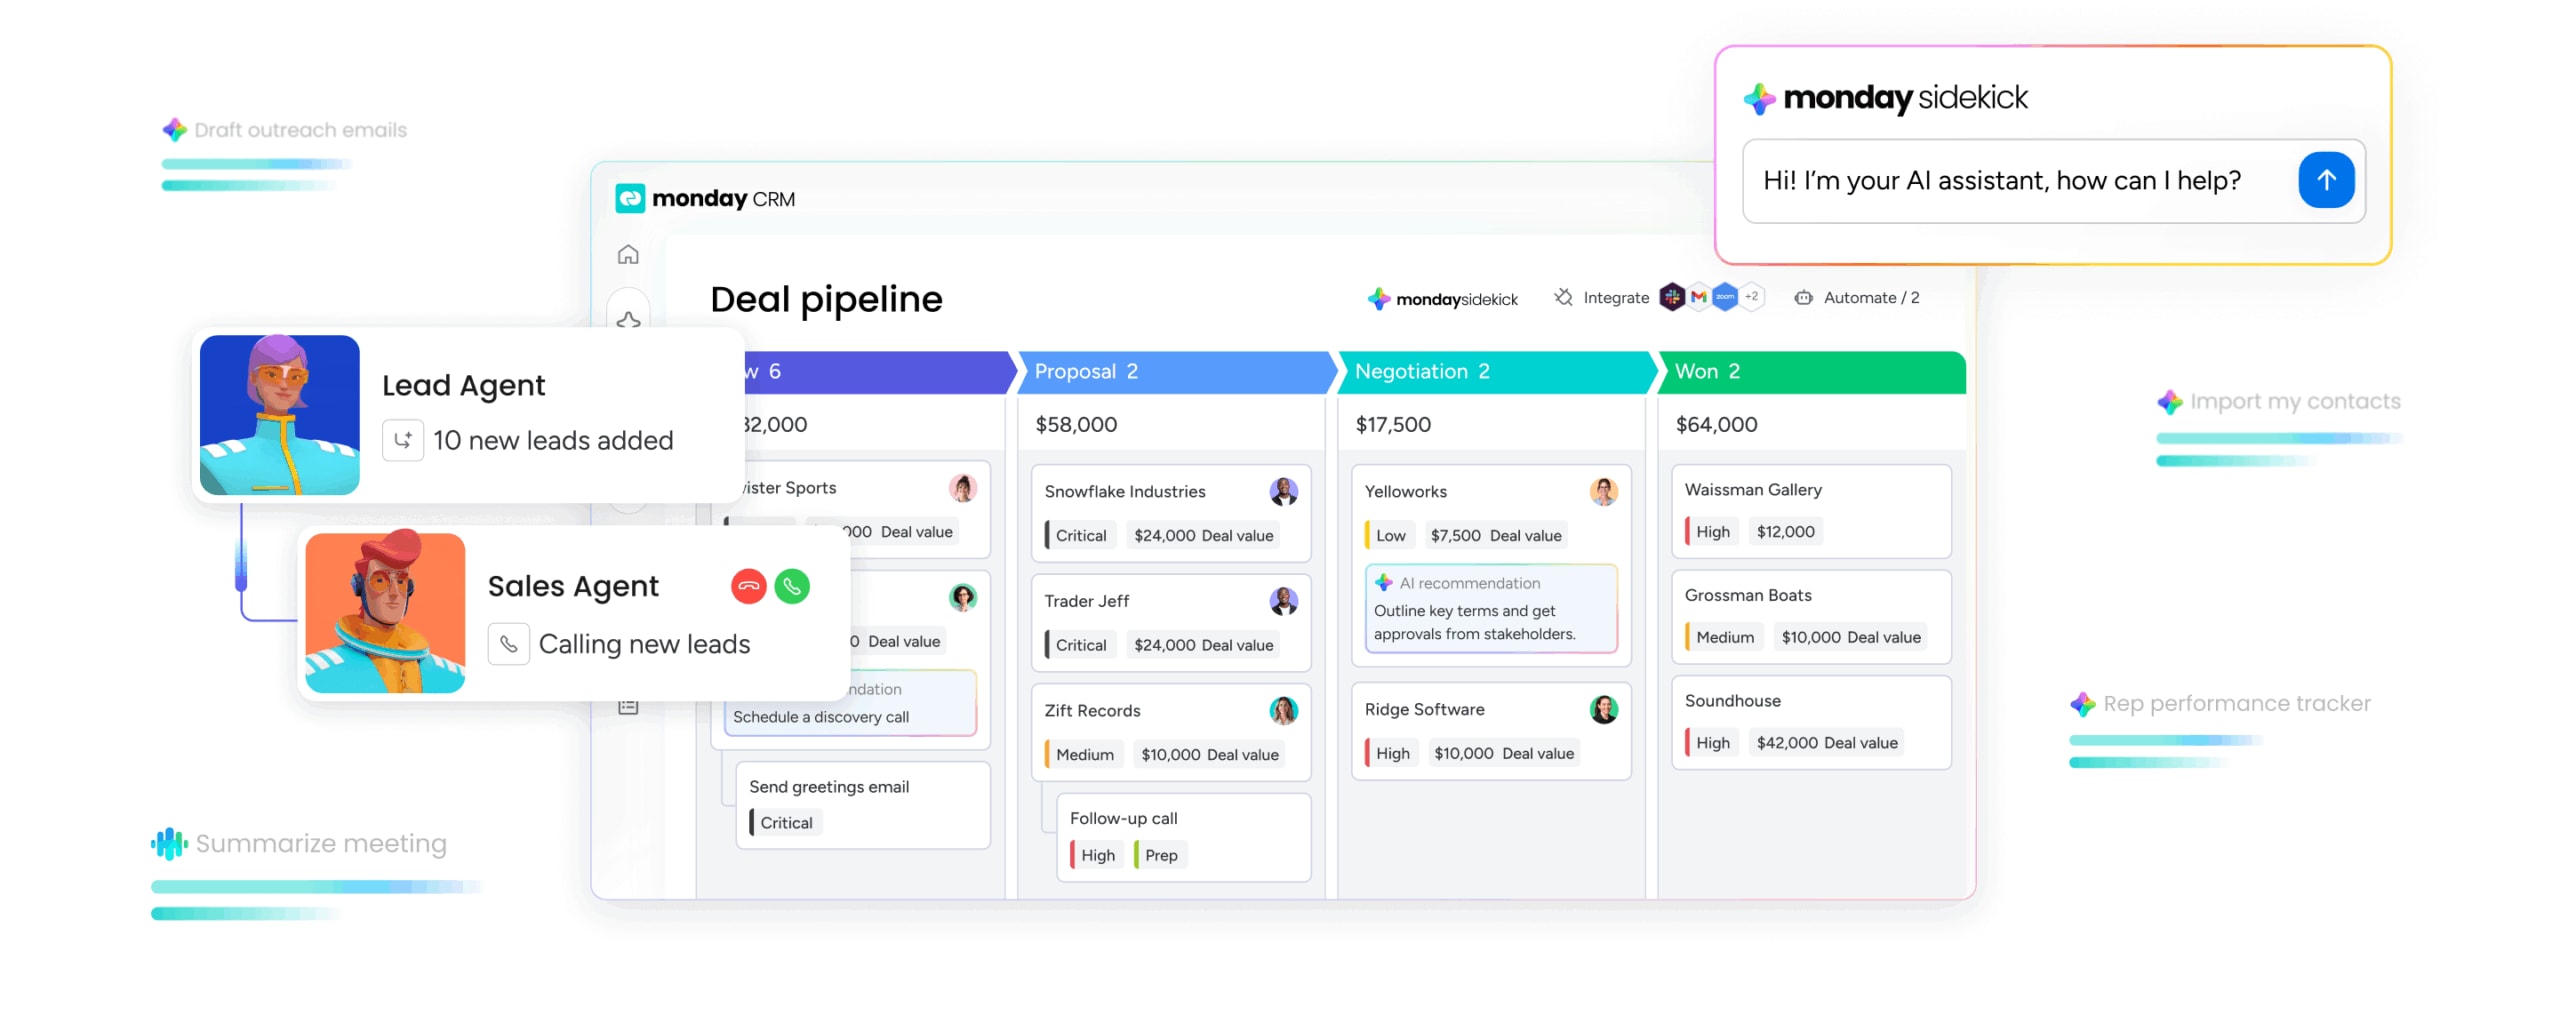
- monday CRM combines powerful CRM functionality with advanced analytics in one intuitive platform, featuring AI-powered insights, automated workflows, and customizable dashboards that make complex data accessible to everyone on your team.
- Successful implementation requires centralizing your data, defining clear KPIs, training your team for adoption, and continuously refining your approach based on what drives real business results.
What is sales analytics?
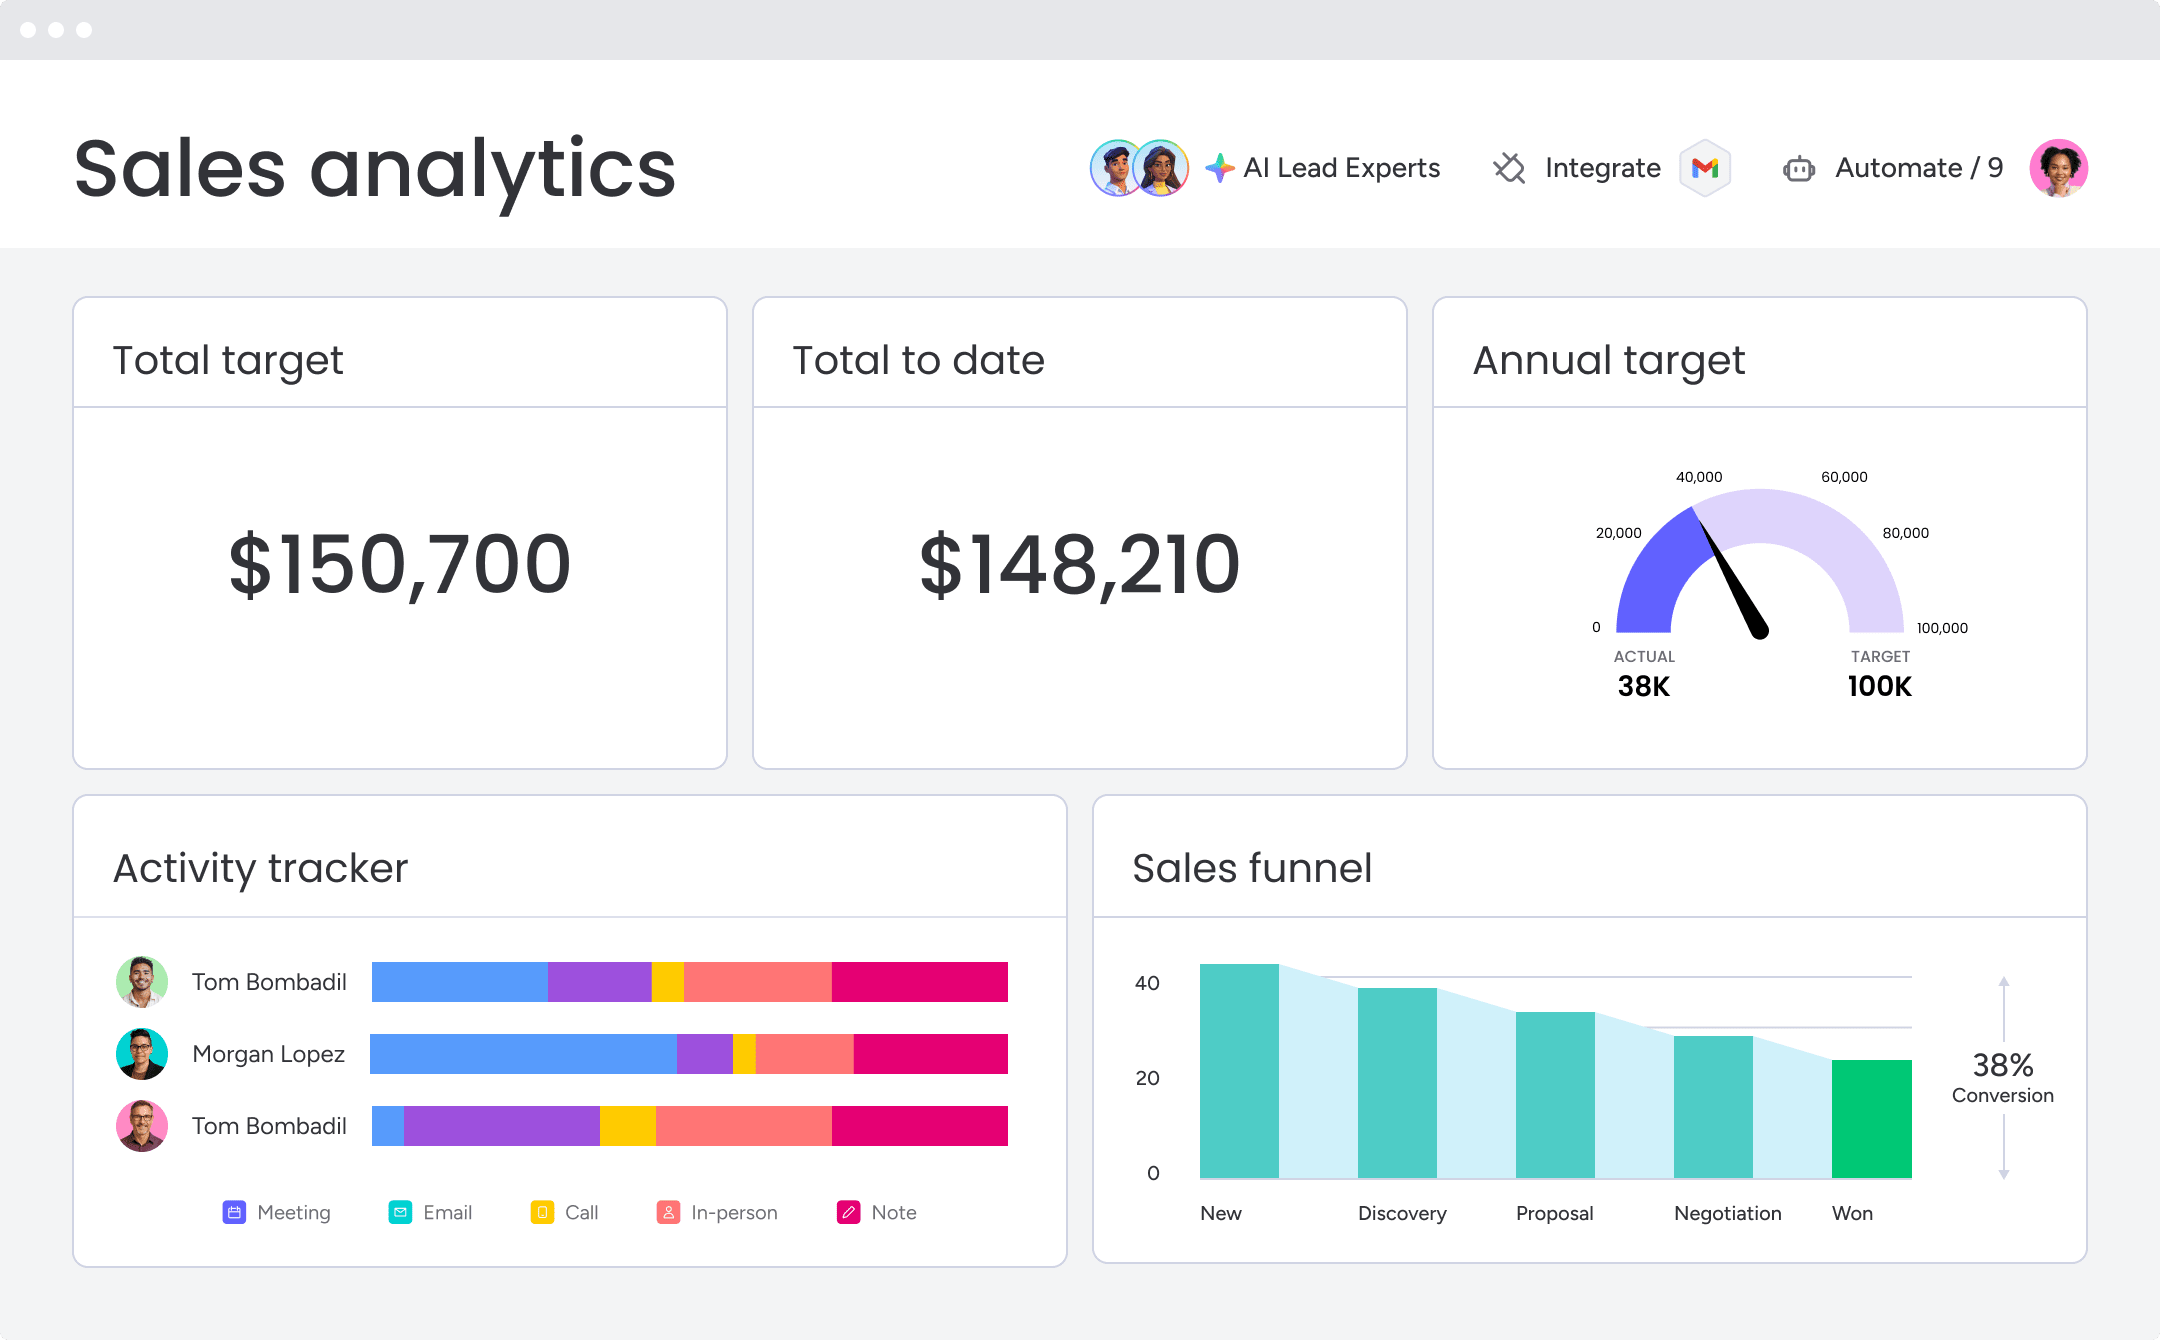
Sales analytics is the technology and processes used to gather sales data and gauge sales performance. This means collecting information from every customer touchpoint — emails, calls, meetings, and deals — then turning it into insights you can actually use. With the number of distinct sales channels for B2B companies having risen to ten in recent years, according to McKinsey, consolidating this data is more critical than ever.
At its core, sales analytics answers three critical questions:
- What happened? Your team’s past performance and results
- Why did it happen? The factors driving those outcomes
- What should we do next? Actions to improve future results
Why sales analytics matters
Revenue predictability changes everything for sales leaders. When you know which deals will close and when, you can make confident decisions about hiring, budgets, and growth investments.
Without clear visibility into your pipeline, you’re essentially guessing. Sales analytics replaces guesswork with data-driven insights that help you forecast accurately and allocate resources where they’ll have the most impact.
To really know if your sales process actually works, analytics can reveal which activities drive results and which ones waste time. You can see exactly where deals get stuck and what separates top performers from everyone else.
4 types of sales analytics you should be using
Understanding these 4 types helps you choose the right approach for your team’s needs. Each builds on the previous one, creating a complete picture of your sales performance.
Descriptive
Descriptive analytics tells you what happened in the past. This includes basic metrics like monthly revenue, number of deals closed, and individual rep performance.
Most CRM systems provide this type of analytics through standard reports. You’ll see summaries of past performance that help establish baselines and identify obvious trends.
Diagnostic
Diagnostic analytics explains why things happened. It digs deeper to uncover the reasons behind your results — why certain deals were lost, what made some reps more successful, or how market changes affected performance.
This analysis helps you understand cause and effect relationships in your sales process. monday CRM makes diagnostic analysis easier by connecting data points across your entire sales workflow.
Predictive
Predictive analytics forecasts what will happen based on historical patterns. It uses past data to predict future outcomes like which deals are most likely to close or which customers might churn.
AI-powered platforms can spot patterns humans miss. These predictions help you prioritize efforts and prepare for what’s coming.
Prescriptive
Prescriptive analytics recommends what you should do. It goes beyond prediction to suggest specific actions — which leads to pursue first, optimal pricing strategies, or the best time to follow up with prospects.
This is where AI really shines, turning complex data into simple, actionable recommendations. The goal is to help your team make smarter decisions faster.
15 essential sales metrics to track
These B2C and B2B sales metrics give you complete visibility into sales performance. Focus on the ones that align with your specific business goals and sales model.
1. Revenue growth
Revenue growth shows the percentage increase in sales over time. Calculate it by comparing current revenue to previous periods — monthly, quarterly, or yearly.
This fundamental metric indicates whether your business is expanding or contracting. Consistent growth demonstrates market demand and effective sales execution.
2. Sales cycle duration
Sales cycle duration measures how long it takes to close deals from first contact. Track the average number of days between initial outreach and signed contract.
Shorter cycles mean faster revenue and more efficient processes. monday CRM automatically tracks deal progression through each stage, making it easy to spot bottlenecks.
3. Lead conversion rate
Lead conversion rate shows what percentage of leads become customers. Divide closed deals by total leads, then multiply by 100.
This metric reveals the quality of your leads and effectiveness of your sales process. Higher rates mean your marketing and sales efforts are well-aligned.
4. Average deal size
Average deal size is the typical value of your closed deals. Add up all deal values and divide by the number of deals.
Understanding deal size helps with forecasting and resource planning. Track changes over time to spot trends in customer buying behavior.
5. Sales by region
Sales by region breaks down performance across different geographic areas. This shows which territories generate the most revenue and where opportunities exist.
Use regional data to optimize territory assignments and identify expansion opportunities. Some regions may need different strategies or additional support.
6. Customer acquisition cost
Customer acquisition cost (CAC) totals all expenses to win a new customer. Include marketing spend, sales salaries, and overhead costs.
Compare CAC to customer lifetime value to ensure profitable growth. If it costs more to acquire customers than they’re worth, you need to adjust your approach.
7. Pipeline velocity
Pipeline velocity measures how quickly deals move through your sales process. Multiply the number of deals by average value and win rate, then divide by cycle length.
Faster velocity means more predictable revenue. This metric helps you forecast future performance and identify process improvements.
8. Win rate
Win rate shows the percentage of opportunities that become closed deals. Track this overall and by individual rep to identify coaching opportunities.
Higher win rates indicate effective selling and strong product-market fit. Low rates might signal pricing issues or poor qualification.
9. Sales per representative
Sales per representative measures individual productivity. Divide total revenue by the number of reps to see average performance.
This helps set realistic quotas and identify training needs. Top performers can share their strategies with the rest of the team.
10. Customer lifetime value
Customer lifetime value (CLV) estimates total revenue from a customer relationship. Multiply average purchase value by purchase frequency and relationship duration.
CLV helps prioritize customer segments and justify acquisition costs. Focus more resources on high-value customer profiles.
11. Retention rate
Retention rate tracks the percentage of customers who keep buying. This directly impacts revenue predictability and growth sustainability.
High retention indicates strong customer satisfaction. Low retention might signal product or service issues that need attention.
12. Quote-to-close ratio
Quote-to-close ratio measures how many proposals convert to sales. This reveals the effectiveness of your pricing and proposal process.
Low ratios might indicate pricing problems or poor qualification. Track this by rep and product to identify patterns.
13. Sales by product or service
Sales by product breaks down revenue across your offerings. This guides inventory decisions and product development priorities.
Identify your bestsellers and underperformers. Use this data to optimize your product mix and sales focus.
14. Marketing and sales analytics alignment
Alignment metrics measure how well marketing and sales work together. Track lead quality scores and attribution across the customer journey.
monday CRM provides shared visibility that helps both teams stay aligned. When marketing and sales use the same data, results improve.
15. Forecast accuracy
Forecast accuracy compares predicted revenue to actual results. Measure the variance between forecasts and reality over time.
Accurate forecasting builds credibility and enables strategic planning. Consistent accuracy helps you make confident business decisions.
6 steps to implement data analytics in sales
Follow these steps to build an analytics program that actually drives results. Each step builds on the previous one, creating a strong foundation for data-driven selling.
Step 1: Centralize your data
Bring all your sales data into one place. This includes information from your CRM, email, calendar, and any other sales platforms.
Data silos kill analytics programs. When information lives in separate systems, you can’t see the complete picture. monday CRM integrates with your existing platforms to create a single source of truth.
Step 2: Define clear KPIs
Choose metrics that directly connect to your business goals. Avoid vanity metrics that look good but don’t drive action.
Your KPIs should be:
- Measurable: You can track them consistently
- Actionable: They guide specific behaviors
- Relevant: They align with your objectives
- Time-bound: You review them regularly
Step 3: Select the right sales analytics platform
Pick a platform based on ease of use, integration capabilities, and scalability. The right solution grows with your business without requiring technical expertise.
monday CRM stands out for its intuitive interface and flexibility. Teams can build custom analytics workflows without coding or IT support.
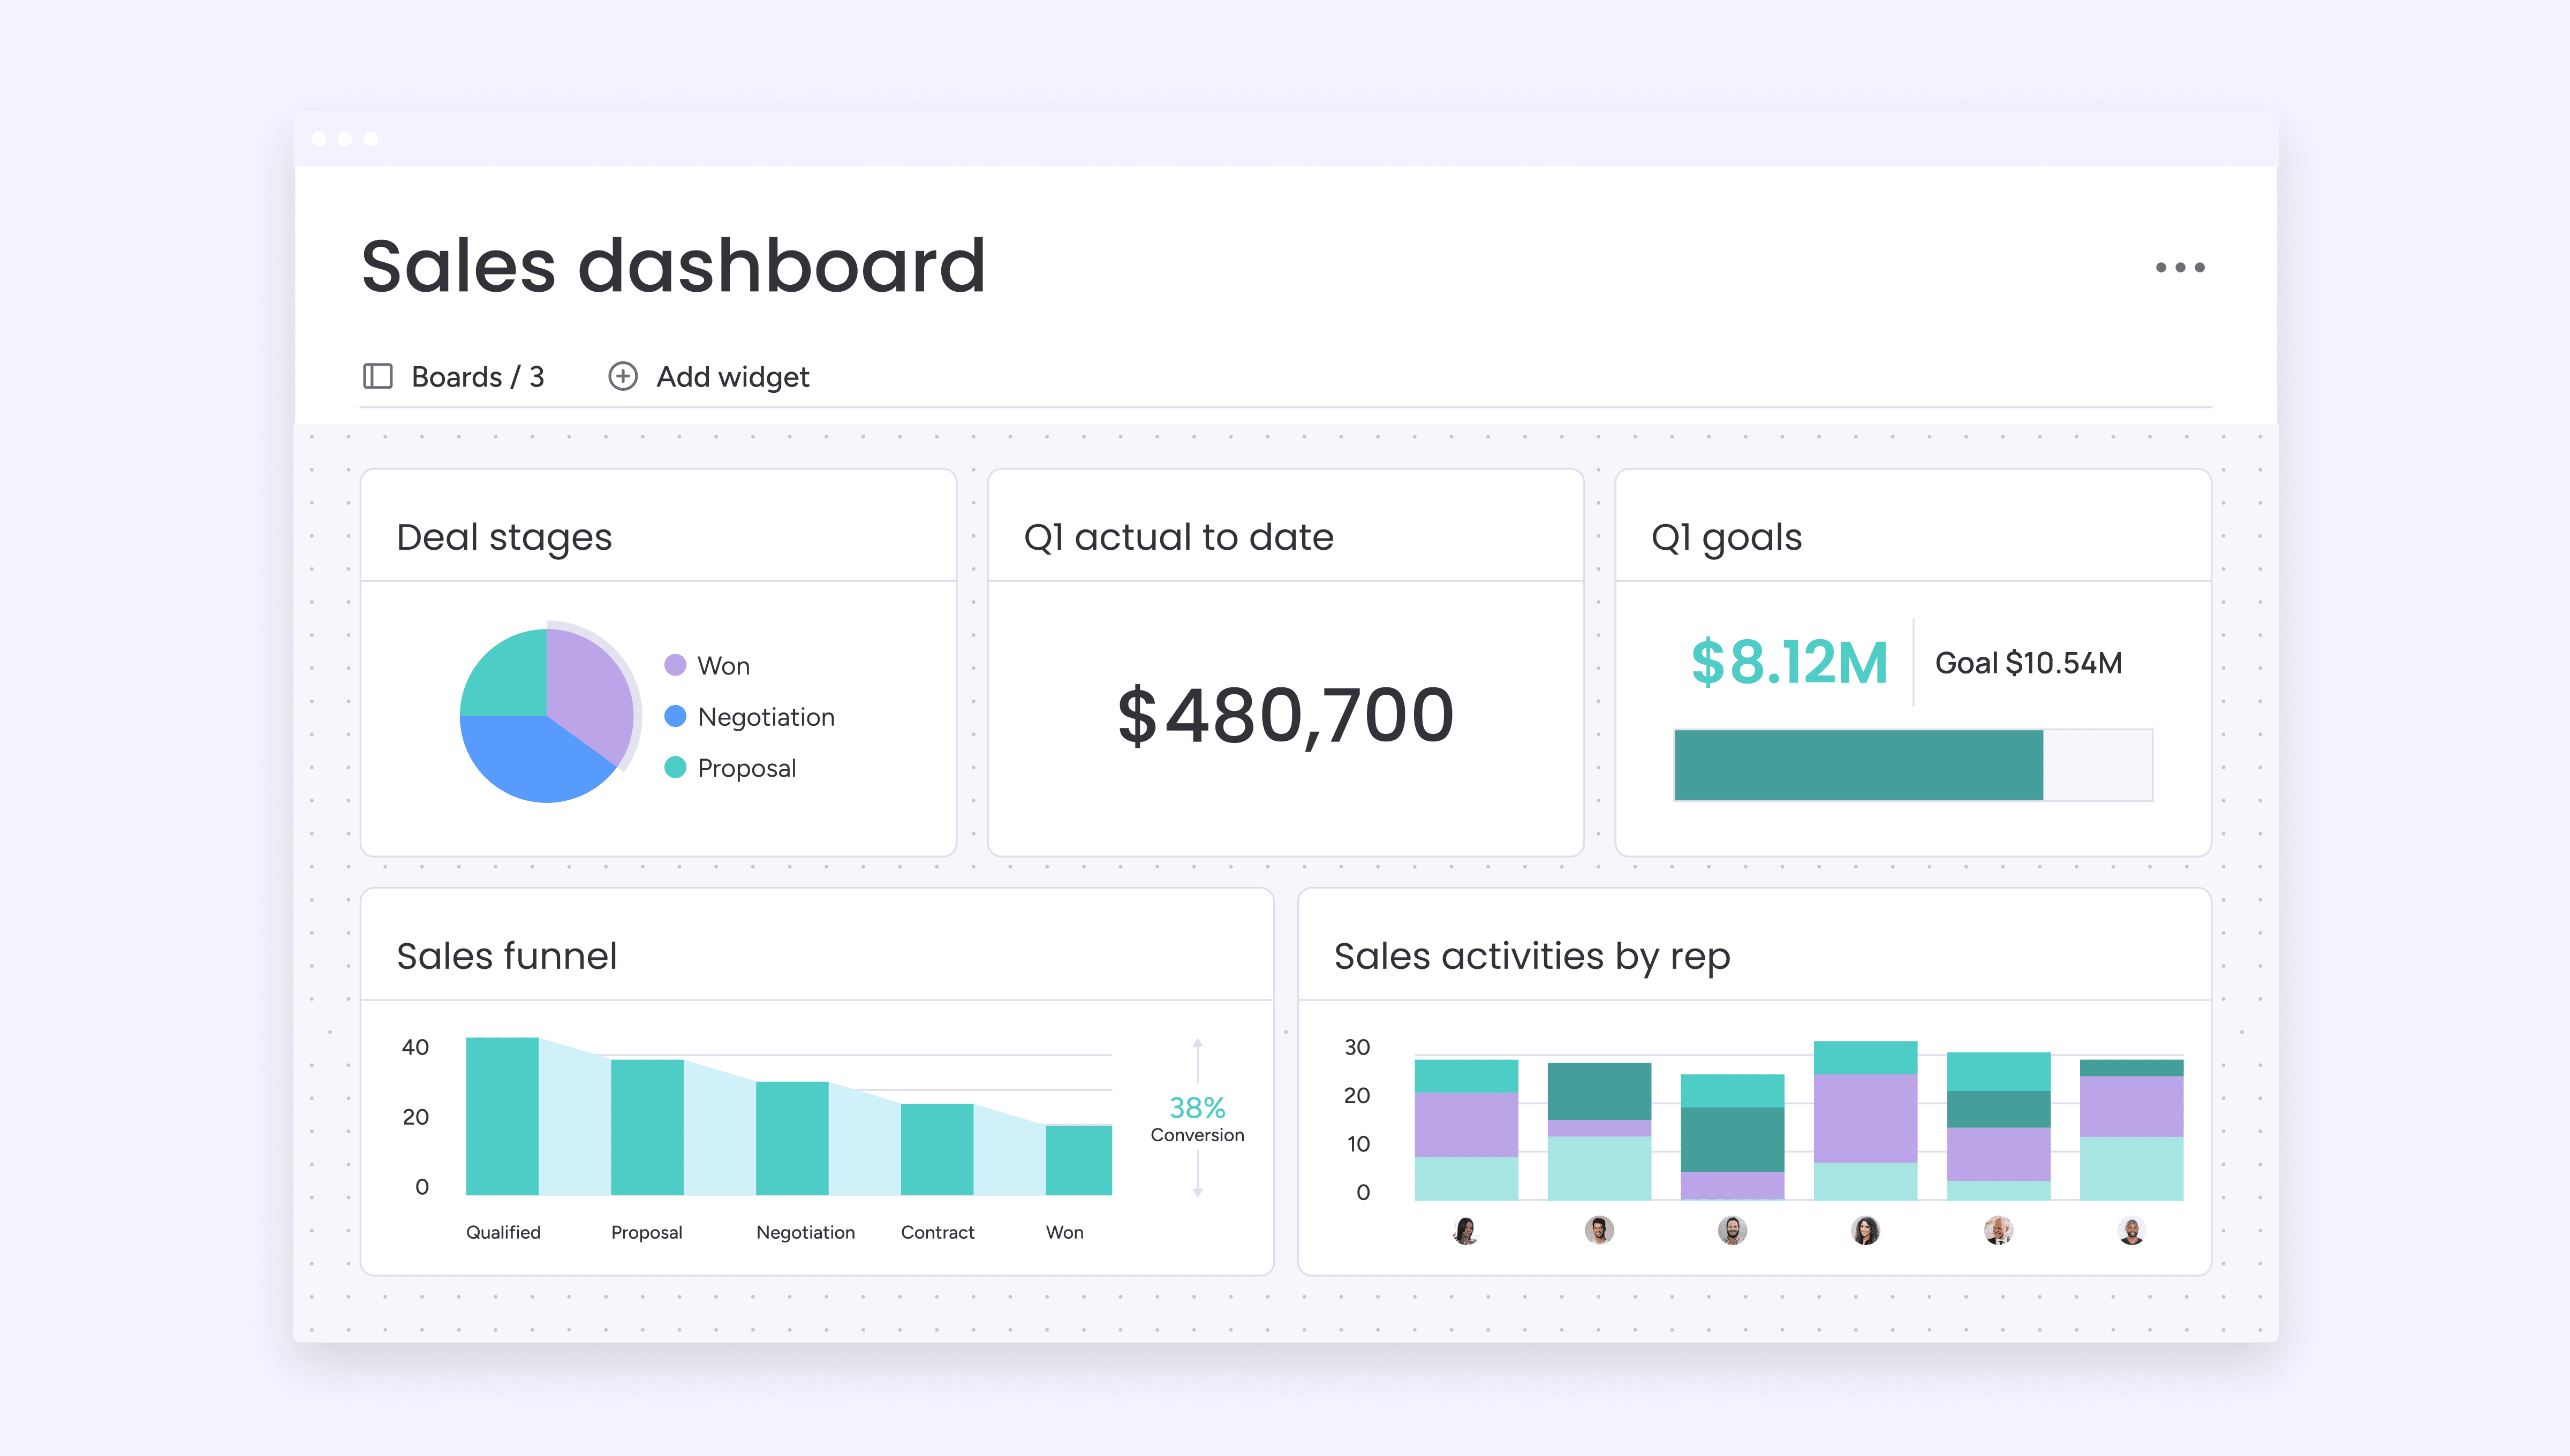
Step 4: Build dashboards and reports
Create role-specific views that show relevant information. Sales reps need different metrics than managers or executives.
Design dashboards for quick scanning. Use visual elements that make trends obvious at a glance. monday CRM’s drag-and-drop interface makes customization simple.
Step 5: Train your team and encourage adoption
Show your team how analytics makes their jobs easier, a crucial step given that 60% of employees believe more effective training would improve change management, according to monday.com’s World of Work report. Focus on practical benefits like identifying the hottest leads or spotting at-risk deals.
Start with enthusiastic early adopters who can champion the system. Provide ongoing support and celebrate wins to build momentum.
Step 6: Refine, adapt, and expand
Review your analytics program regularly. Gather feedback from your team members and adjust based on what’s working.
Add new metrics gradually as your team becomes more comfortable. Expand integrations and explore advanced features over time.
Try monday CRMCommon challenges and how to overcome them
Every sales team faces similar obstacles when implementing analytics. Here’s how to address the most common issues.
Data overload
Too much information paralyzes decision-making. Teams get overwhelmed by endless metrics and dashboards.
Focus on 5-7 core metrics that drive your business. Create clear priorities so everyone knows what to track daily versus monthly. monday CRM helps by letting you build focused, role-specific dashboards.
Low adoption among teams
People resist change, especially when they’re comfortable with current processes. Without adoption, your analytics investment provides no value.
Involve your team early in the process. On monday CRM, you can show them specific ways analytics helps them close more deals or save time. Quick wins build enthusiasm.
Siloed systems
Disconnected platforms create inconsistent data and incomplete pictures. When your CRM doesn’t talk to other systems, insights suffer.
Prioritize integration when choosing your platform. monday CRM connects with popular sales and marketing platforms, ensuring data flows smoothly between systems.
Unclear ROI
Measuring analytics value can be challenging. Benefits often appear indirectly or take time to materialize.
Track improvements in specific areas like forecast accuracy or sales cycle length. Connect these improvements to revenue impact whenever possible.
What to look for in a sales analytics platform
The right platform makes analytics accessible to everyone on your team. Here are the key features to evaluate.
User-friendly interface
Complex interfaces kill adoption. Your platform should be intuitive enough that reps can use it without extensive training.
Look for visual workflows and drag-and-drop customization. monday CRM prioritizes user experience, making powerful analytics feel simple.
CRM sales analytics integration
Your analytics platform must connect seamlessly with your CRM. Without integration, you’ll waste time on manual data entry.
Native integrations work more reliably than third-party connectors. monday CRM combines CRM and analytics in one platform, eliminating integration challenges.
AI and automations
AI transforms raw data into actionable insights. Look for platforms that use AI to surface patterns and make recommendations.
Automation saves time on routine tasks like data entry and report generation. monday CRM’s AI Blocks can categorize leads, extract insights, and summarize complex information automatically.
Leveraging AI and automations for advanced sales analytics
AI takes analytics beyond basic reporting to deliver predictive insights and recommendations, but with only 51% of sales professionals currently using AI, there’s a clear opportunity for teams to gain a competitive edge. Here’s how to use these capabilities effectively.
AI-powered insights
Machine learning finds patterns humans miss. AI analyzes thousands of data points to identify what really drives success.
These insights help you understand:
- Deal progression patterns: What makes deals move forward or stall
- Risk indicators: Early warning signs that deals might fail
- Success factors: Common elements in your biggest wins
monday CRM’s AI capabilities surface these insights automatically, helping teams act on opportunities faster.
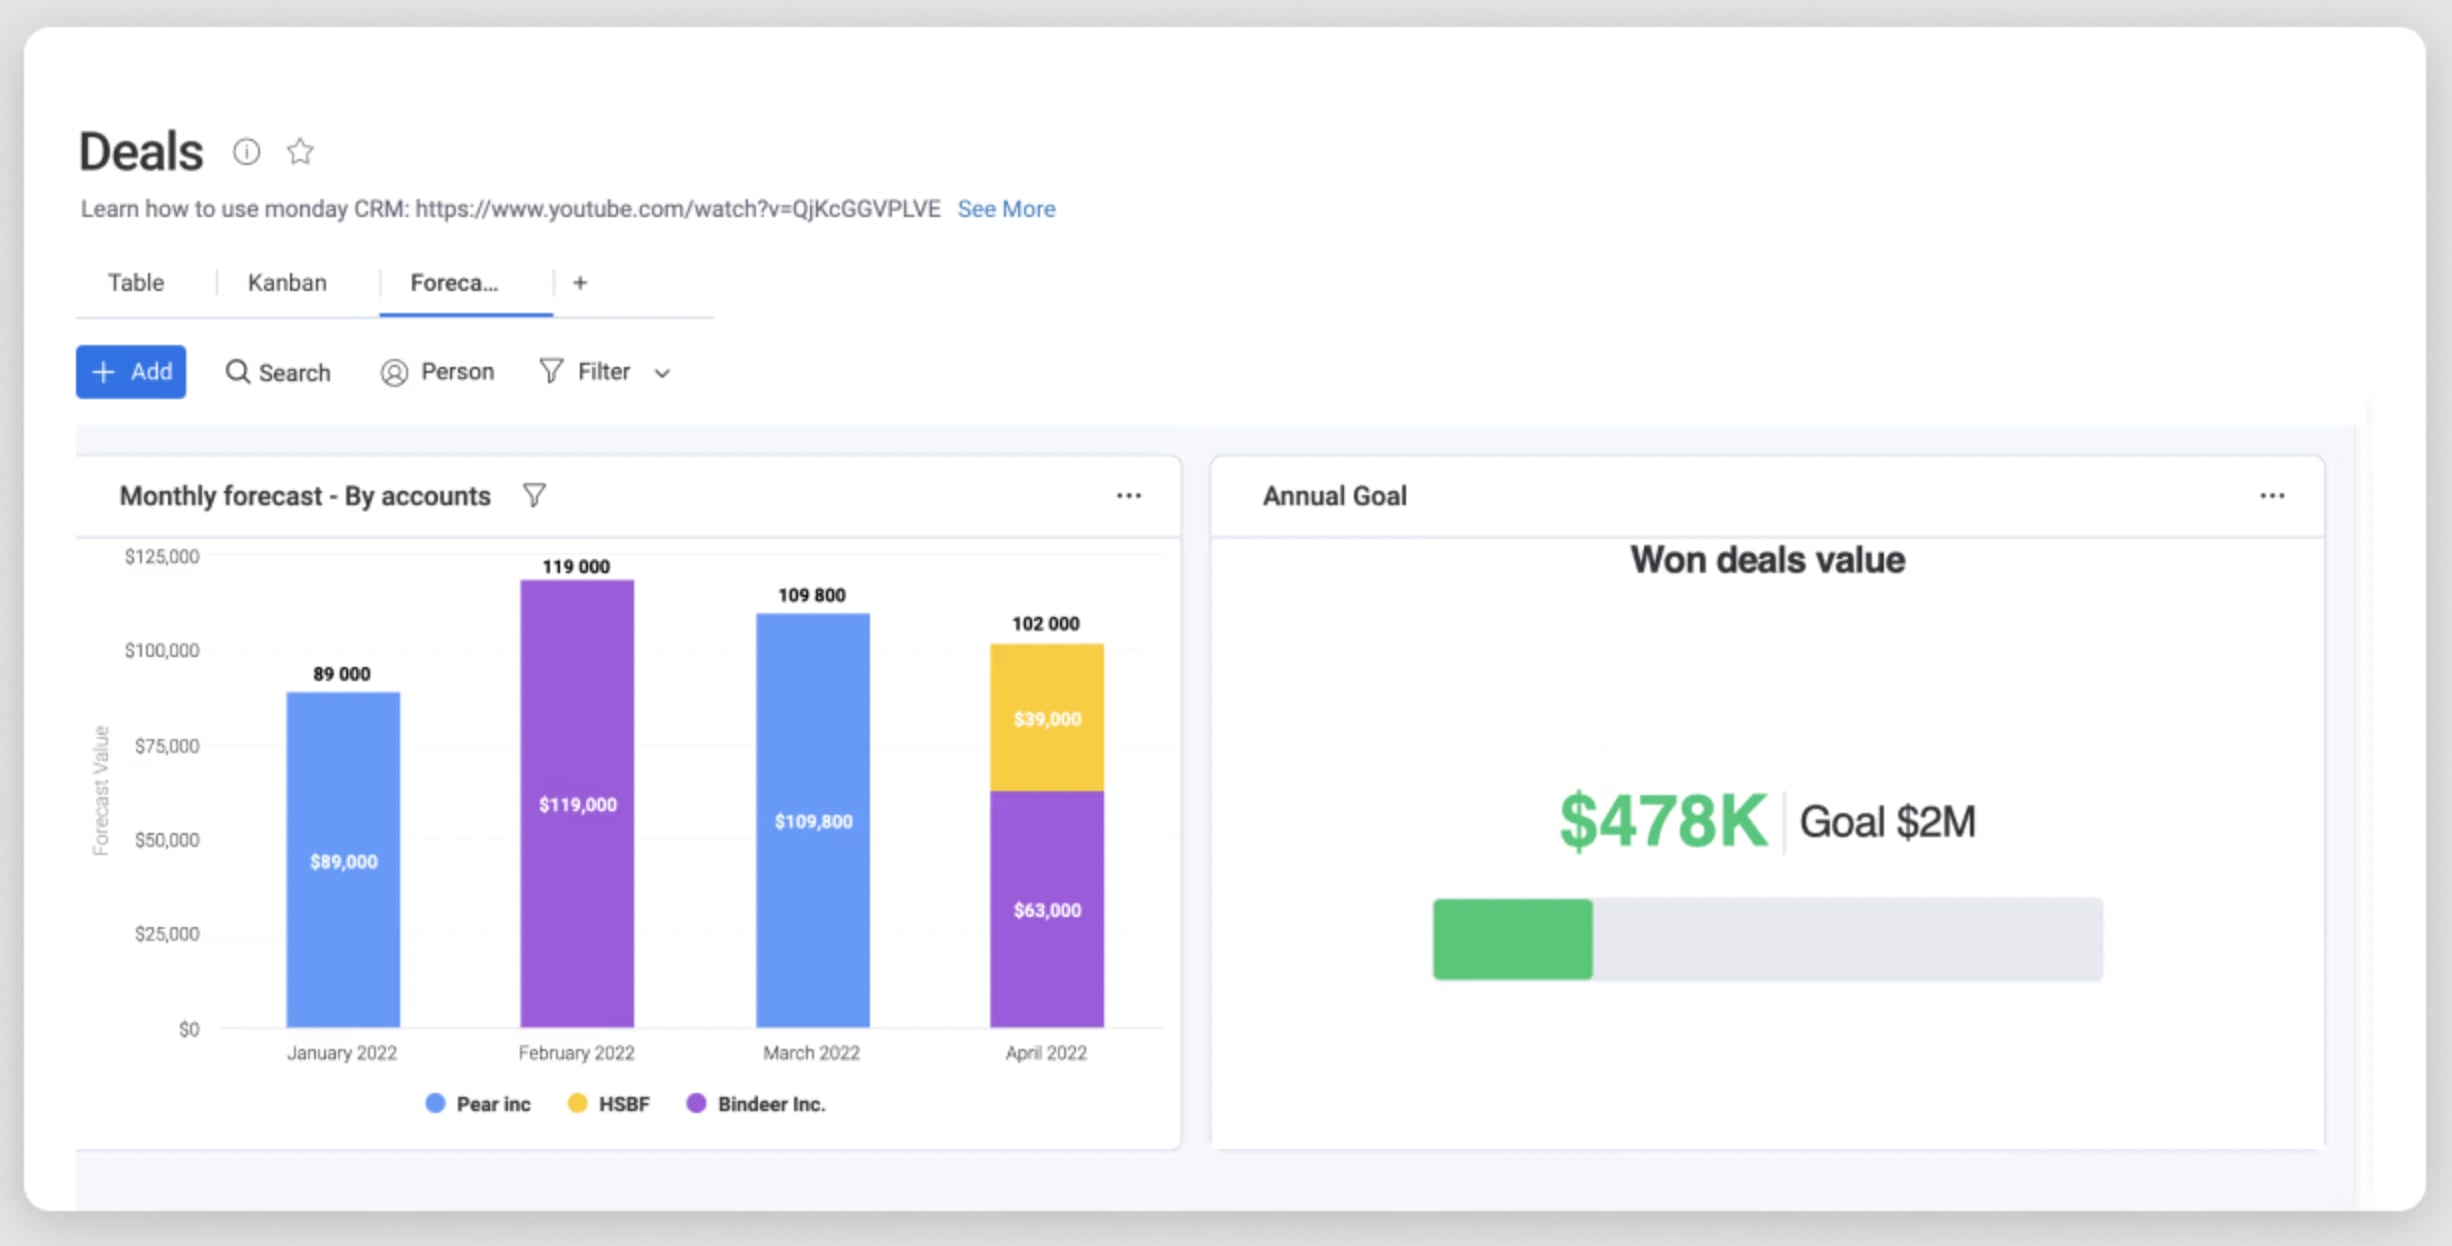
Predictive forecasting models
AI improves forecast accuracy by considering multiple variables simultaneously. Traditional forecasting often relies on gut feel or simple calculations.
Predictive models analyze historical patterns, current pipeline health, and market conditions. They adapt as new data comes in, providing increasingly accurate predictions.
Automated data entry and reporting
Manual data entry wastes selling time and introduces errors, with research showing that non-value-adding activities account for about two-thirds of sales teams’ time. Automation captures information from emails, calls, and meetings without human input, freeing up reps to focus on selling.
Try monday CRM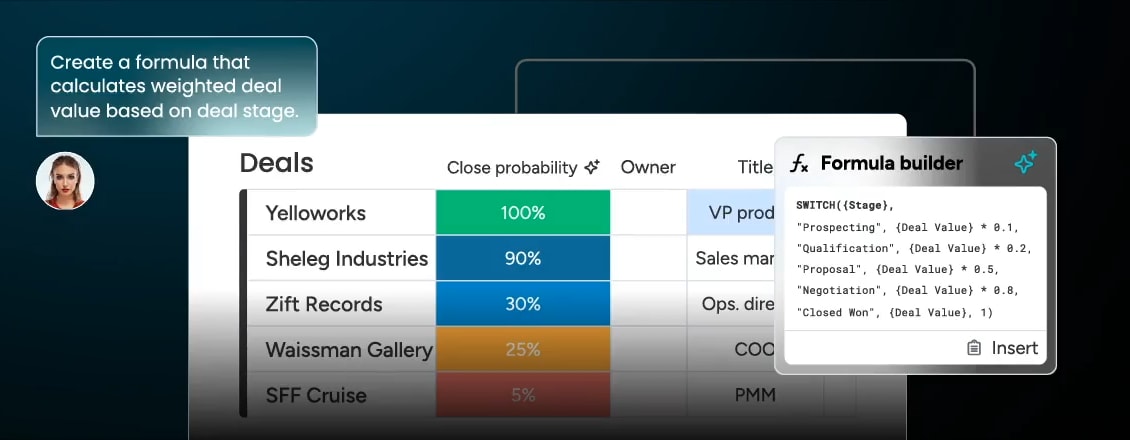
Accelerate growth with a unified CRM
Sales analytics transforms how revenue teams operate. The right approach combines powerful capabilities with ease of use, ensuring everyone can access and act on insights.
monday CRM brings together CRM functionality and advanced analytics in one intuitive platform. With AI-powered insights, automated workflows, and flexible customization, teams get the visibility they need to drive predictable growth.
Frequently asked questions
What is the difference between sales analysis and sales analytics?
Sales analysis examines past data to understand what happened, while sales analytics uses technology to gather data continuously and provide ongoing insights including predictions and recommendations for future actions.
How can small businesses implement sales analytics without dedicated data analysts?
Small businesses can use platforms like monday CRM that offer built-in analytics with intuitive interfaces, pre-built dashboards, and AI-powered insights that don't require technical expertise to set up or interpret.
What sales metrics should SaaS companies prioritize?
SaaS companies should focus on metrics like monthly recurring revenue growth, customer acquisition cost, churn rate, customer lifetime value, and pipeline velocity to track both growth and sustainability.
How long does it take to see results from implementing sales analytics?
Most teams see initial insights within 30 days of implementation, with significant improvements in forecast accuracy and sales performance typically appearing within 90 days as data accumulates and adoption increases.
Can sales analytics help with territory planning and assignment?
Yes, sales analytics provides data on regional performance, market potential, and rep capacity that helps optimize territory assignments and identify expansion opportunities based on actual performance data.
What's the minimum amount of historical data needed for meaningful sales analytics?
While you can start gaining insights immediately, having at least 6 months of historical data provides more reliable trend analysis and 12 months enables accurate seasonal pattern recognition and forecasting.