
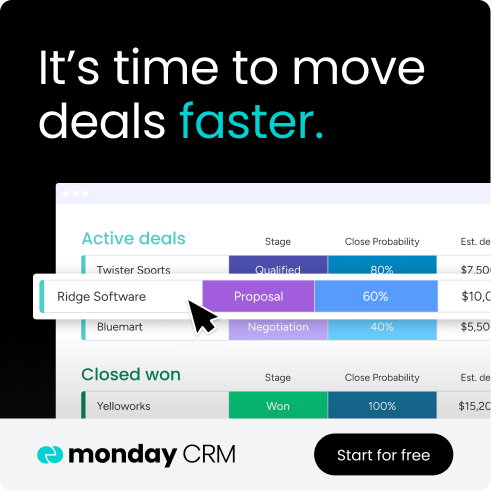
Your CRM holds the answers to your biggest revenue questions: which deals will close, where your pipeline’s stalling, and whether you’ll hit quota this quarter. CRM analytics — the metrics you track and act on — transform that raw data into clear insights that help you forecast accurately and close more deals.
This guide covers what CRM analytics are, why they matter for revenue teams, and the 7 metrics worth tracking consistently. You’ll learn the 4 types of analytics, how to use them to improve sales performance, and how monday CRM helps you track the metrics that matter.
Key takeaways
- CRM analytics are the metrics you extract from your CRM data to understand sales performance, predict outcomes, and make better decisions.
- Track pipeline value, velocity, win rate, conversion rate, forecast accuracy, sales cycle length, and customer lifetime value for a complete picture of sales health.
- The 4 types of analytics — descriptive, diagnostic, predictive, and prescriptive — answer different questions, from “what happened?” to “what should we do?”
- Use CRM analytics to improve forecasting accuracy, spot pipeline problems early, coach reps with data, and align teams around shared metrics.
- monday CRM’s real-time dashboards, AI-powered insights, and automated tracking make it easy to monitor the metrics that drive revenue without technical setup.
What are CRM analytics?
CRM analytics are the metrics and insights you extract from your customer relationship data to understand sales performance, predict future outcomes, and identify the actions that drive revenue. Instead of staring at raw CRM data, you track specific metrics that help your revenue team forecast accurately, catch pipeline problems early, and close more deals.
These metrics come from analyzing the data already in your CRM: deal stages, win rates, sales cycle length, customer interactions, and revenue patterns. The goal is to turn that data into actionable insights that improve how your team sells.
For revenue teams, CRM analytics answer the questions that matter most:
- Which deals will actually close this quarter?
- Where is the pipeline stuck?
- Which reps need coaching, and on what?
- Are we on track to hit quota?
Here’s a quick look at the key CRM analytics you should be tracking, and we’ll take a deeper look later in the article:
| Metric | What it measures | Why it matters |
|---|---|---|
| Pipeline value | Total value of open opportunities | Shows whether you have enough pipeline to hit targets |
| Pipeline velocity | Speed at which deals move through the pipeline | Identifies bottlenecks and revenue efficiency |
| Win rate | Percentage of opportunities won | Measures sales effectiveness |
| Conversion rate | Percentage of leads or opportunities that advance | Highlights lead quality and process performance |
| Sales cycle length | Average time to close a deal | Reveals sales efficiency |
| Forecast accuracy | Difference between forecasted and actual revenue | Improves planning and resource allocation |
| Customer lifetime value (CLV) | Total revenue generated by a customer | Helps prioritize retention and growth efforts |
CRM analytics vs. CRM reporting
CRM reporting and CRM analytics do different things. Reporting tells you what happened. Analytics explains why and predicts what’s next. Here’s the breakdown:
| Dimension | CRM reporting | CRM analytics |
|---|---|---|
| Purpose | Shows historical data and metrics | Explains patterns and predicts outcomes |
| Timeframe | Backward-looking (what happened) | Forward-looking (what may happen next) |
| Actionability | Provides data for review | Provides insights and recommendations |
| Complexity | Descriptive (counts, totals, averages) | Diagnostic, predictive, and prescriptive |
Want to know last quarter’s win rate? That’s reporting. Want to know which deals will close this quarter and what might derail them? That’s analytics. Most teams need both. Reporting for accountability and historical tracking. Analytics for decision-making and staying ahead of problems.
Why CRM analytics matter for revenue teams
CRM analytics move revenue teams from reactive to proactive. Instead of asking “what happened?” after the quarter ends, teams ask “what should we do?” while there’s still time to act. Here’s why tracking the right metrics matters:
Forecast sales with more confidence
CRM analytics improve forecast accuracy by tracking historical win rates, deal progression patterns, and current pipeline health. Instead of relying on rep estimates, you calculate close probabilities based on how similar deals performed in the past.
The shift from gut feel forecasting to data-backed predictions changes how leadership operates:
- Resource allocation becomes more precise.
- Targets become more realistic.
- Board conversations become more confident.
When you track metrics like pipeline coverage, deal velocity, and win rate consistently, forecasts become reliable enough to plan around.
Track pipeline health in real time
Pipeline health means the right volume of deals at each stage, good deal velocity, and balanced rep workloads. CRM analytics show you bottlenecks, stalled deals, and coverage gaps instantly.
For example, your metrics might show:
- Deals in the proposal stage are taking 40% longer than usual, signaling a potential pricing or objection-handling issue.
- One rep has 3x the pipeline of another, indicating a workload imbalance.
- Pipeline coverage has dropped below 3x quota, meaning you need more deals to hit your target.
When you track these metrics in real time, managers can intervene before problems become missed quotas.
Coach sales performance with useful data
CRM analytics help managers shift from subjective coaching to data-backed guidance. The metrics that make coaching more effective:
- Activity patterns: Which activities correlate with wins
- Stage conversion rates: Where reps struggle in the sales process
- Win rate by rep: Who’s closing deals and who needs help
- Sales cycle length: Whether reps are moving deals efficiently
Instead of guessing what’s wrong, managers use metrics to coach specific behaviors that drive results.
Improve customer retention and expansion
CRM analytics aren’t just for new sales. Tracking customer lifetime value, retention rates, and product usage patterns helps teams identify upsell opportunities and prevent churn.
For example: Accounts with declining product usage may be 3x more likely to churn, so customer success prioritizes proactive outreach. Or, perhaps customers who adopt a specific feature have 2x higher renewal rates, so onboarding focuses on driving that behavior.
When you track the right metrics across the customer lifecycle, you don’t just close more deals — you keep them longer and grow them bigger.
How CRM analytics support the entire customer lifecycle
CRM analytics don’t stop at the sale. The best revenue teams use customer data analysis to track performance across every stage of the customer journey, from first contact to renewal and expansion. When you monitor the right metrics at each stage, you catch problems early, identify growth opportunities, and maximize customer lifetime value.
| Lifecycle stage | Key metrics | What they tell you |
|---|---|---|
| Acquisition | Lead conversion rate, cost per acquisition, time to first contact | Which channels deliver quality leads and how efficiently you convert them |
| Sales | Win rate, sales cycle length, pipeline velocity | How effectively your team closes deals and where bottlenecks exist |
| Onboarding | Time to value, feature adoption rate, onboarding completion | Whether customers are getting value quickly and adopting key features |
| Retention | Churn rate, renewal rate, product usage trends | Which accounts are at risk and which are healthy |
| Expansion | Upsell rate, cross-sell rate, expansion revenue | Where growth opportunities exist within your customer base |
Customer data analysis across these stages helps teams shift from reactive firefighting to proactive growth. When marketing, sales, and customer success work from the same metrics, everyone stays aligned on what drives revenue.
Types of CRM analytics
CRM analytics break into 4 categories, each answering different business questions. These types move from understanding the past to prescribing future actions. Knowing which type you need helps you ask the right questions and act on the right data.
| Type | Question it answers | Example |
|---|---|---|
| Descriptive | What happened? | Last quarter's win rate was 25% |
| Diagnostic | Why did it happen? | Win rate dropped because deal sizes decreased |
| Predictive | What will happen? | Based on current pipeline, we'll close $500K this quarter |
| Prescriptive | What should we do? | Focus on deals over $50K to hit quota |
Descriptive analytics
Descriptive analytics look at historical data to understand past performance. This is the most common type, covering metrics like:
- Closed deals and win rates
- Revenue by region and average deal size
- Activity summaries by rep
- Pipeline snapshots at quarter-end
Descriptive analytics are foundational. You need to know what happened before you can understand why or predict what’s next. But they don’t explain root causes or forecast future outcomes.
Diagnostic analytics
Diagnostic analytics dig into data to find out why something happened. When win rates drop, diagnostic analytics identify whether the cause is pricing, competition, lead quality, or sales execution.
For example, they might show:
- Deals without a demo scheduled in the first week are 50% less likely to close.
- Deals lost to a specific competitor share common characteristics.
- Reps with lower win rates spend less time on discovery calls.
This type of analysis helps teams fix problems rather than just observe them.
Predictive analytics
Predictive analytics use historical data and patterns to forecast what’s coming. They answer questions like:
- “Which deals will close?”
- “What will our revenue be next quarter?”
- “Which leads are most likely to convert?”
Applications include lead scoring to predict which leads will convert, deal risk alerts to flag opportunities likely to slip, and revenue forecasting to project quarterly revenue based on pipeline trends. AI and machine learning power most predictive analytics, learning from historical outcomes to improve predictions over time.
Prescriptive analytics
Prescriptive analytics tell you what to do based on data insights, suggesting the best move to get the results you want. For example:
- Contact leads within 2 hours for the highest conversion probability.
- Prioritize deals over $50K to hit quota.
- Assign leads to specific reps based on their win rate with similar prospects.
Prescriptive analytics often combine AI with business rules, turning insights into recommendations you can act on.
7 key CRM analytics metrics to track
While CRM systems can track hundreds of metrics, these 7 are the vital signs of sales health. Each metric provides a specific view into pipeline performance, and together they give you a complete picture of revenue operations. Track all 7 consistently and you’ll always know where you stand.
1. Pipeline value
What it measures: The total dollar amount of all open opportunities.
Why it matters: This metric shows whether you have enough potential revenue to hit targets.
What to do:
- If it’s low: increase prospecting activity, accelerate deal progression, or adjust targets.
- If it’s high: ensure deals are qualified and not inflating the pipeline artificially.
2. Pipeline velocity
What it measures: The speed at which deals move through the sales process, typically measured in days per stage or total cycle length.
Why it matters: Faster velocity means more deals close in less time, increasing revenue efficiency.
What to do: Track your own baseline and improve from there. If velocity is slow, identify bottleneck stages, reduce approval delays, and improve qualification.
3. Win rate
What it measures: The percentage of opportunities that close as won versus lost.
Why it matters: This metric indicates sales effectiveness and competitive positioning.
What to do: If your win rate is low, analyze lost deals for patterns, improve competitive positioning, and refine qualification criteria.
4. Conversion rate
What it measures: The percentage of leads that become customers, or the percentage of deals that move from one stage to the next.
Why it matters: This metric reveals both lead quality and sales process effectiveness.
What to do: If your rate is low, improve lead qualification criteria, refine messaging, and enhance sales training.
5. Sales cycle length
What it measures: The average time from first contact to closed deal.
Why it matters: Shorter cycles mean faster revenue and more efficient use of sales resources.
What to do: If cycles are too long, identify bottleneck stages, reduce approval delays, and improve qualification.
6. Forecast accuracy
What it measures: How closely actual results match predicted results.
Why it matters: High accuracy enables resource planning and builds leadership confidence.
What to do: If accuracy is low, improve data hygiene, refine forecasting methodology, and track leading indicators like pipeline coverage and deal velocity.
7. Customer lifetime value (CLV)
What it measures: The total revenue a customer generates over their relationship with your company.
Why it matters: Customer lifetime value helps prioritize high-value customers and informs acquisition spending.
What to do: Focus retention efforts on high-CLV customers, identify upsell opportunities, and adjust pricing for segments with low CLV.
How to use CRM analytics to improve sales performance
Tracking metrics is only valuable if you act on them. Here’s how to use CRM analytics to improve the outcomes that matter: more accurate forecasts, healthier pipelines, and more closed deals.
Use pipeline coverage to forecast accurately
Pipeline coverage is the ratio of pipeline value to quota. Healthy coverage is typically 3–4x, meaning if your quota is $1M, you need $3–4M in pipeline to hit your target.
Track coverage in real time and alert teams when it drops below target. If your team has a $1M quota but only $2.5M in pipeline, you know you have a coverage gap and need to increase prospecting activity. Catch gaps early rather than scrambling at quarter-end.
Monitor deal velocity to spot bottlenecks
Track how long deals spend in each stage and compare that to your baseline. For example, if deals are taking 40% longer than usual in the proposal stage, you have a bottleneck that needs attention.
Common causes include pricing objections, missing stakeholders, or unclear next steps. Use velocity metrics to identify where deals stall, then coach reps on how to move them forward.
Track win rate by segment to refine targeting
Break down win rate by industry, company size, deal size, and lead source. You might discover that:
- Deals in healthcare close at 35% while deals in retail close at 15%.
- Deals over $50K have a 40% win rate while deals under $10K have a 20% win rate.
- Leads from webinars convert at twice the rate of leads from paid ads.
Use these insights to refine your ideal customer profile, adjust targeting, and allocate resources to the segments that convert best.
Use conversion rates to improve each stage
Track conversion rates between each stage of your sales process. If 50% of demos convert to proposals but only 20% of proposals convert to closed-won, you know where to focus coaching.
Low conversion at a specific stage signals a problem with that part of your process. Maybe your proposals don’t address objections clearly. Maybe your pricing isn’t competitive. Use conversion metrics to diagnose problems and test solutions.
Monitor forecast accuracy to refine your methodology
Compare your forecasted revenue to actual results each quarter. If you’re consistently off by more than 10%, your forecasting methodology needs work.
Common causes of poor forecast accuracy include:
- Reps overestimating close probabilities
- Poor data hygiene (outdated deal stages, missing close dates)
- Not accounting for historical win rates
Use forecast accuracy as a feedback loop to improve your methodology over time.
Track customer lifetime value to prioritize retention
Calculate CLV for different customer segments and use it to prioritize retention efforts. If enterprise customers have 5x the CLV of SMB customers, allocate more customer success resources to enterprise accounts.
Also use CLV to inform acquisition spending. If a customer segment has low CLV, either improve retention in that segment or stop acquiring those customers.
How monday CRM helps you track CRM analytics

monday CRM makes it easy to track the metrics that matter without technical setup. The platform combines real-time dashboards, AI-powered insights, and automated tracking to help revenue teams monitor pipeline health, forecast accurately, and close more deals.
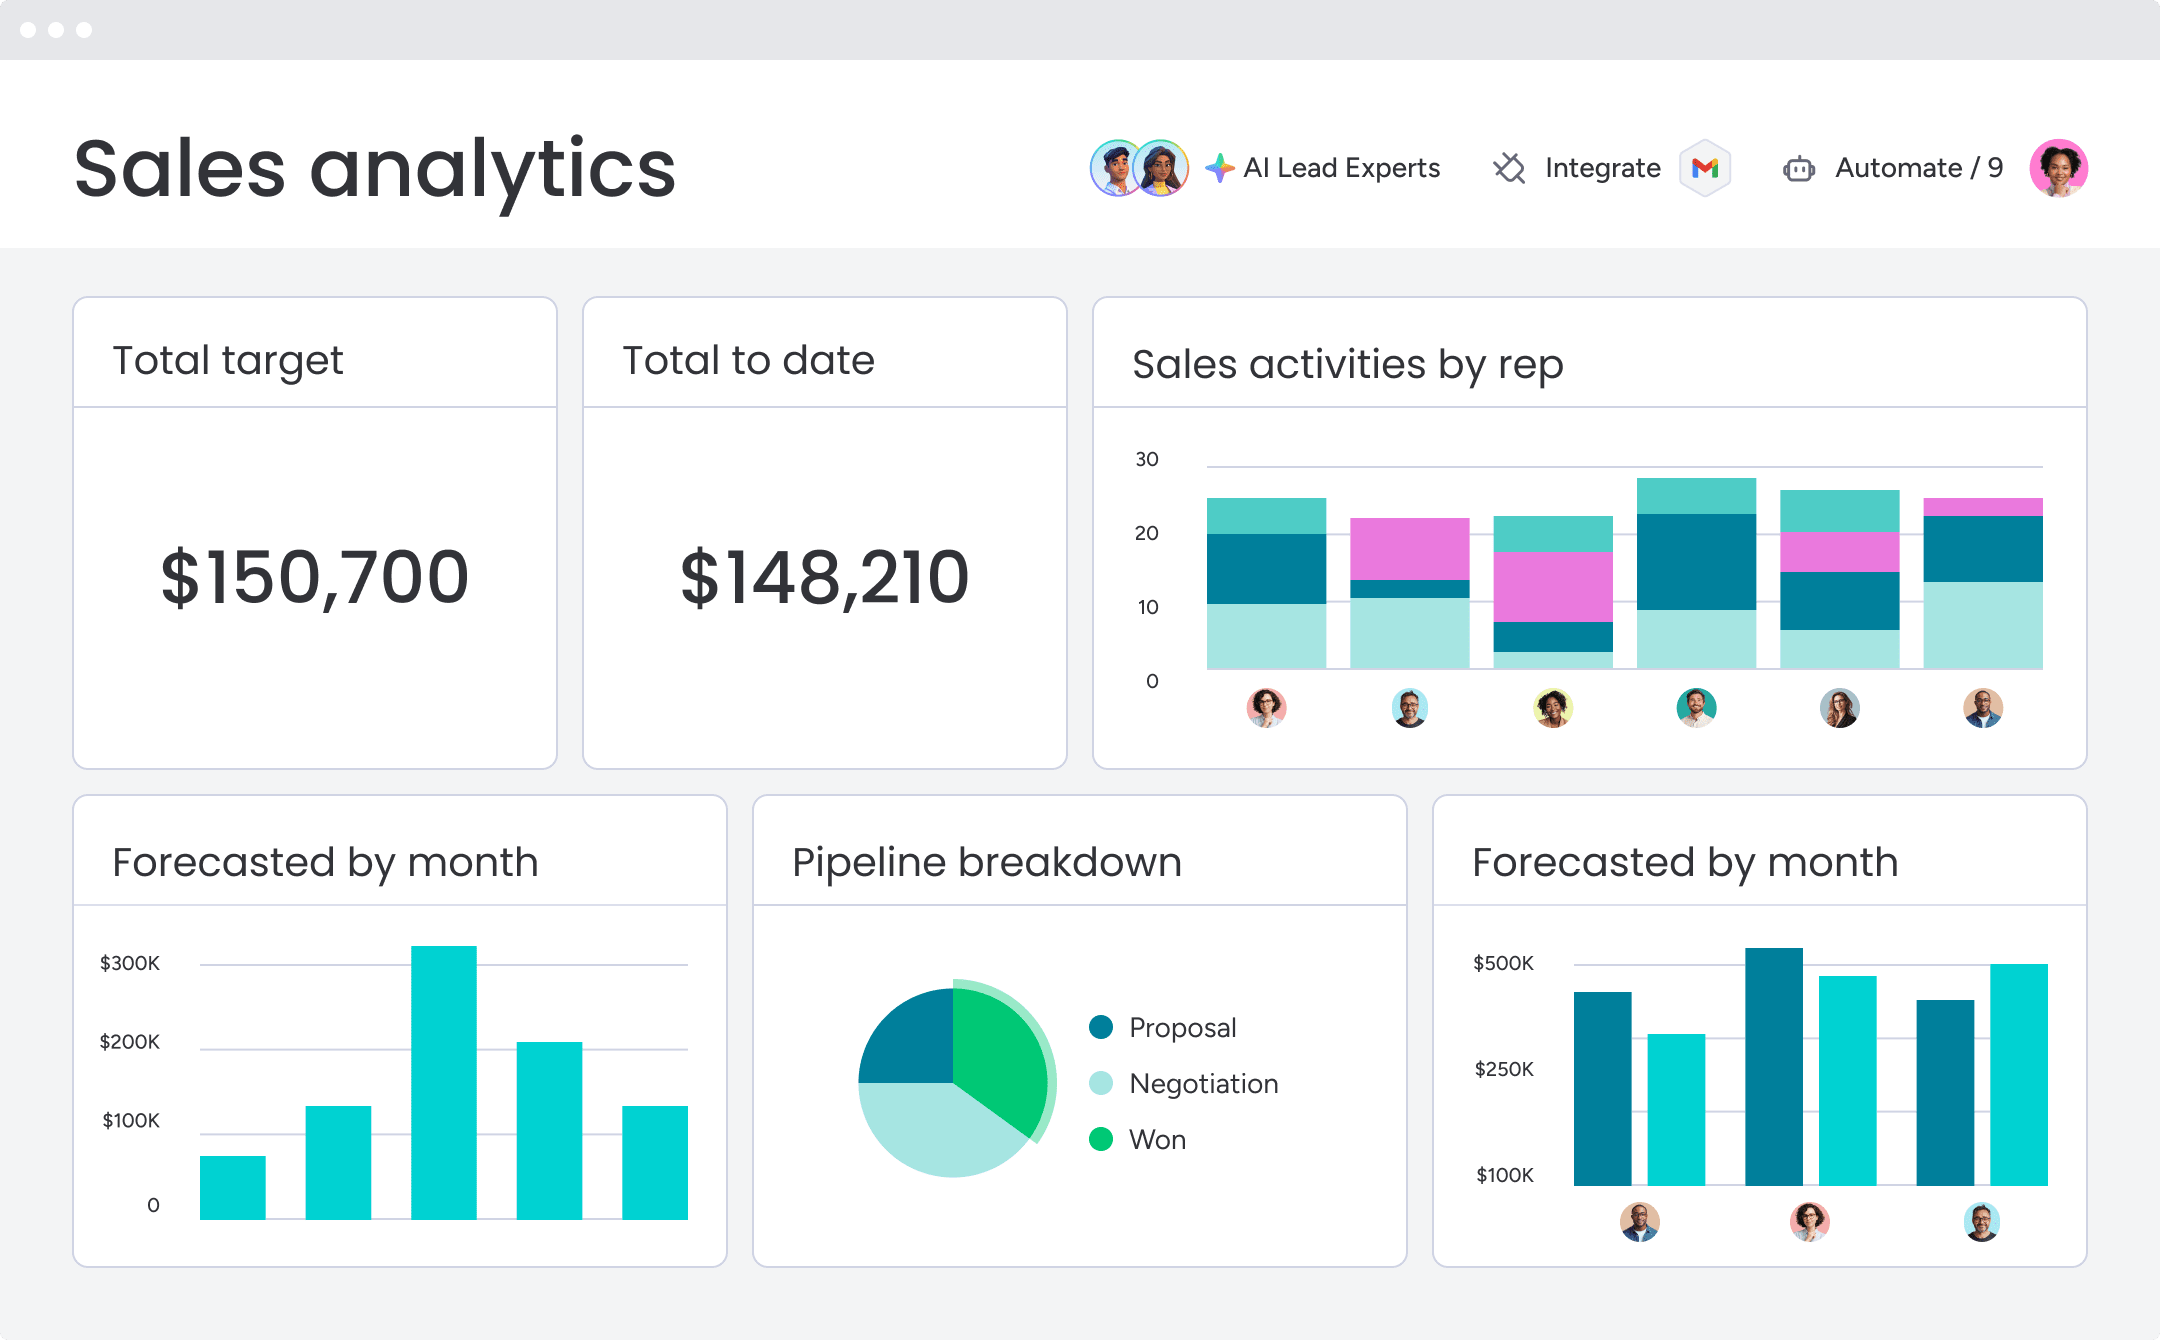
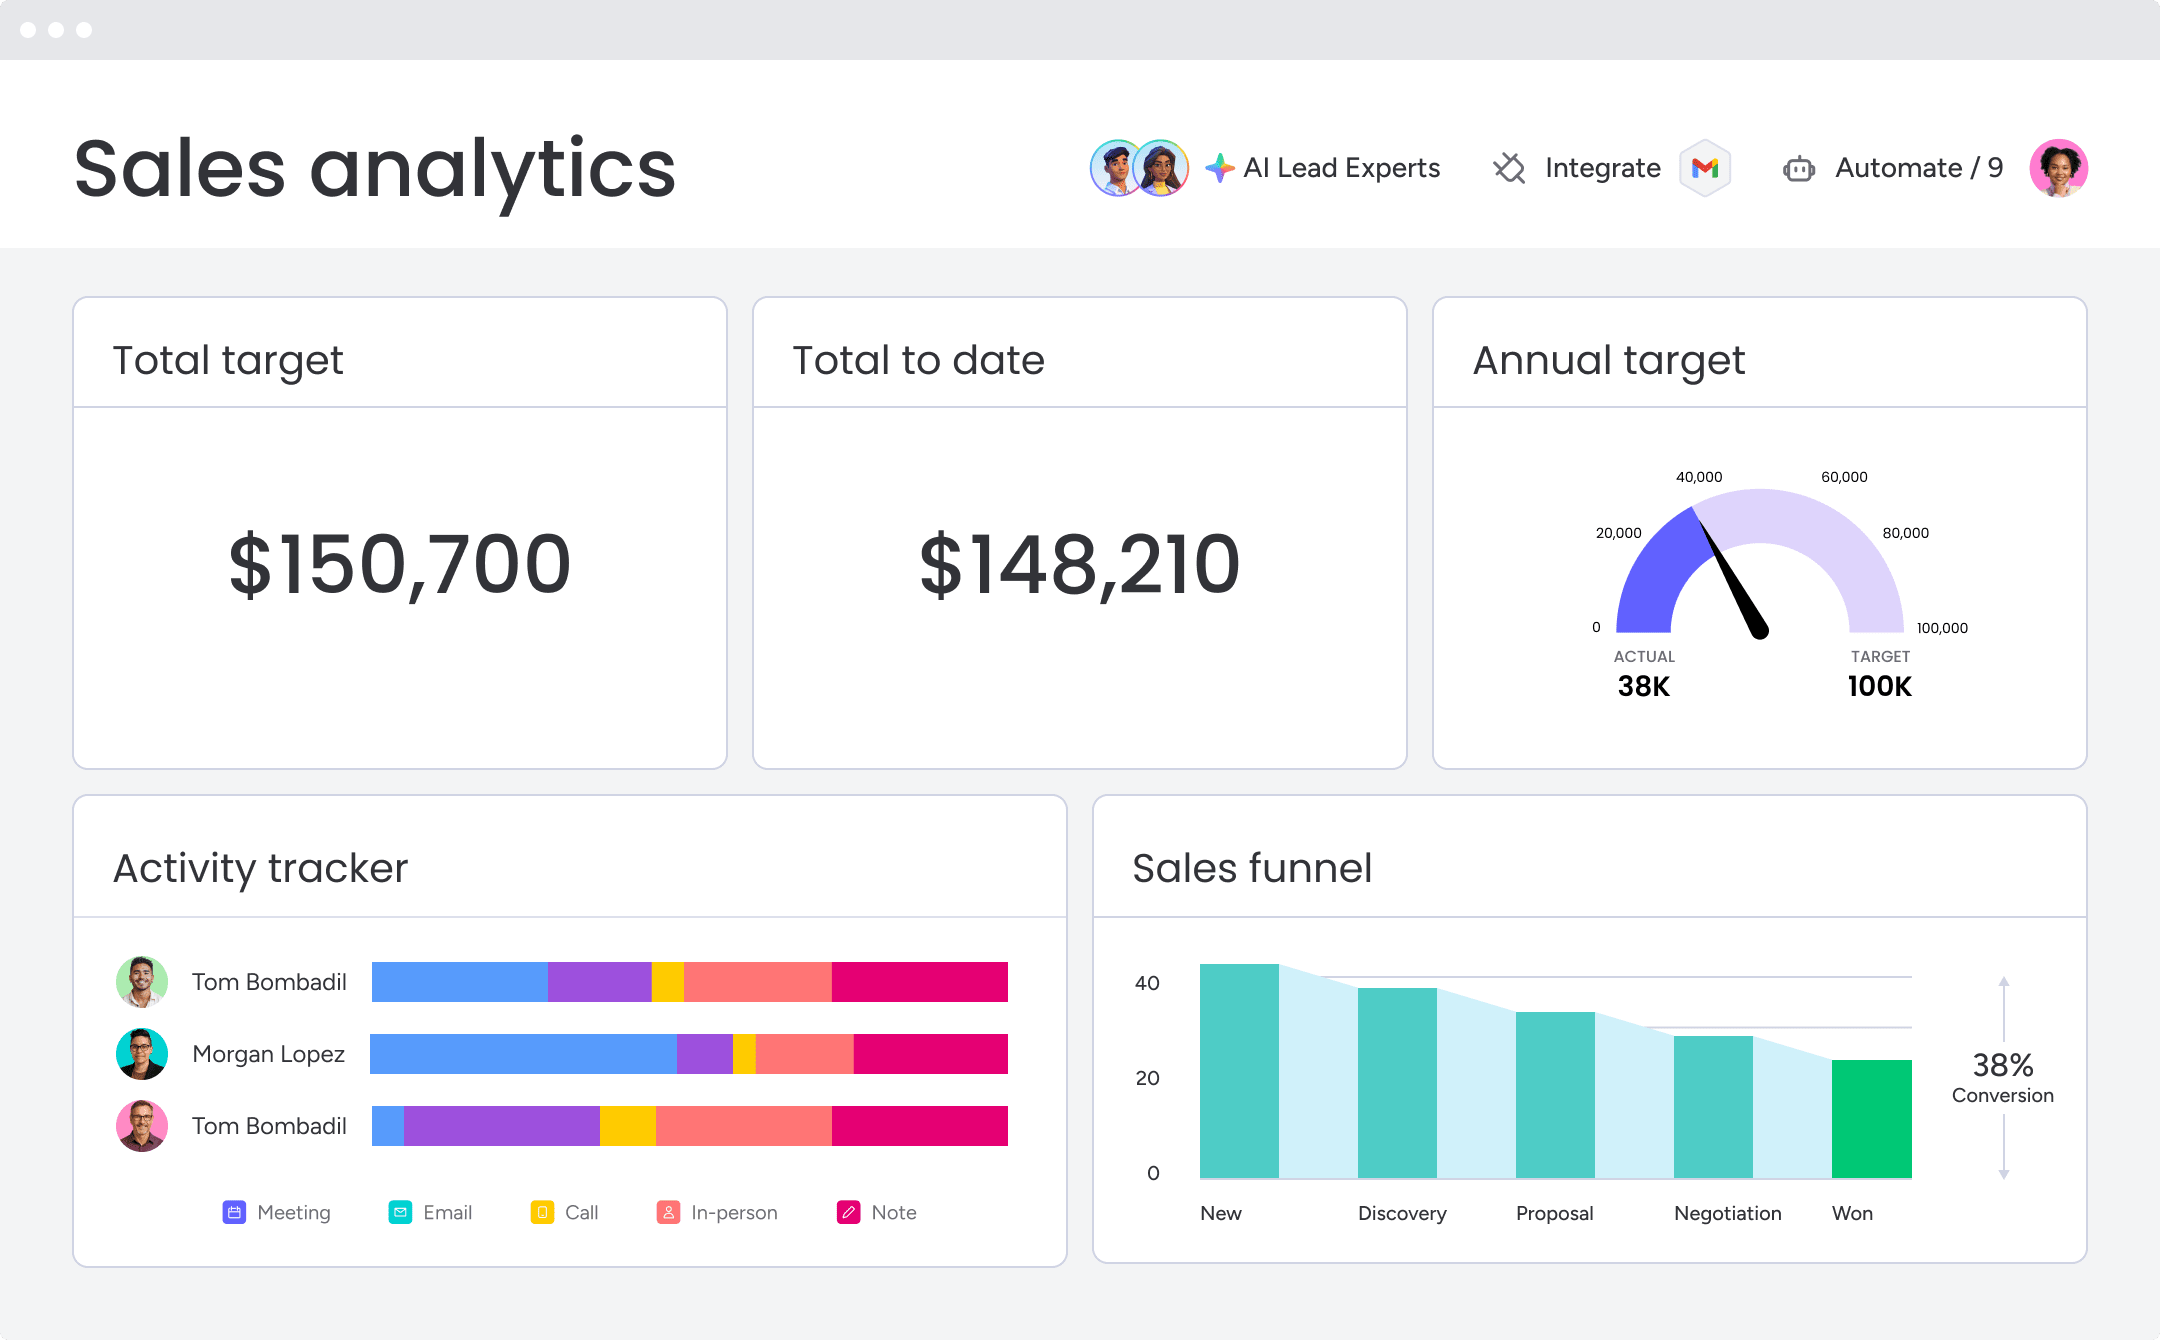
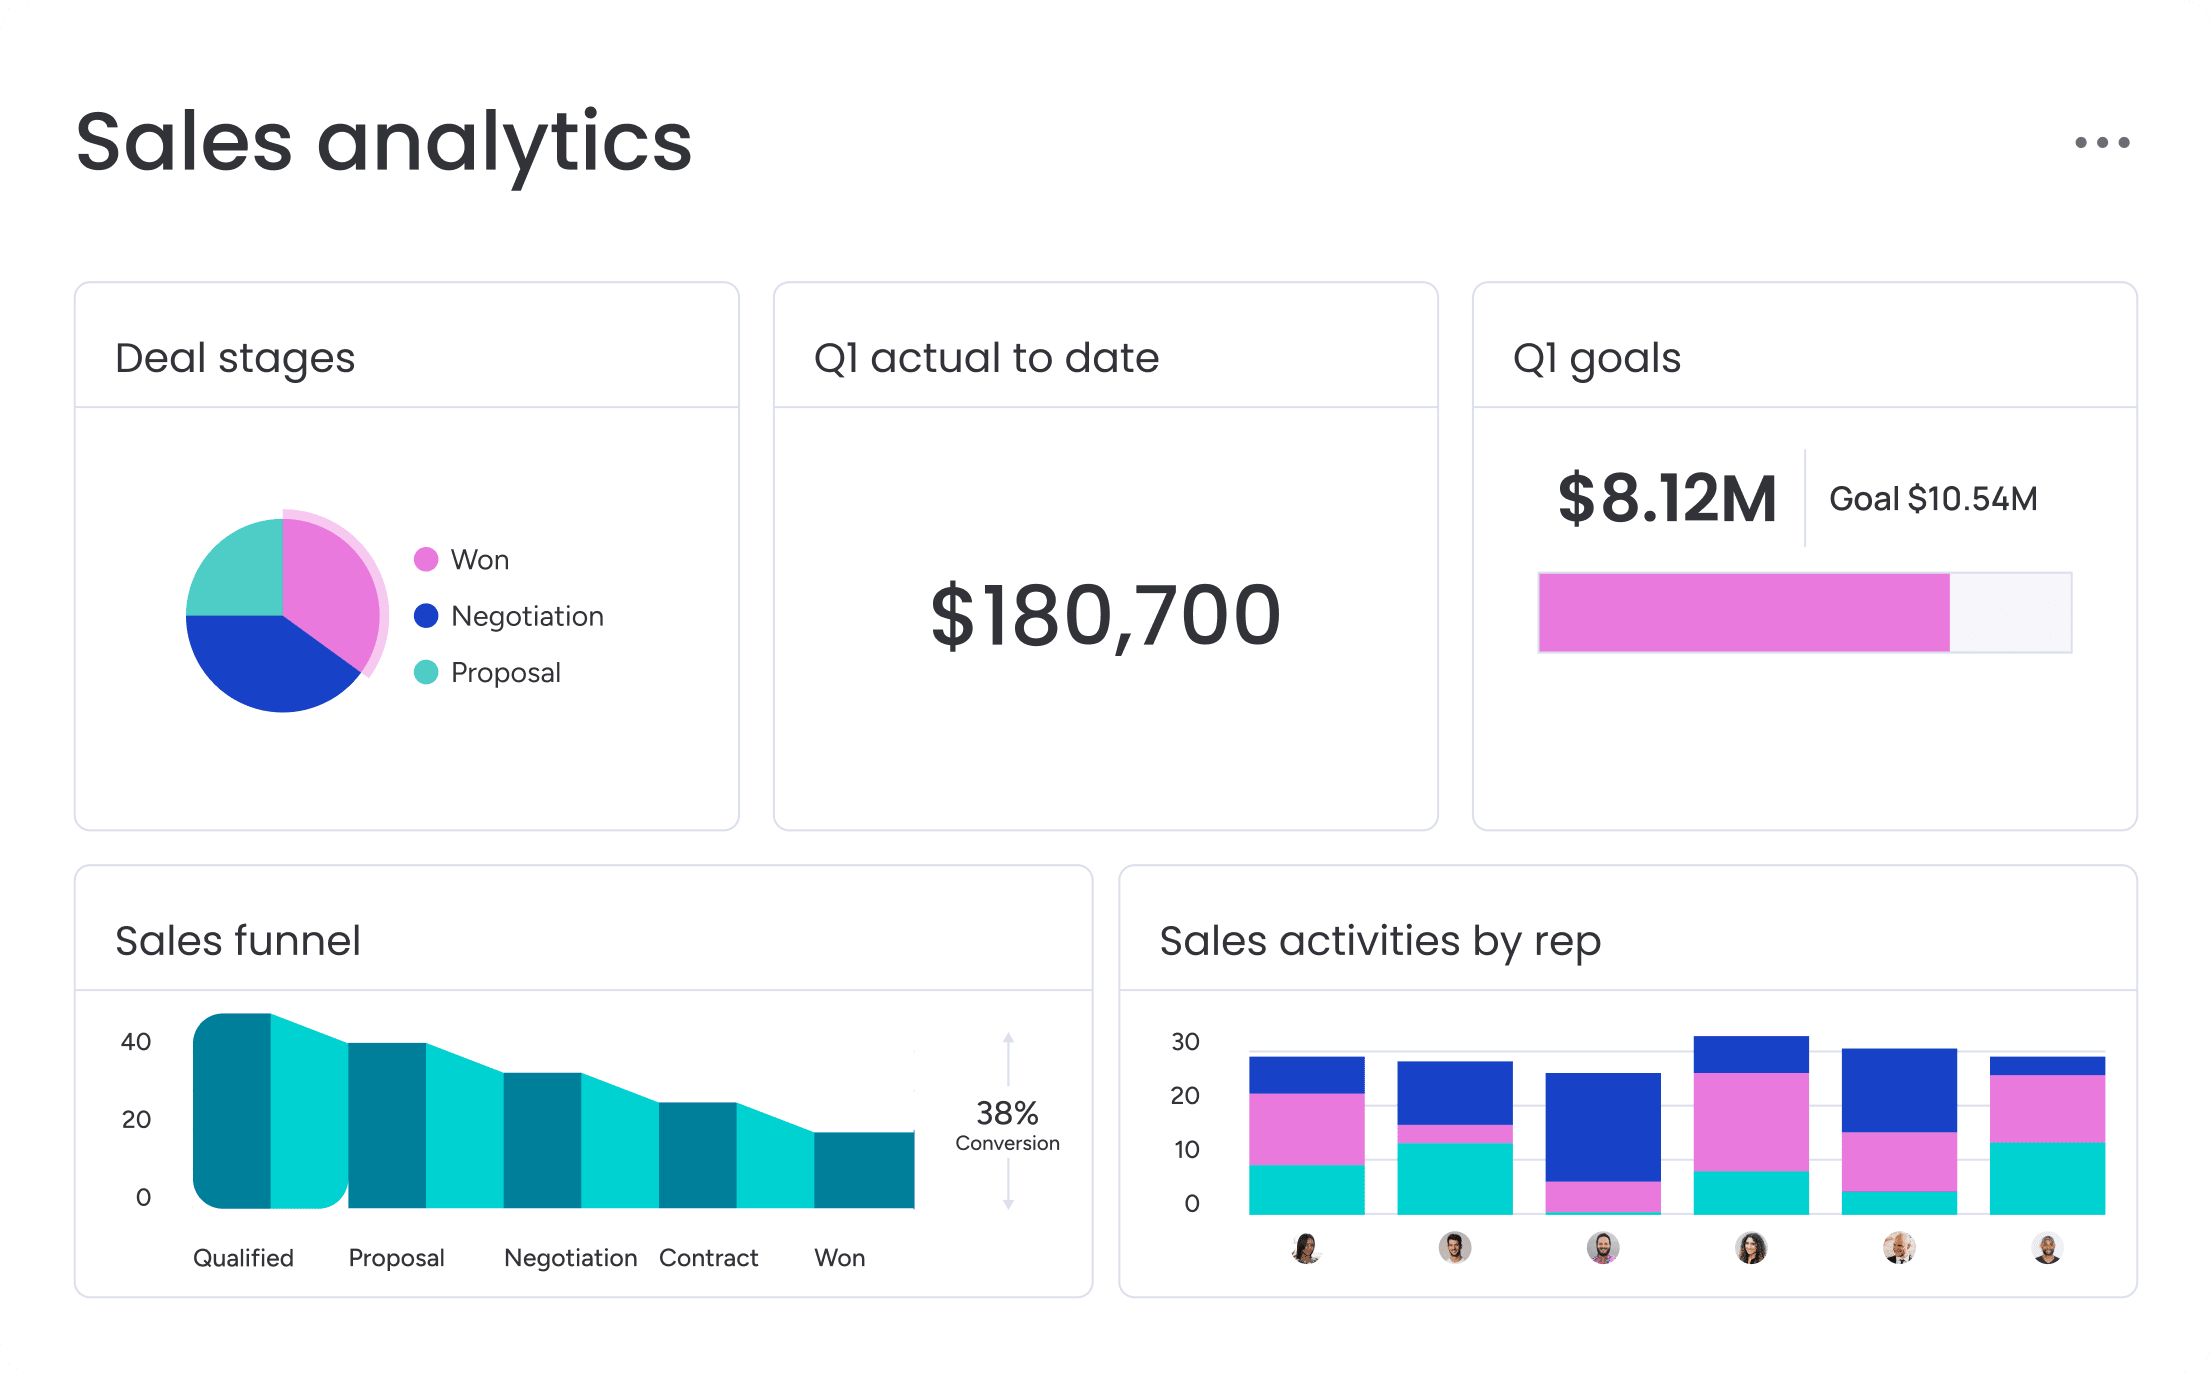
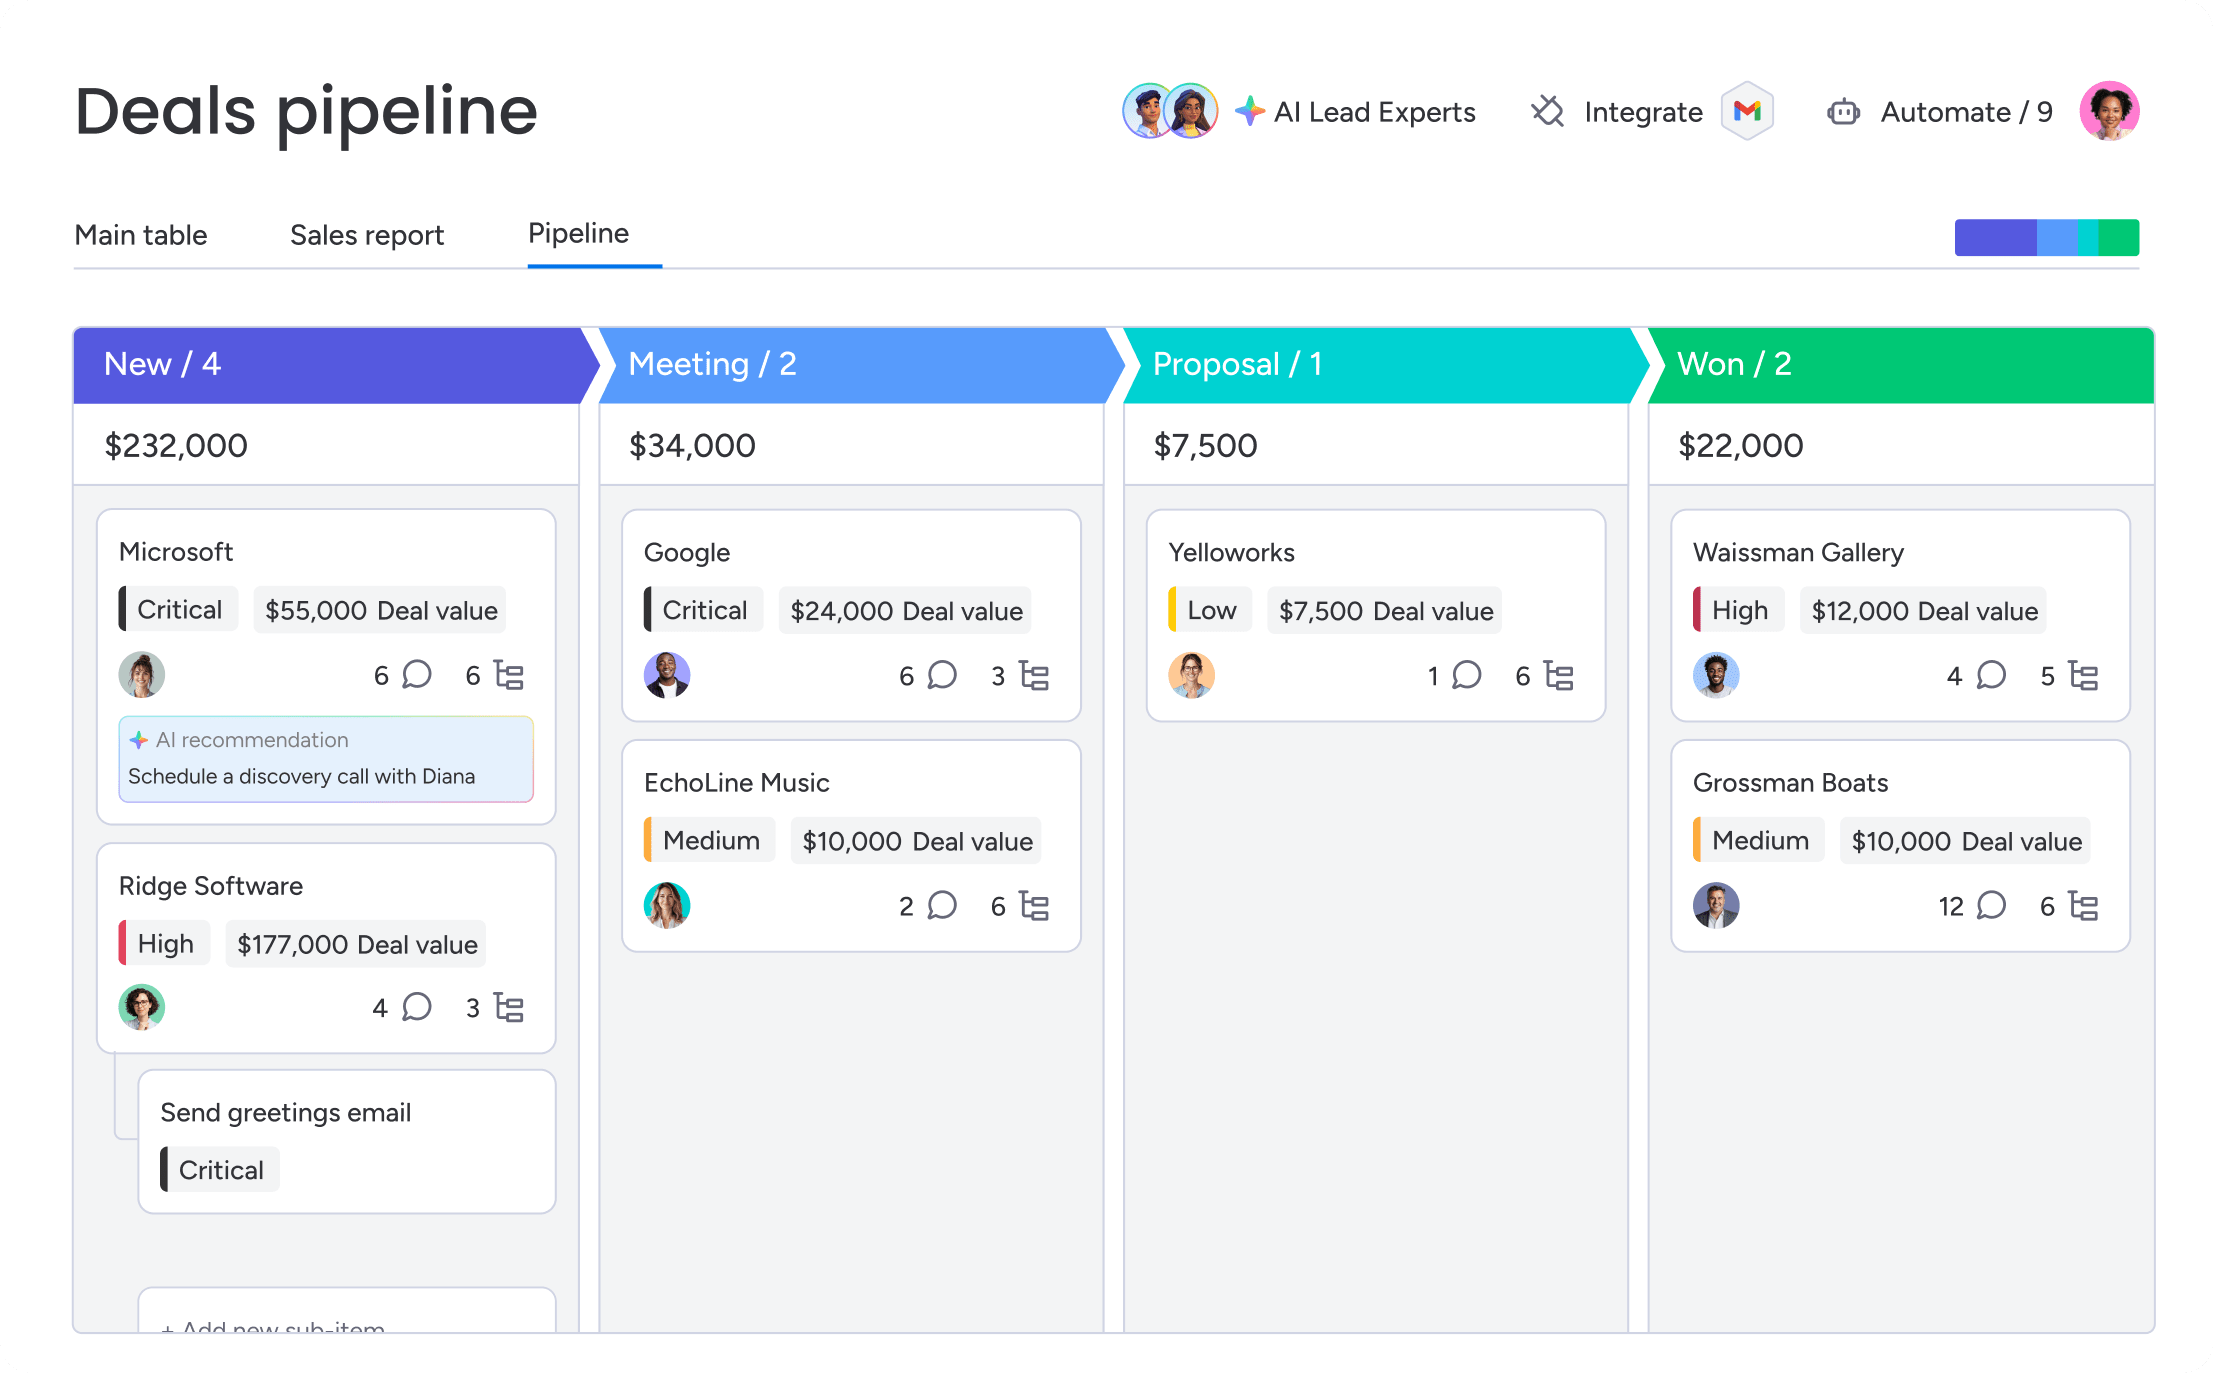
Custom dashboards and real-time visibility
Drag-and-drop widgets, customizable views, and role-based dashboards mean teams get exactly the view they need without waiting for IT. See deal progression as it happens, build dashboards tailored to your role, and use sales-specific widgets like the leaderboard, sales funnel, and pipeline widgets to track pipeline value, conversion rates, and win rates automatically.
AI-powered insights and predictions
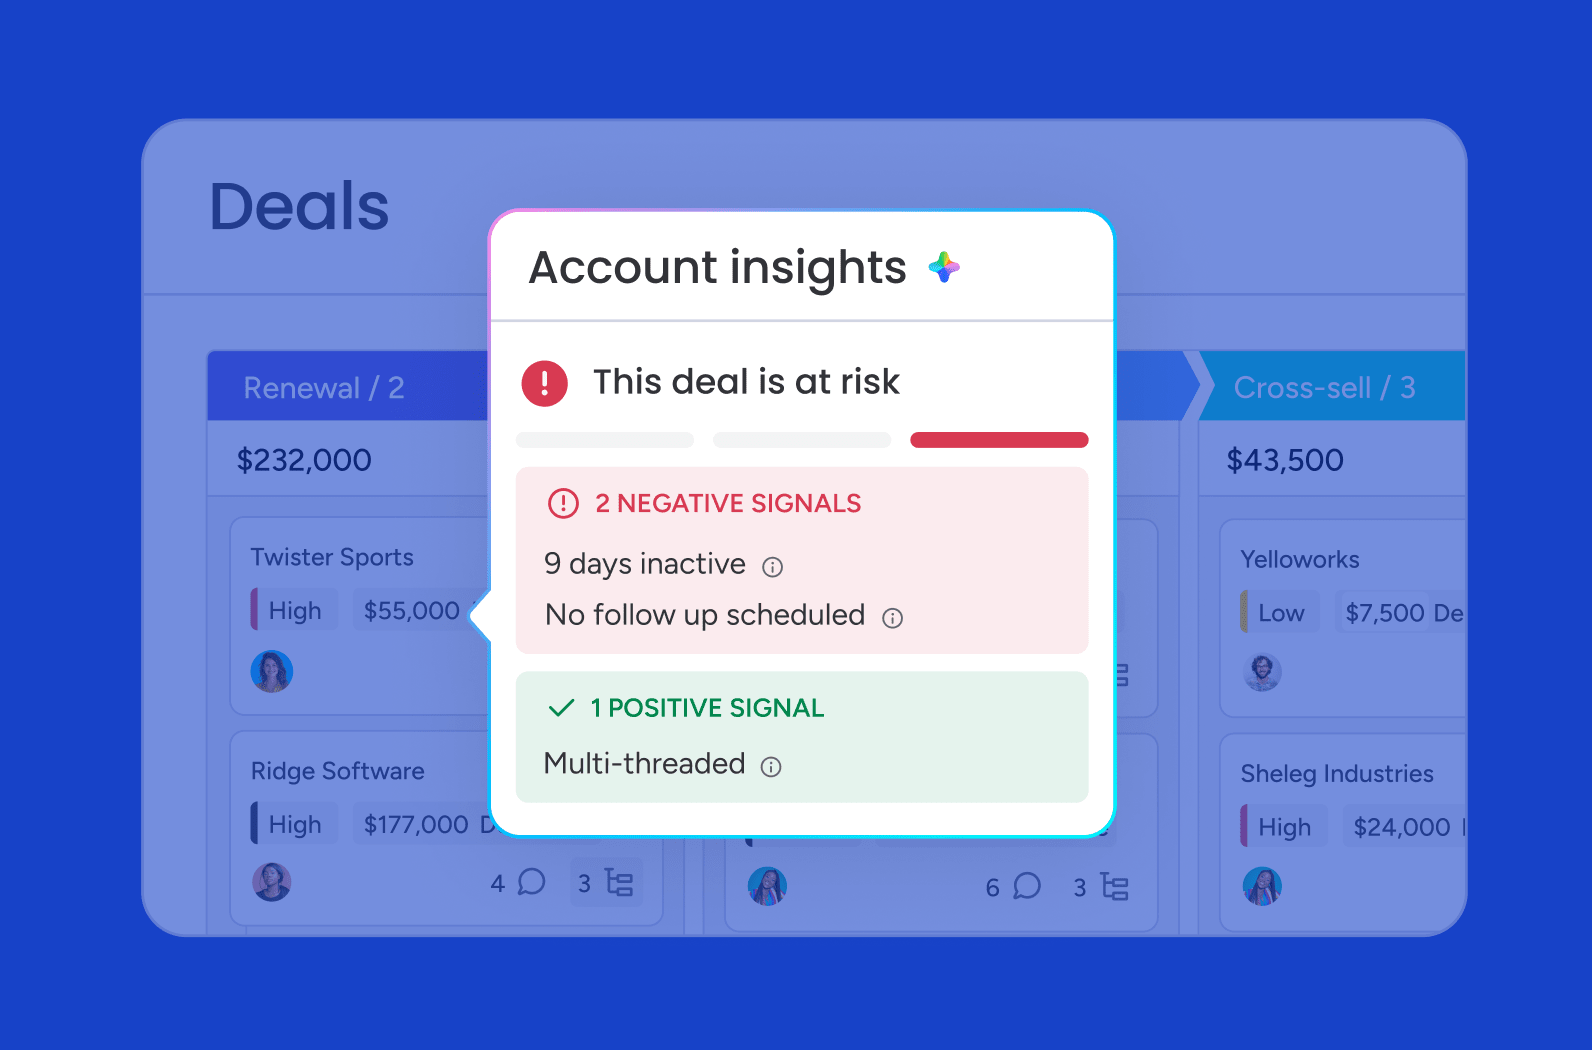
monday CRM’s AI capabilities analyze historical data to identify patterns and make recommendations:
- AI Timeline Summary: Condenses communication history into a fast-read overview.
- Sentiment detection: Spots tone shifts that might indicate deal risk.
- AI email assistant: Drafts replies based on customer context.
- Deal risk alerts: Flags deals likely to slip based on activity patterns.
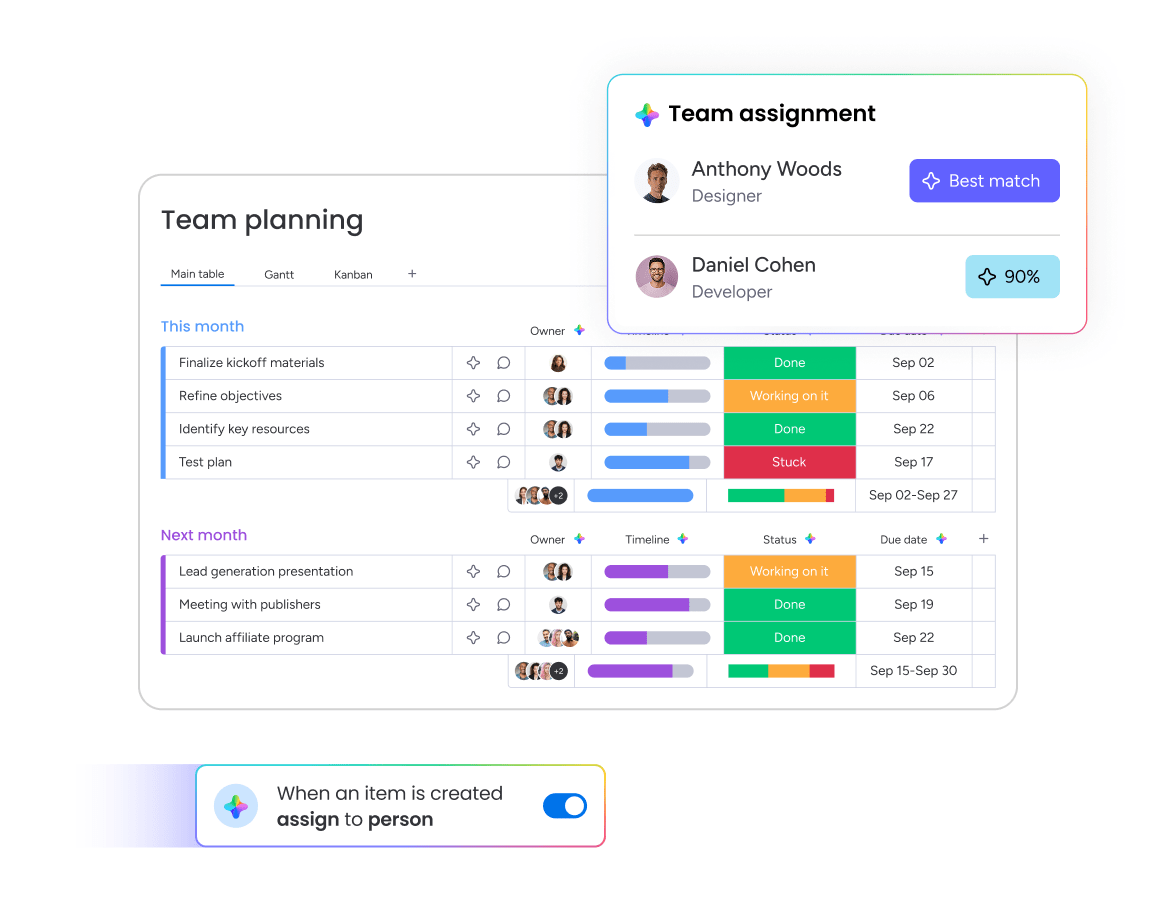
Automated activity tracking
Emails, calls, and meetings sync automatically from connected platforms, so your metrics stay current without manual entry. Deals move through stages based on triggers, and automated alerts ensure reps never miss a critical touchpoint.
Forecast tracking and quota management
Track pipeline coverage, monitor deal progression, and compare forecasts to results in real time. monday CRM’s forecast-vs-actual reporting with drilldowns by month or rep gives leadership the visibility to plan accurately. Get notified when coverage drops below target and monitor progress toward quota by rep, team, and time period.
Cross-team visibility and collaboration
monday CRM provides visibility across the entire customer journey, from marketing to sales to customer success. See every interaction from first touch to renewal, monitor onboarding progress, track renewals, and identify upsell opportunities. When marketing, sales, and customer success work from the same data, silos disappear.
“With monday CRM, we’re finally able to adapt the platform to our needs — not the other way around. It gives us the flexibility to work smarter, cut costs, save time, and scale with confidence.”
Samuel Lobao | Contract Administrator & Special Projects, Strategix“Now we have a lot less data, but it’s quality data. That change allows us to use AI confidently, without second-guessing the outputs.”
Elizabeth Gerbel | CEO“Without monday CRM, we’d be chasing updates and fixing errors. Now we’re focused on growing the program — not just keeping up with it."
Quentin Williams | Head of Dropship, Freedom Furniture“There’s probably about a 70% increase in efficiency in regards to the admin tasks that were removed and automated, which is a huge win for us.“
Kyle Dorman | Department Manager - Operations, Ray White"monday CRM helps us make sure the right people have immediate visibility into the information they need so we're not wasting time."
Luca Pope | Global Client Solutions Manager at Black Mountain“In a couple of weeks, all of the team members were using monday CRM fully. The automations and the many integrations, make monday CRM the best CRM in the market right now.”
Nuno Godinho | CIO at Velv
“monday.com provides developmental flexibility, operational efficiency, and data transparency — all in one place. We became a company that moved from chasing data to leading with it.”
Hyunghan Lee | Team Lead, Sandbox Network
"monday.com brought every part of our business into one connected space. The harmony between work management and CRM has become our operating system — giving us the clarity and confidence to scale.”
Jennifer Chinburg | Executive Vice President of Corporate Development & Brand, Chinburg Properties
“We just weren’t getting value from our old CRM. With monday.com, it's a thousand times better. Our sales teams are more informed, more consistent, and far more connected."
James Arnold | Chief Operating Officer, CenversaFrom metrics to results: Put CRM analytics into action
CRM analytics turn data into action: track the right metrics, forecast with confidence, and close more deals by spotting pipeline problems before they become missed quotas. When your entire revenue team works from the same real-time insights — pipeline value, win rates, deal velocity, and forecast accuracy — decisions get faster and results get better.
monday CRM makes tracking these metrics simple with real-time dashboards, AI-powered insights, and automated tracking that works for everyone on your team, not just analysts. When analytics are this easy to use, your team actually uses them.
Try monday CRM AI analyticsFAQs
What's the difference between CRM analytics and CRM reporting?
CRM reporting shows you what happened (historical data like last quarter's win rate). CRM analytics explain why it happened and predict what's next (like which deals will close this quarter). Most teams need both: reporting for accountability, analytics for decision-making.
What metrics should I track in my CRM?
The seven essential metrics are pipeline value, pipeline velocity, win rate, conversion rate, sales cycle length, forecast accuracy, and customer lifetime value. Together, these metrics give you a complete picture of sales health and help you forecast accurately.
Do I need a data analyst to use CRM analytics?
Not with modern CRM platforms like monday CRM. Pre-built dashboards, drag-and-drop widgets, and automated tracking mean sales reps and managers can monitor metrics without relying on data analysts or IT support.
How do I improve forecast accuracy?
Track pipeline coverage (3–4x quota), monitor deal velocity and win rates, improve data hygiene, and use historical patterns to calculate close probabilities instead of relying on rep estimates. Compare forecasts to actual results each quarter and refine your methodology based on what you learn.
Can CRM analytics help with customer retention?
Yes. Track metrics like customer lifetime value, renewal rates, product usage patterns, and support ticket volume to identify at-risk accounts and upsell opportunities. When you monitor these metrics consistently, you can intervene before customers churn.
How does AI improve CRM analytics?
AI analyzes historical data to spot patterns humans might miss, predict which deals will close, flag at-risk opportunities, and recommend specific actions. In monday CRM, AI capabilities include deal summaries, sentiment detection, and email composition based on customer context.