Your sales team closed three deals last week. Great. But how many qualified leads did you lose because reps couldn’t tell which prospects were actually ready to buy? Most teams waste 40% of their time on leads that will never convert. Not because they’re lazy, but because they’re flying blind without real-time lead intelligence.
A lead analytics dashboard changes that. It shows you exactly which marketing channels deliver buyers (not just clicks), where prospects stall in your pipeline, and which reps need coaching before they miss quota. This guide breaks down the seven metrics that separate high-performing sales teams from those stuck guessing. You’ll learn how to track lead source ROI, optimize response times that actually impact win rates, and build conversion funnels that reveal your biggest revenue leaks.
Try monday CRMKey takeaways
- Track seven essential metrics to transform your sales results: lead source performance, quality scores, velocity rates, conversion rates, response times, cost per qualified lead, and engagement scores.
- Focus on lead source performance first. It shows which marketing channels actually bring paying customers, not just high lead volumes that waste your resources.
- monday CRM’s visual dashboard builder lets you create custom lead analytics without technical skills, automatically syncing data from all your sales platforms in real-time.
- Fast lead response times dramatically improve your win rates. Aim for minutes, not hours, and use dashboards to track and optimize your team’s follow-up speed.
- Clean data drives smart decisions, so establish regular processes to remove duplicates and fix errors to ensure your team is always guided by accurate insights.
What is a lead analytics dashboard?
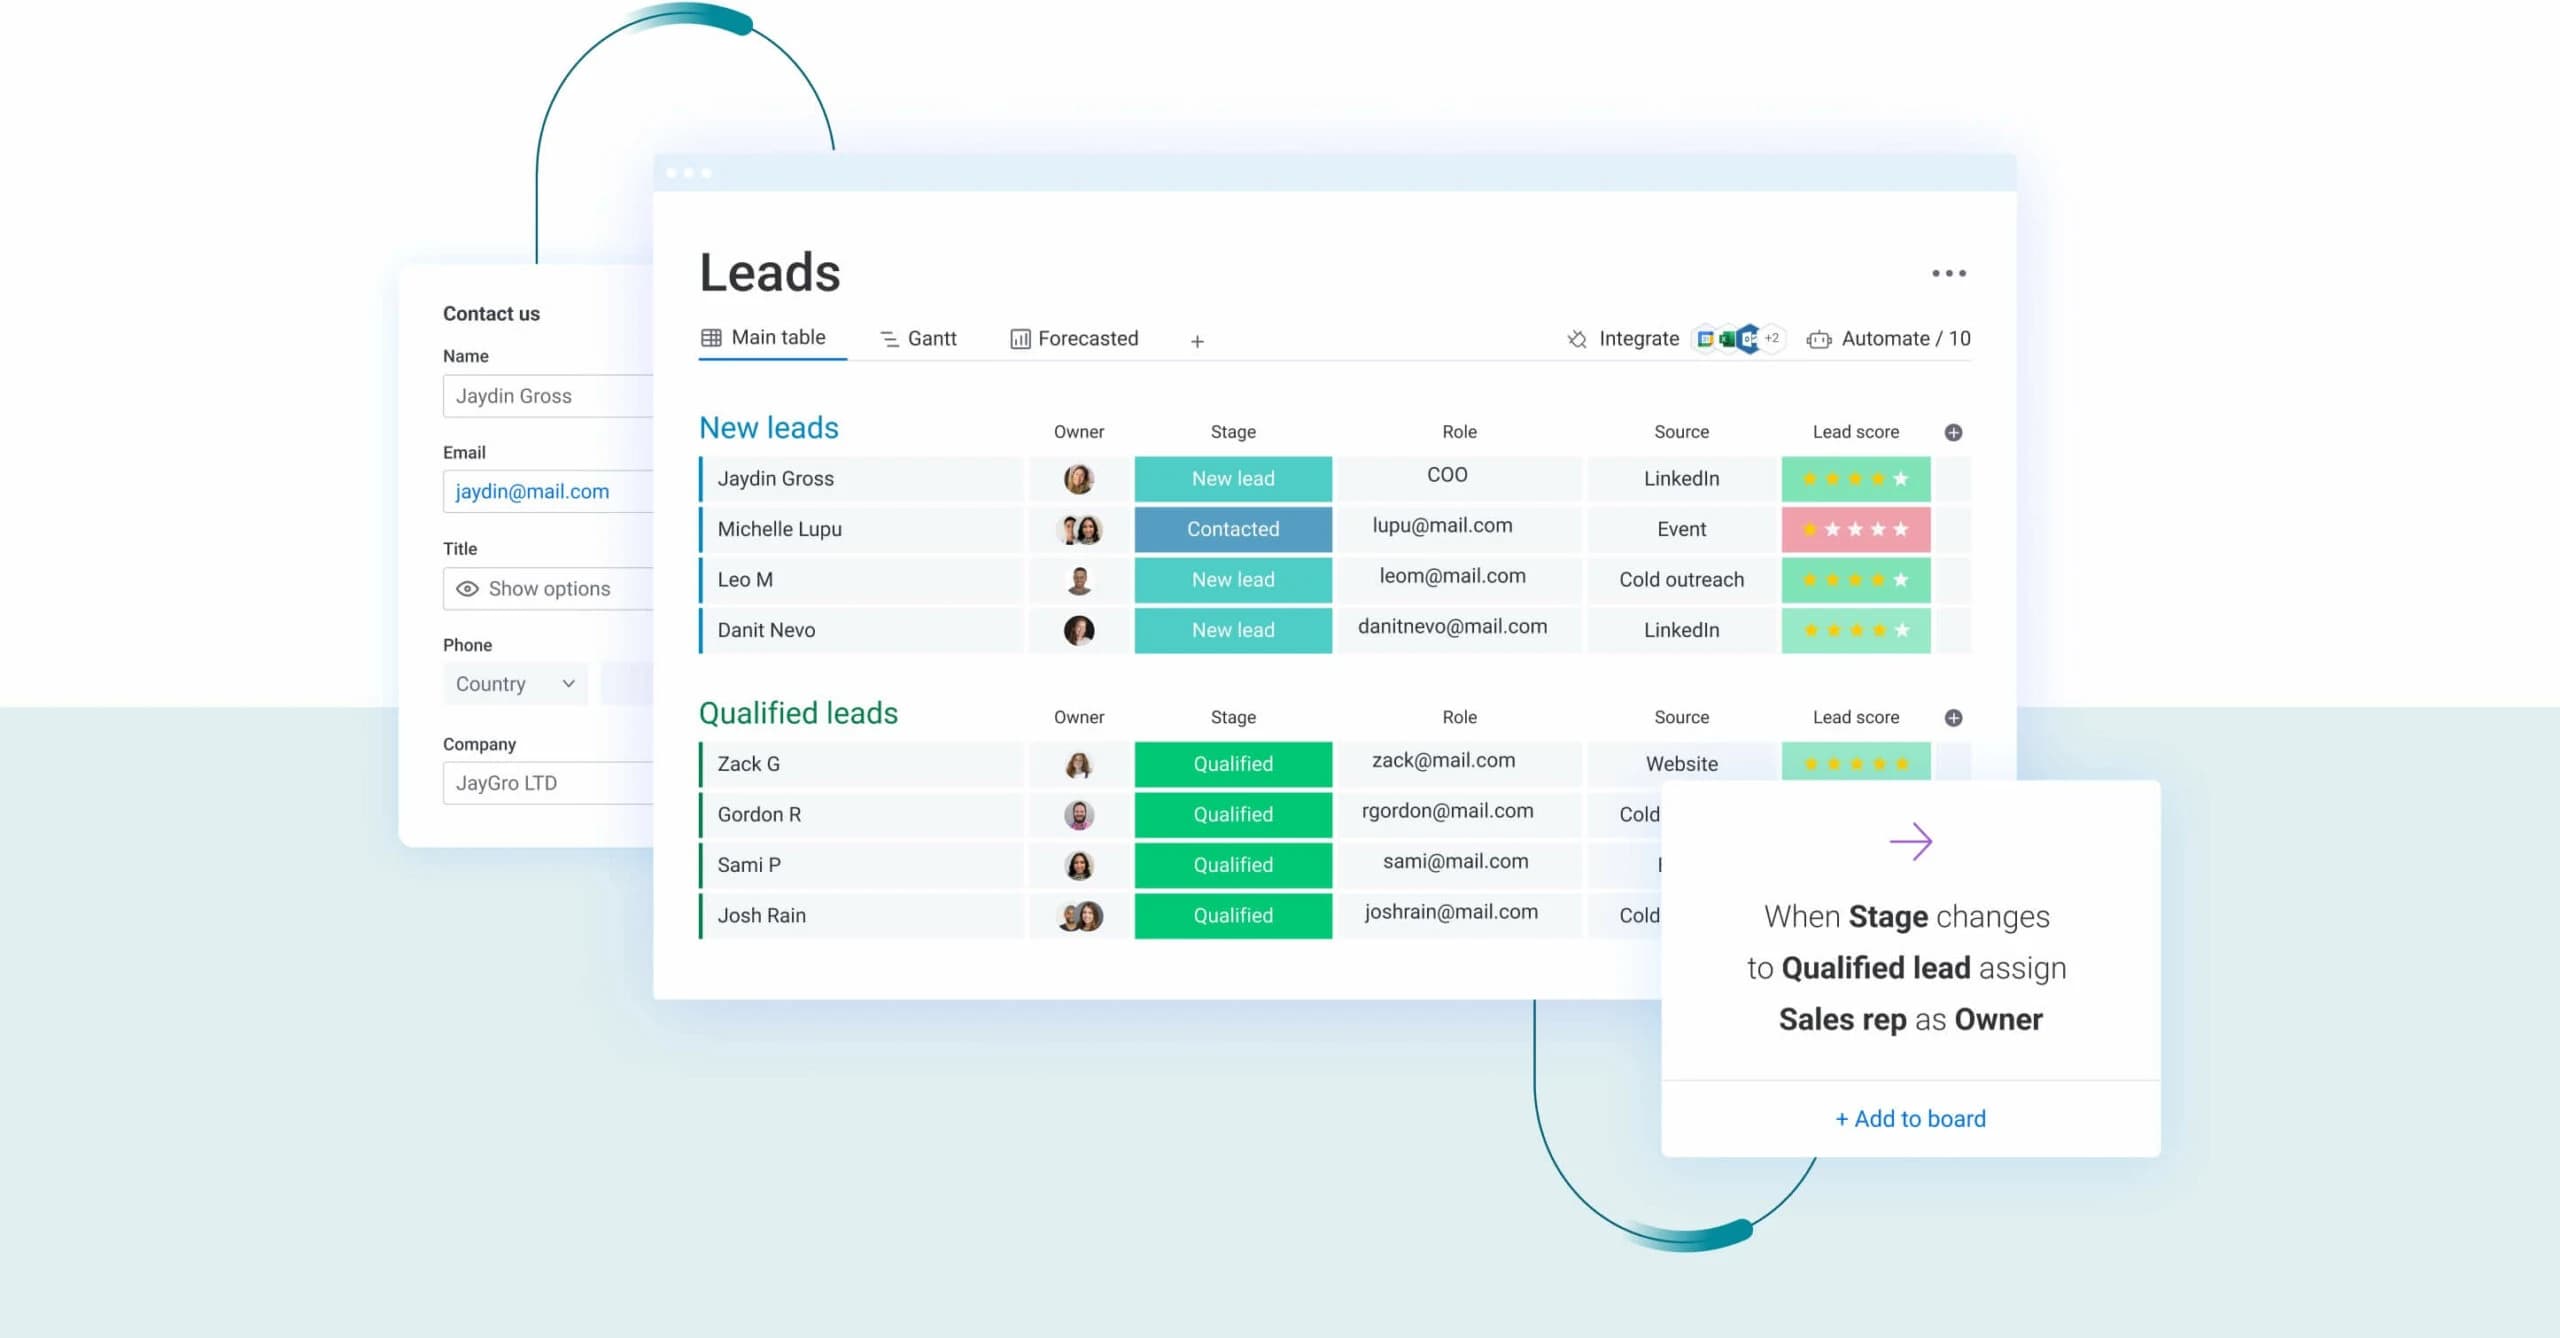
A lead analytics dashboard, which you can build on monday CRM, is a visual platform that shows you how potential customers move through your sales process. Think of it as your sales command center — one screen that displays all the important information about your sales leads in real-time.
This dashboard transforms spreadsheets full of lead data into easy-to-read charts and graphs. You can see which marketing campaigns bring in the most leads, how quickly your team responds to inquiries, and where prospects drop off in your sales pipeline.
Why your sales team needs lead analytics
Boost lead quality and conversion rates
When you track lead analytics and perform customer data analysis, you discover which marketing channels deliver customers who actually buy. Maybe your Google ads bring lots of leads, but your referral program brings the ones who spend more money.
This knowledge helps you invest in the right places and aligns closely with conversion rate optimization strategies that focus on the quality of leads over quantity.
Gain real-time sales visibility
Without a dashboard, sales managers often discover problems weeks after they happen. Lead analytics show you what’s happening right now: which deals are stuck, which reps need help, and which territories are underperforming.
You can spot when response times start slowing down and fix the issue before it impacts your revenue.
Make data-driven decisions
Lead analytics replace guesswork with facts. Instead of wondering why some months are slow, you’ll see exactly which activities drive sales and which ones waste time.
monday CRM makes sales analytics accessible to every team member, not just data analysts. The platform turns complex sales data into simple visuals that guide daily decisions.
Try monday CRM7 lead analytics metrics every sales dashboard needs
1. Lead source performance
Lead source performance tells you where your profitable customers come from. This metric tracks every channel (such as website forms, social media, trade shows, or even referrals) and shows which ones generate actual revenue.
You need to measure more than just lead volume. A channel might send hundreds of leads, but if none convert to customers, it’s not worth your investment. Track these elements for each source:
- Total leads generated: Raw numbers from each channel
- Conversion to customer rate: What percentage become buyers
- Revenue per source: Total sales value from each channel
- Cost effectiveness: How much you spend versus what you earn
2. Lead quality score
A lead quality score predicts which prospects will likely become customers, and companies that use lead scoring can see up to a 70% increase in lead generation ROI compared to those that don’t. This number combines information about the company, their behavior on your website, and how they engage with your content. Along with lead enrichment, you can gather more complete data for accurate scoring.
Your scoring system should reflect what matters for your specific business. A software company might score leads higher when they download technical guides, while a consulting firm values leads who attend webinars. Consider these scoring factors:
- Company match: Size, industry, and budget fit
- Engagement signals: Email opens, content downloads, website visits
- Buying indicators: Pricing page views, demo requests, competitor comparisons
- Data completeness: Full contact details and accurate company information
3. Lead velocity rate
Lead velocity measures how fast prospects move through your pipeline. If leads typically take 30 days to become customers, but suddenly they’re taking 45 days, something in your process needs attention.
This metric helps you set realistic expectations and identify bottlenecks. Track velocity at different levels to pinpoint specific issues:
- Stage duration: Time spent in each pipeline phase
- Total cycle time: Days from first contact to closed deal
- Trend analysis: Whether deals are speeding up or slowing down
- Bottleneck identification: Which stages cause the most delays
4. Stage-by-stage conversion rates
These rates show you exactly where you lose prospects in your sales process. If 100 leads enter your pipeline but only 20 become opportunities, you know to focus on that early qualification stage to improve lead conversion.
Understanding conversion rates at each stage helps you allocate resources and training where they’ll have the most impact. Here’s what typical conversion rates look like:
| Pipeline Stage | Expected Rate | Focus Area |
|---|---|---|
| Lead to Marketing Qualified | 40-50% | Lead scoring accuracy |
| Marketing Qualified to Sales Qualified | 60-70% | Discovery call quality |
| Sales Qualified to Opportunity | 75-85% | Needs assessment process |
| Opportunity to Closed Won | 30-40% | Proposal and negotiation skills |
5. Lead response time
Lead response time measures how long it takes your team to contact a new lead. Fast response dramatically improves your chances of winning the deal, with data from LeadAngel showing that responding within one minute can increase conversion rates by 391% — think minutes, not hours or days.
Track response times across different dimensions to optimize your follow-up process:
- Average first response: Overall team performance
- Response by lead type: Hot leads versus general inquiries
- Time-of-day patterns: When your team responds fastest
- Individual performance: Which reps consistently respond quickly
6. Cost per qualified lead
This metric shows how much you spend to generate one sales-ready lead. It goes beyond basic cost-per-lead by focusing only on prospects who meet your qualification criteria.
Calculate your true cost by including all expenses involved in generating qualified leads:
- Marketing investment: Advertising, content creation, events
- Sales development expense: SDR salaries and training costs
- Technology costs: CRM, automation platforms, analytics platforms
- Overhead allocation: Management time and support resources
7. Lead engagement score
Lead engagement score tracks how actively prospects interact with your business. A lead who opens every email, downloads multiple resources, and visits your pricing page shows stronger buying intent than one who barely responds.
monday CRM can automatically track engagement across all touchpoints, giving your team a complete picture of prospect interest:
- Content interaction: Which resources they consume and how often
- Communication activity: Email responses, meeting attendance, chat interactions
- Website behavior: Pages visited, time on site, return frequency
- Sales responsiveness: How quickly they reply and schedule meetings
Lead analytics dashboard best practices
Keep your data clean
Accurate data drives intelligent decisions. Following CRM best practices keeps your analytics reliable and your process efficient. Set up regular processes to remove duplicates, fix attribution errors, and complete missing information.
Create specific data entry standards and train your team to follow them. Automated validation rules catch errors before they corrupt your analytics.
Focus on high-performing lead sources
Once you identify which sources deliver quality leads, double down on what works and cut what doesn’t. Look beyond surface metrics — a source with fewer leads but higher conversion rates often delivers more revenue than high-volume, low-quality channels.
Optimize lead distribution
A refined lead management process with smart routing ensures each prospect reaches the right salesperson. Match leads to reps based on territory, expertise, or current workload.
Automated distribution eliminates delays and prevents leads from falling through cracks. Set rules that consider multiple factors to make optimal assignments every time.

Accelerate follow-up timing
Speed wins deals. Use your dashboard to set alerts for high-value leads, leverage AI lead management, and track response times across your team.
Lead nurturing ensures each prospect receives the right response based on their buyer’s journey stage. Hot leads need immediate phone calls, while early-stage prospects respond better to educational emails.
Review and refine regularly
Your business evolves, and your dashboard should too. Schedule quarterly reviews to ensure your metrics align with current goals and adjust your tracking as you discover new insights or face new challenges.
Drive team adoption
A dashboard only delivers results if your team actually uses it. Show reps how the metrics connect to their success and make the dashboard part of daily routines, especially since employees who understand how success is measured are 2x more likely to feel motivated.
Celebrate wins that come from dashboard insights. When a rep uses data to close a big deal, share that story to encourage others.
Try monday CRMBuild powerful lead analytics dashboards with monday CRM
monday CRM transforms lead analytics from complex spreadsheets into visual insights anyone can understand. The platform’s customizable dashboards let you track all seven essential metrics without technical expertise.
Build dashboards that match your exact needs with drag-and-drop simplicity. As your business grows, modify your analytics without calling IT or hiring consultants. Key features that power your lead analytics include:
- Visual dashboard builder: Create custom views for different roles and needs
- Automated data sync: Real-time updates from all your sales and marketing platforms
- AI-powered insights: Automatic pattern detection and opportunity identification
- Mobile access: Check your metrics and manage leads from anywhere
The platform’s flexibility means you can start simple and add sophistication as you learn what drives your sales success.
Ready to see how lead analytics can transform your sales results? Try monday CRM and build your first dashboard today.
Frequently asked questions
What's the difference between lead analytics and general sales analytics?
The difference between lead analytics and general sales analytics is that lead analytics specifically tracks potential customers before they buy, focusing on metrics like source performance, qualification rates, and pre-sale engagement. Sales analytics covers the entire customer journey, including post-sale activities, customer retention, and lifetime value.
How often should sales teams check their lead analytics dashboards?
Sales teams should review their lead analytics dashboards daily for operational insights like new lead volume and response times. Conduct weekly deep dives to spot trends and monthly strategic reviews for resource allocation and process improvements.
Can small sales teams benefit from lead analytics dashboards?
Small sales teams often see the biggest impact from lead analytics because every lead matters more when resources are limited. Dashboards help small teams focus their energy on high-value activities and the most promising prospects.
Which platforms typically integrate with lead analytics dashboards?
Lead analytics dashboards commonly integrate with CRM systems, marketing automation platforms like HubSpot and Marketo, email marketing services, website analytics platforms, social media management platforms, and communication platforms like Slack or Microsoft Teams.
How do you calculate an effective lead quality score?
An effective lead quality score combines demographic fit (company size, industry), behavioral data (website visits, content downloads), and buying signals (demo requests, pricing views) into a weighted score that predicts conversion likelihood based on your historical customer data.
What's the most important lead analytics metric for new sales teams?
Lead source performance typically provides the most value for new sales teams because it immediately shows which marketing efforts generate quality prospects, helping teams focus limited resources on channels that actually drive revenue.