
Even the best-laid business plans can fail if you don’t have a way to translate your strategy into action. That’s exactly why balanced scorecard templates exist. They break down your high-level strategy into measurable objectives, giving you a structure to work from, without starting from scratch.
This guide shows you how to build scorecards that drive results. You’ll see real examples from healthcare, manufacturing, and tech companies, and learn how to cascade scorecards across departments so everyone knows how their work connects to company goals.
Try monday.comKey takeaways
- Build scorecards with four connected perspectives: Financial, customer, internal process, and learning & growth work together to show how employee skills drive customer satisfaction and financial results.
- Focus on 2-4 objectives per perspective with clear KPIs: Too many metrics create confusion, while the right ones align your entire organization around what drives strategic success.
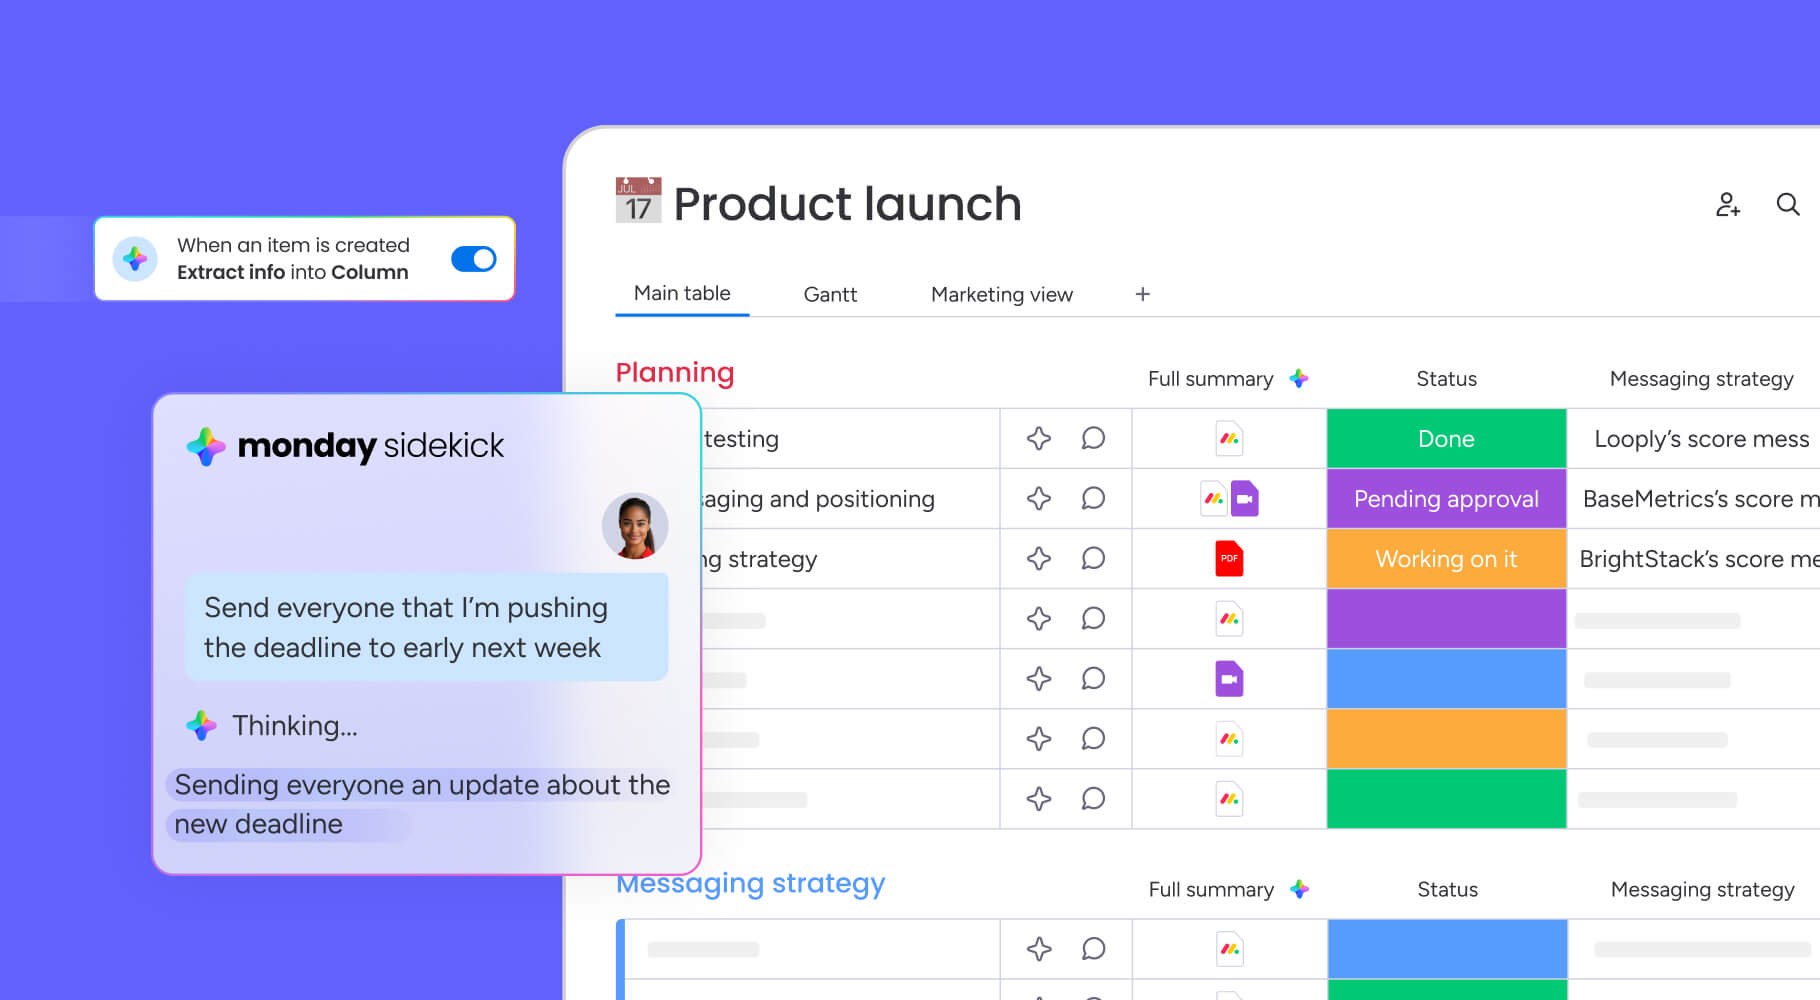
- Transform static templates into dynamic execution systems: monday.com connects scorecard objectives directly to daily workflows, providing real-time updates and AI-powered insights that turn strategy into action.
- Cascade enterprise strategy to every team level: Translate high-level objectives into department and team-specific goals so front-line employees understand how their work contributes to company success.
- Select KPIs that predict future performance, not just measure the past: Mix leading indicators like employee engagement with lagging indicators like revenue to enable proactive management decisions.
What is a balanced scorecard and why use it?
A balanced scorecard is a strategic performance management framework that translates your organization’s high-level strategy into measurable objectives across 4 key perspectives. Robert Kaplan and David Norton created this framework in the 1990s to push businesses beyond tracking financial metrics. It includes the operational drivers that create future financial success.
It’s both a measurement system and a management approach that turns vision into action. For leaders, a balanced scorecard solves 3 persistent operational challenges that often derail strategic execution. Understanding these benefits helps you justify its adoption and secure cross-functional buy-in:
- Strategic alignment: Connects daily work to long-term goals, so individual efforts contribute to the broader mission
- Performance visibility: Creates a comprehensive view of organizational health, preventing leaders from focusing only on lagging financial indicators while missing leading operational ones
- Accountability: Establishes ownership for strategic outcomes, defining exactly who drives specific results
Core components that drive strategic success
Effective balanced scorecards need 4 elements working together to connect operational activities to strategic outcomes. These components turn abstract strategy into concrete action.
These essential building blocks shape how your scorecard functions, turning it from a simple report into a powerful management system. Getting these components right is critical for connecting high-level strategy to the daily work that drives results.
- Strategic objectives: Specific, measurable goals supporting your overall strategy, such as “Reduce Cycle Time” or “Increase Market Share”
- Key performance indicators (KPIs): Quantifiable metrics tracking progress toward objectives and providing data for decision-making
- Targets: Specific performance levels your organization aims to achieve within defined timeframes
- Initiatives: Action plans, projects, or programs designed to achieve targets, representing the “how” of strategy
Here’s how these components connect in practice. An employee training initiative improves technical skills (Learning Objective), which cuts defect rates (Process KPI), boosts customer satisfaction (Customer Objective), and increases profitability (Financial Outcome).
Key benefits for strategic alignment and execution
Implementing a balanced scorecard delivers measurable business impacts for both executives and operational managers. These benefits solve specific challenges organizations face when executing strategy.
The framework delivers 5 distinct advantages that address common execution gaps. For executives and managers, these benefits translate directly into improved focus, alignment, and accountability across the organization.
- Strategic focus: Limits objectives to those truly driving your strategy, avoiding the trap of pursuing too many competing priorities
- Cross-functional alignment: Breaks down departmental silos by connecting diverse functions to shared strategic objectives
- Performance transparency: Gives executives real-time visibility into what works and what doesn’t, enabling faster course corrections based on data
- Resource optimization: Ensures leaders allocate budget and talent to high-impact initiatives directly supporting strategic goals
- Accountability culture: Creates ownership for results at every organizational level, making strategy everyone’s responsibility rather than just leadership’s concern

The 4 perspectives every balanced scorecard needs
A strong balanced scorecard looks at your organization from 4 angles to create a complete picture of health. These perspectives connect: success in learning and growth enables internal process improvements, which drive customer satisfaction and deliver financial results.
Financial perspective
The financial perspective measures whether strategic execution improves your bottom line. Financial metrics answer a critical question for stakeholders: “How do we look to shareholders?” These are lagging indicators that reflect past performance, but they’re essential for validating your strategy’s success.
Customer perspective
The customer perspective measures how well you create value for your target market. These metrics answer “How do customers see us?” and serve as leading indicators of future financial performance. Unhappy customers today mean poor financial results tomorrow.
Common objectives in this area include customer satisfaction, retention, acquisition, and market share growth. Critical KPIs to track include:
- Net Promoter Score (NPS): Gauges loyalty and advocacy
- Customer Lifetime Value (CLV): Predicts total relationship worth
- Customer Acquisition Cost (CAC): Measures marketing efficiency
- Market share percentage: Tracks competitive position
Internal process perspective
The internal process perspective identifies the critical workflows you need to excel at to deliver customer value and hit financial objectives. It answers “What must we excel at internally?” This perspective covers innovation (developing new products), operations (delivering existing products), and post-sale service.
Key process metrics focus on operational excellence:
- Time-to-market: Speed of innovation cycles
- Defect rates: Quality and production reliability
- Cycle time: Speed of operational delivery
- Process cost per unit: Operational efficiency
Learning and growth perspective
The learning and growth perspective measures your capacity to change and improve. It answers “How can we continue to improve and create value?” This perspective is your ultimate leading indicator. Without investment here, you can’t sustain improvements in processes and customer relationships.
This perspective covers 3 main categories:
- Human capital: Skills and capabilities development
- Information capital: Systems and data infrastructure
- Organizational capital: Culture and leadership effectiveness
Key metrics include employee satisfaction scores for engagement and morale, training hours per employee for human capital investment, system availability for information capital reliability, and leadership effectiveness ratings for organizational management strength.
Try monday.comBalanced scorecard templates for every need
Different templates serve different organizational needs and maturity levels, but balanced scorecard principles stay consistent. These templates give you starting points you can customize based on industry, company size, and strategic priorities.
Essential balanced scorecard template
The Essential Balanced Scorecard Template is a foundational framework for organizations new to the methodology. It keeps things simple by focusing on the most critical strategic elements first.
This template includes:
- 4 standard perspectives: With 2-3 objectives per perspective
- Basic KPI suggestions: Common metric options with definitions
- Simple target-setting guidance: Fields for baseline and target performance
- Single-page reporting layout: Monthly review format
This template works well for small to medium organizations or individual departments within larger companies starting their performance management journey.
Strategy map template for visual alignment
The Strategy Map Template shows how objectives across the 4 perspectives connect to create strategic value. This format works best for organizations that need to communicate strategy across multiple levels and departments, showing the flow from employee skills to financial outcomes.
Strategy maps help leaders spot gaps in strategic logic and make sure every initiative supports a bigger goal. Key features include:
- Visual linkages: Show cause-and-effect relationships
- Perspective layering: Demonstrates bottom-up flow
- Strategic themes: Dedicated space for themes like “Operational Excellence”
KPI scorecard template with metrics
The KPI Scorecard Template is built for organizations ready for detailed performance measurement. It goes beyond basic scorecards with specific KPI definitions, calculation methods, and data source requirements to ensure data integrity and consistency.
This template works for organizations with established data collection capabilities and dedicated performance management resources that need rigorous tracking. Components include:
- Extended KPI libraries: Comprehensive metric options
- Measurement frequency recommendations: Timing guidance
- Data collection sheets: Standardized gathering processes
- Threshold indicators: Quick status assessment tools
Cascading scorecard template for teams
Cascading breaks down enterprise-level strategic objectives into department and team-level scorecards, aligning everyone from the boardroom to front-line employees. The template includes objective mapping fields that link team goals to enterprise objectives, team-level KPIs within team control, accountability frameworks with role-specific assignments, and alignment checklists for vertical integration.
This helps front-line employees understand their contribution to company strategy by connecting daily work to strategic outcomes, making abstract goals tangible and actionable at every level.
Excel scorecard format templates
Many organizations start with Excel-based scorecards because they’re familiar and flexible. These templates give you practical starting points you can easily customize and share without adopting new software right away.
Excel templates are easy to start with but come with challenges:
- Version control issues: Multiple file versions create confusion
- Manual data entry: Time-consuming and error-prone
- Limited real-time collaboration: Static sharing reduces team engagement
Organizations often move to platforms like monday.com as their scorecard programs mature, gaining automated updates and cross-functional visibility that static spreadsheets can’t match.
5 steps to build your balanced scorecard
Building a balanced scorecard transforms abstract strategy into a working management system. Careful execution of each step ensures your final scorecard truly reflects organizational strategy and drives the right behaviors.
Step 1: Define your strategic themes
Strategic themes are the 3-5 high-level priorities driving organizational success over the next 2-3 years. These themes directly support your mission and vision while addressing key competitive challenges. Themes such as “Operational Excellence,” “Customer Intimacy,” “Product Innovation,” or “Digital Transformation” provide the pillars upon which your scorecard builds.
To identify these themes, leadership teams should:
- Review the strategic plan
- Analyze competitive positioning
- Assess organizational capabilities
- Consider stakeholder expectations
Themes must be broad enough to encompass multiple objectives across perspectives yet specific enough to provide direction for resource allocation.
Step 2: Map objectives across perspectives
Mapping translates strategic themes into specific, measurable objectives within each of the 4 perspectives. Objectives follow a logical cause-and-effect flow from learning and growth through to financial outcomes.
Best practices for objective mapping:
- Start with 2-4 objectives per perspective to maintain focus
- Ensure every objective supports at least one strategic theme
- Verify linkages between perspectives
- Confirm objectives are specific and actionable
A learning objective to “improve employee digital skills” connects to a process objective to “reduce manual processing time,” supporting a customer objective of “faster service delivery.”
Step 3: Select and define your KPIs
KPI selection determines scorecard success. Wrong metrics drive counterproductive behaviors, while right ones align the entire organization. Each objective requires 1-2 KPIs that accurately measure progress without creating administrative burden.
When selecting KPIs, consider these essential criteria:
- Relevance: The metric directly measures the objective
- Measurability: Data is available or can be collected reliably
- Actionability: The responsible team can influence the metric
- Balance: Mix of leading (predictive) and lagging (historical) indicators
Definitions must include calculation methods, data sources, measurement frequency, and responsible parties to ensure consistency and accountability.
Step 4: Set targets with thresholds
Targets transform KPIs from passive measurement into active performance drivers by establishing expectations. Effective targets are challenging yet achievable, grounded in historical performance, industry benchmarks, and strategic requirements.
Threshold systems using Red/Yellow/Green indicators provide quick visual performance assessments:
- Red: Performance requiring immediate intervention
- Yellow: Warning zone needing attention
- Green: On-target performance
Setting both short-term quarterly and long-term annual targets ensures immediate actions support the overall strategic timeline.
Step 5: Create your implementation plan
Implementation planning bridges the gap between scorecard design and organizational execution. Even the best-designed scorecard fails without a structured approach to rollout and adoption.
Key implementation elements include:
- Communication strategy: Building organizational buy-in
- Data processes: Defining collection timing and methods
- Review schedules: Establishing performance meeting cadence
- Accountability: Assigning specific owners for every KPI
- Change management: Supporting employees in adopting new behaviors
Starting with pilot implementations in select departments allows refinement before organization-wide rollout.
How to select KPIs that drive performance
KPI selection often determines whether your balanced scorecard initiative succeeds or fails. Poor KPIs create measurement without meaning, while effective KPIs align behavior with strategy and drive organizational performance.
Financial KPIs for strategic impact
Strategic financial KPIs connect directly to objectives rather than relying solely on standard accounting measures. These metrics reflect your organization’s specific value creation model and competitive positioning.
| KPI | Strategic focus | Best for organizations prioritizing |
|---|---|---|
| Revenue per customer | Value creation efficiency | Relationship depth and expansion |
| Operating cash flow | Sustainable profitability | Financial health and stability |
| Return on invested capital | Resource deployment | Capital efficiency and growth |
| Economic value added | True value creation | Shareholder value above cost of capital |
| Market share growth | Competitive positioning | Strategic market expansion |
Selection depends heavily on organizational strategy. Growth-focused companies prioritize revenue metrics, while mature companies focus on efficiency and profitability measures.
Customer metrics that predict success
Customer KPIs function as leading indicators of future financial performance rather than just satisfaction measurements. The best customer metrics predict behavior changes that drive revenue impact.
Segmenting customer metrics by customer type, product line, or geographic region enables targeted improvements and more granular strategic insights. Essential metrics to track:
- NPS: Predicts loyalty patterns
- CLV: Measures long-term profitability potential
- CAC: Indicates marketing efficiency
- Retention rate by segment: Shows value proposition effectiveness
- Time to value: Measures how quickly customers realize benefits
Process KPIs for operational excellence
Process KPIs act as operational drivers enabling customer and financial success. These metrics focus on the critical few processes creating competitive advantage.
Three categories drive process excellence:
- Quality metrics: Track defect rates, first-pass yield, and customer complaint resolution time
- Speed metrics: Measure cycle time, time-to-market, and response time
- Cost metrics: Indicate process cost per unit, resource utilization, and waste reduction
Effective process KPIs directly support customer value propositions and strategic themes.
Growth indicators for future readiness
Learning and growth KPIs measure your organization’s capacity to adapt, improve, and compete in the future. These metrics reflect investments in capabilities enabling long-term success.
Key measurement areas include:
- Human capital metrics: Employee engagement scores, skill gap assessments, and leadership pipeline strength
- Information capital metrics: System availability, data quality, and digital capability maturity
- Organizational capital metrics: Culture survey results, change readiness assessments, and innovation pipeline strength
Balanced scorecard examples by industry
While balanced scorecard principles apply universally, successful implementation requires industry-specific customization. Each industry faces unique competitive dynamics, regulatory requirements, and stakeholder expectations that must reflect in the scorecard design.
Healthcare organization scorecard
Healthcare scorecards balance patient outcomes, operational efficiency, regulatory compliance, and financial sustainability. These organizations often emphasize patient safety and clinical quality metrics alongside traditional operational measures.
| Perspective | Objective | Key KPI | Target |
|---|---|---|---|
| Financial | Improve financial sustainability | Operating margin | 15% |
| Customer | Enhance patient satisfaction | Patient satisfaction score | 4.5/5.0 |
| Process | Reduce readmission rates | 30-day readmission rate | <8% |
| Learning | Build clinical capabilities | Staff certification rate | 95% |
Manufacturing scorecard
Manufacturing scorecards focus heavily on operational excellence, quality, safety, and customer delivery. These organizations use scorecards to drive continuous improvement, lean operations, and supply chain efficiency.
Key objectives span:
- Financial: Improving profitability through gross margin improvement
- Customer: Enhancing delivery performance with on-time delivery rates
- Process: Advancing quality through first-pass yield metrics
- Learning: Developing workforce skills while maintaining zero safety incidents
Technology business scorecard
Technology company scorecards emphasize innovation, customer acquisition, product development speed, and talent retention. The fast-paced nature of the sector requires metrics tracking agility and market responsiveness.
Strategic priorities include:
- Financial: Accelerating revenue growth through annual recurring revenue expansion
- Customer: Expanding market presence via customer acquisition rates
- Process: Speeding product development with reduced time to market
- Learning: Retaining top talent through competitive retention rates
Financial services scorecard
Financial services scorecards balance growth, risk management, regulatory compliance, and customer trust. These institutions use scorecards to navigate complex regulatory environments while driving business performance.
Critical focus areas encompass:
- Financial: Optimizing risk-adjusted returns through return on equity targets
- Customer: Strengthening client relationships via retention rates
- Process: Enhancing risk management with controlled credit loss rates
- Learning: Building digital capabilities to increase digital transaction percentages
Master scorecard cascading and alignment
Cascading transforms enterprise strategy into actionable objectives at every organizational level. Effective cascading helps front-line employees understand how their daily work contributes to strategic success while maintaining local autonomy and accountability.
Link enterprise strategy to department goals
The cascading process systematically translates enterprise-level objectives into department-specific goals supporting the overall strategy while addressing departmental realities. Start with enterprise strategic themes, identify how each department contributes to these themes, and translate enterprise objectives into department-specific language.
An enterprise objective like “improve customer satisfaction” cascades differently across functions:
- Marketing: Focuses on brand perception and communication
- Operations: Emphasizes service delivery speed and quality
- HR: Concentrates on customer service training and recruitment
This approach maintains strategic alignment while allowing departmental customization.
Create aligned team scorecards
Team-level cascading connects individual contributor work to organizational strategy. Team scorecards balance strategic alignment with operational relevance, ensuring daily activities drive high-level goals.
Best practices for team scorecard alignment:
- Limit objectives to 8-12 total across all perspectives to maintain focus
- Ensure at least 70% of objectives directly support departmental goals
- Provide operational metrics that matter to daily work
- Establish unambiguous ownership for results
Enable strategic autonomy at every level
Effective cascading balances strategic alignment with operational autonomy. Teams require freedom to determine how they achieve objectives while maintaining strict accountability for results.
Enabling autonomy within alignment involves:
- Setting outcome expectations while allowing flexibility in methods
- Providing teams with resources and authority to achieve objectives
- Establishing regular check-ins focused on progress and obstacles rather than micromanagement
This approach avoids over-cascading that creates bureaucratic overhead, focusing instead on strategic contribution.

Progress from static templates to living scorecards
Traditional static balanced scorecards typically fail to keep pace with modern business speed. Organizations achieve maximum value when scorecards evolve into dynamic, real-time performance management systems integrated into daily operations and decision-making.
Automate your scorecard updates
Manual scorecard updates create bottlenecks that reduce effectiveness and timeliness. Automated updates ensure data currency while significantly reducing administrative burden.
Common automation scenarios include:
- Financial KPIs: Updated directly from ERP systems
- Customer scores: Pulled automatically from survey platforms
- Operational metrics: Fed from production or project management systems
- HR metrics: Integrated from talent management databases
Automation enhances human decision-making by freeing time for analysis rather than data entry.
Real-time dashboards replace manual tracking
Real-time dashboards transform scorecards from periodic reporting into continuous performance monitoring systems. These dashboards provide immediate visibility into performance trends, allowing proactive management rather than reactive responses.
Dashboard design principles include:
- Exception reporting: Focusing attention on off-track metrics
- Visual indicators: Using colors and charts for rapid assessment
- Drill-down capabilities: For detailed analysis
- Mobile accessibility: Ensuring monitoring anywherem
AI-powered insights for faster decisions
Artificial intelligence enhances human decision-making by identifying patterns, predicting trends, and suggesting actions based on scorecard data. AI accelerates insight generation, allowing leaders to respond to emerging issues before they become crises.
AI applications in scorecard management include:
- Predictive analytics: Identifying trends and forecasting future performance
- pAnomaly detection: Serving as an early warning system
- Root cause analysis: Pinpointing performance issue sources
- Scenario modeling: Assisting strategic planning
The Portfolio Risk Insights feature in monday.com scans project boards and flags potential risks by severity, helping organizations spot critical issues at a glance without manually combing through data.
Try monday.comTransform strategy into execution with monday.com
monday.com transforms balanced scorecards into dynamic execution engines by integrating strategic objectives directly into operational workflows. The platform ensures strategy drives execution rather than existing separately, creating accountability and visibility at every level. Here’s how.
See your entire strategy in one place with customizable boards
monday.com lets you build dedicated boards for each scorecard perspective—financial, customer, process, and learning & growth. Each board includes customizable columns for objectives, KPIs, targets, and current performance, giving you a complete view of strategic health without jumping between systems. Formula columns automatically calculate performance metrics from underlying data sources, eliminating manual errors and ensuring your scorecard always reflects reality. Executive dashboards pull from these boards to provide real-time visibility into scorecard performance across all perspectives, so leadership can spot trends and make decisions faster.
Catch strategic risks before they derail your goals with AI-powered insights
Portfolio Risk Insights uses AI to automatically scan hundreds of projects and identify risks that could impact your scorecard objectives. Instead of manually reviewing every initiative, you get an early warning system that flags potential issues by severity, helping you intervene before small problems become strategic failures. This agentic AI capability acts as a continuous monitoring layer, freeing your team to focus on solving problems rather than hunting for them.
Put the right people on the right work with intelligent resource allocation
Built-in resource optimization analyzes skills, availability, and strategic priorities to recommend the best team members for each initiative. This ensures your most critical scorecard objectives get the talent they need to succeed, while preventing burnout and inefficient allocation. The platform considers workload balance and project requirements simultaneously, turning resource planning from a guessing game into a data-driven process that supports strategic execution.
Make sense of complex data instantly with AI categorization
AI Blocks automatically categorize performance data, initiatives, and risks by strategic theme or perspective, eliminating hours of manual sorting and tagging. Whether you’re organizing hundreds of projects or trying to understand which initiatives support specific objectives, the AI does the heavy lifting. monday sidekick can also answer questions about your scorecard data in natural language, making strategic insights accessible to everyone—not just data analysts.
Connect daily work to strategic impact through automated workflows
Every project and process in monday.com can link directly to specific scorecard objectives, creating clear line-of-sight from execution to strategy. Automations update scorecard metrics as projects progress and milestones are achieved, so your performance data stays current without manual intervention. Teams across departments collaborate on strategic initiatives while maintaining scorecard accountability, with continuous visibility showing exactly how daily work impacts strategic performance.This integration transforms your scorecard from a reporting tool into a living execution system.

Turn your balanced scorecard into action
Balanced scorecard templates give you a starting point, but real strategic impact comes from connecting those objectives to the work your teams do every day. That’s where most organizations struggle, and it’s exactly what monday.com solves.
Stop letting your strategy live in spreadsheets while your teams work somewhere else. Build scorecards that update automatically, catch risks before they derail your goals, and show everyone how their work connects to what matters most. See how monday.com turns strategic planning into strategic execution.
Try monday.comFrequently asked questions
How often should I review my balanced scorecard?
Most organizations review their balanced scorecard monthly at the operational level and quarterly at the strategic level. This cadence enables faster course corrections while allowing sufficient time for strategic initiatives to show impact.
Can I combine balanced scorecards with OKRs?
Yes, balanced scorecards and OKRs work well together. The scorecard provides the strategic framework while OKRs define specific quarterly execution goals, creating complementary systems for long-term strategy and short-term focus.
What is the optimal number of KPIs per perspective?
Each balanced scorecard perspective should include 2-4 KPIs to maintain focus and avoid measurement overload. This range provides sufficient insight without creating administrative burden.
How long does scorecard implementation typically take?
Balanced scorecard implementation typically takes 3-6 months for initial deployment, with an additional 6-12 months to achieve full organizational adoption. Success depends on leadership commitment and systematic rollout.
What is the difference between a balanced scorecard and a KPI dashboard?
A balanced scorecard is a strategic framework connecting objectives across four perspectives with cause-and-effect relationships. A KPI dashboard simply displays performance metrics without strategic context or interconnections.
Which balanced scorecard software works best for enterprises?
Enterprise balanced scorecard software requires real-time data integration, multi-level cascading capabilities, collaborative features, and AI-powered insights for strategic decision-making. The right solution depends on your specific needs and existing technology stack.