
In 1969, the first message ever sent over ARPANET, the early ancestor of the internet, was LO. We bet you can’t guess why? It was supposed to be LOGIN, but the network crashed mid-word.
Modern networks are usually reliable enough to stay up for longer than the time it takes to type two characters, but the challenge is still the same. When something fails, you need to know what happened, where, and why. Network performance monitoring (NPM) is what IT teams use to check a network’s vital signs, but the right approach depends on your goals, infrastructure, and team. This guide explores the concept of network monitoring in more detail, so you have all the best practices and network analysis tools you need to keep your network healthy and your users connected.
Try monday serviceKey takeaways
- Network performance monitoring is essential for spotting slowdowns, faults, and anomalies before they escalate into outages or security incidents.
- Tracking the right performance metrics gives IT teams a clear picture of network health and performance trends.
- Best practices such as establishing baselines, monitoring in real time, and integrating security provide consistent uptime and reliability.
- The right NPM tool should align with your infrastructure, scale with your needs, and integrate seamlessly into existing workflows.
- monday service combines AI-powered automation, real-time analytics, and integrations to help teams resolve network issues faster and keep operations running smoothly.
What is network performance monitoring?
Network performance monitoring (NPM) is the ongoing process of checking your network’s “vital signs” to keep it healthy, available, and fast. It means keeping an eye on key metrics like bandwidth, latency, errors, and uptime, then using that information to catch slowdowns or faults before they turn into outages. In other words, it’s like a health check for your network — spotting problems early so your business keeps running smoothly and your users stay happy.
Why is network performance monitoring important?
A network can be running perfectly one moment and grinding to a halt the next. Without visibility into what’s happening behind the scenes, you’re left guessing at the cause. The alternative? Here’s the specific value you’ll achieve from an investment in network performance monitoring.
Protecting profitability by preventing downtime
Downtime is often the result of small, undetected network performance issues that build up over time. An overloaded link or a configuration error can snowball into a full outage if they go unnoticed. When WhatsApp, Facebook, and Instagram went offline for 6 hours, the outage was estimated to cost parent company Meta $100 million in lost revenue and 5% of its stock value overnight.
Your business might not operate at that scale, but the principle is the same: missed performance problems can quickly halt your operations and erode customer trust. Meanwhile, network performance monitoring allows you to detect any issues before they take your systems, and your revenue, down.
Strengthening security by reducing threats
Many cyberattacks start as subtle changes in network performance. And if you’re not monitoring these warning signs, they can go unnoticed until the breach is well underway. In June 2025 alone, there were 33 publicly disclosed cybersecurity incidents, exposing over 16 billion records.
Network performance monitoring identifies these anomalies early, giving security teams the critical window they need to investigate and contain threats before they cause serious damage.
Maintaining compliance and avoiding regulatory penalties
In regulated industries like healthcare, finance, and government, even brief service interruptions can put you in breach of compliance requirements. The CrowdStrike outage of July 2024 disrupted 759 US hospitals, with 200+ suffering outages that directly impacted patient care, and in some cases, took more than 48 hours to recover. This type of breach can mean falling foul of regulations like HIPAA, which require timely access to patient records and continuity of critical services.
NPM gives you visibility to document any incidents and respond quickly, so you can avoid costly fines and reputational damage.
Optimizing user experience and operational efficiency
Slow systems frustrate customers and employees long before they fail completely. NPM makes performance data visible in real time, so you can fix issues before they impact your users and drain your resources. The result? A better quality of service, happier customers, and a more efficient operation.
What are the best practices for network performance monitoring?
Network performance monitoring works best when it’s guided by a few core principles. These best practices include:
- Establishing a performance baseline: Record normal operating conditions so you can quickly spot when something’s off.
- Monitoring in real time with automated alerts: Get instant notifications when performance drops, so you can respond before users are affected.
- Tracking both internal and external traffic: Include LAN, WAN, cloud, and VPN paths to see the full picture.
- Integrating security monitoring into NPM: Catch unusual traffic patterns that could indicate a breach already in progress.
- Prioritizing metrics tied to business outcomes: Focus on the KPIs that directly affect service delivery and customer experience.
- Analyzing historical trends: Identify recurring bottlenecks and forecast capacity needs before they become urgent.
Which network performance monitoring metrics should you track?
Not every number on your dashboard tells the full story. The key is to focus on the metrics that reveal how your network is really performing and where issues might be hiding. Here are the heavy hitters worth keeping an eye on.
- Errors: Packet loss, failed connections, and retransmissions that signal quality issues
- Bandwidth: How much capacity is being used versus available, so you can spot congestion or waste
- Latency: The time it takes for data to travel from source to destination; crucial for real-time apps
- Throughput: The actual data transfer rate your network delivers, which may differ from bandwidth
- Jitter: Variations in latency that can cause choppy calls, laggy video, or dropped streams
- Packet loss rate: The percentage of data packets lost in transit, often a sign of deeper issues
- Availability/uptime: How often network services are accessible; critical for meeting SLAs
- Utilization per device or link: Identifies overloaded or underused network segments
- Queue length: How many packets are waiting in transmission queues; long waits create bottlenecks
- SLA compliance metrics: How well you’re meeting contractual speed, uptime, and reliability targets
6 network performance monitoring software solutions
With the network performance monitoring market projected to grow from $4.13 billion in 2025 to $8.24 billion by 2032 (a CAGR of 10.4%), there’s no shortage of tools promising to keep your network in top shape. The challenge is choosing one that fits your infrastructure, team, and long-term goals.
To navigate the options, here’s a quick comparison of 6 platforms you may come across during your partner research. Each brings something different to the table, but only one combines advanced monitoring capabilities with the flexibility, integrations, and ease of use to keep your operations fully connected. Hint: it’s at the top of the list.
1. monday service
Best for: connecting IT and network operations in one collaborative platform
monday service is an intuitive, AI-powered service management platform that centralizes your monitoring alerts, workflows, and team communication into one connected workspace for faster, coordinated incident response.
Key features:
- AI-powered ticket classification and auto-routing to the right teams in seconds
- 72+ integrations to connect monitoring tools, communication apps, and IT systems
- Flexible customization with 27+ board views, 36+ column types, and 25+ dashboard widgets
Pricing: Starts at $26/seat/mo
Try monday service2. SolarWinds
Best for: in-depth infrastructure monitoring at scale
SolarWinds offers a suite of network and infrastructure monitoring tools designed for large, complex environments, with deep visibility into performance, availability, and traffic patterns across multi-vendor networks.
Key features
- Network performance dashboards with customizable metrics
- Advanced alerting and automated response options
- Flow-based traffic analysis for bandwidth optimization
Pricing: Starts at $6 per node/mo
3. Cisco
Best for: enterprise-grade network visibility and control
Cisco’s network performance monitoring solutions provide robust tools for managing, securing, and optimizing mission-critical networks, with a focus on reliability and compliance.
Key features
- End-to-end network visibility with real-time analytics
- Integrated security monitoring to detect and block threats
- Support for multi-cloud and hybrid network environments
Pricing: Custom pricing is available on request
4. Datadog
Best for: unified monitoring across cloud and on-prem environments
Datadog combines network performance monitoring with application, infrastructure, and log analytics, giving teams a single platform to track and correlate performance across their entire technology stack.
Key features
- Real-time network flow monitoring with traffic segmentation
- Correlation of network metrics with application and infrastructure data
- AI-powered anomaly detection for faster root cause analysis
Pricing: Starts at $15 per host/mo
5. Paessler PRTG Network Monitor
Best for: sensor-based network monitoring
Paessler PRTG offers a customizable monitoring solution that uses a “sensor” model. Teams can track the metrics they care about across networks, servers, and applications.
Key features
- Sensor-based monitoring for bandwidth, uptime, and performance metrics
- Built-in alerts with flexible threshold settings
- Support for SNMP, NetFlow, and packet sniffing for deep network visibility
Pricing: Starts at €137/mo
6. Sui
Best for: AI-powered real-time analytics
Sui is a network performance monitoring solution focused on instant, AI-driven visibility. It captures and analyzes live metrics—such as latency, bandwidth, and packet loss—so teams can respond to anomalies the moment they appear.
Key features
- AI-powered anomaly detection for faster incident triage
- Real-time dashboards that visualize performance trends as they happen
- Automated alerts to keep teams informed of critical changes
Pricing: Custom pricing is available on request
Optimize network performance monitoring with monday service
Network performance monitoring only works if you can act quickly on the insights it generates. Too often, monitoring tools flag problems but leave IT teams flip-flopping between systems, hunting for context, or relying on manual processes to get fixes moving. What you need instead is a reliable, intuitive platform built to take your monitoring to the next level.
monday service brings every moving part of your service operation into one connected workspace. It’s designed for speed, clarity, and adaptability, so when a network issue arises, the right people have the right information at the right time. From the first alert to final resolution, monday service keeps everyone aligned and your network performing at its best. Here’s what you can accomplish with our platform.
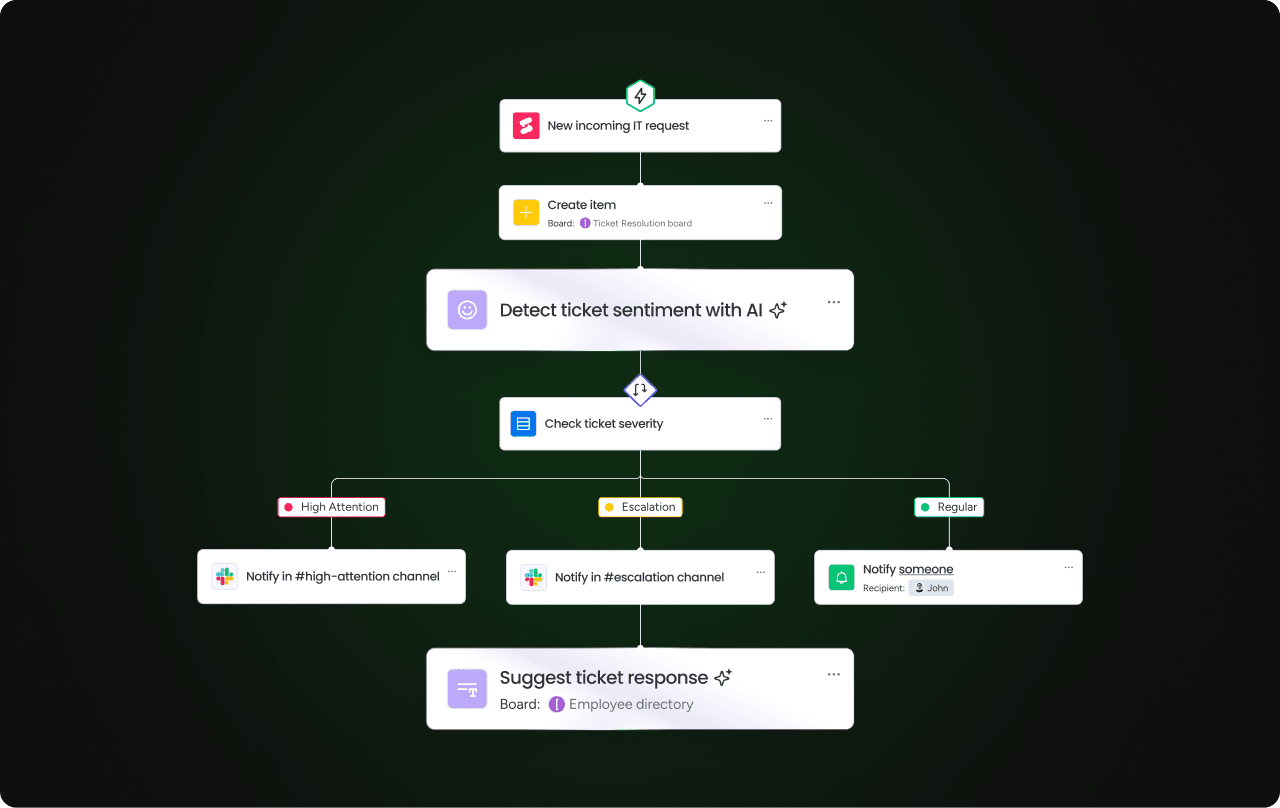
1. Resolve issues before they impact users with AI-powered service workflows
monday service’s built-in AI Blocks and smart workflows detect anomalies from your monitoring tools and trigger the right actions without you lifting a finger. They can automatically categorize incidents, pre-fill ticket details with extracted data, and route them to the right owner, so fixes start within seconds, not hours.
2. Scale your monitoring capacity without adding headcount
Network monitoring is a full-time job — one you can easily scale with our AI-powered Digital Workforce, who act on your behalf 24/7. These autonomous agents monitor performance signals, escalate issues, and initiate tasks, giving your team continuous coverage without manual support. Best of all? They learn from human interaction to improve over time, so they get better at spotting the network problems that matter most, giving you continuous, intelligent coverage without increasing team size.

3. Make data-driven decisions with real-time service analytics
Network monitoring data isn’t the type of information you want to dig around for in the middle of a critical incident. monday service offers customizable, real-time dashboards powered by its built-in analytics. See performance trends, error spikes, and capacity risks at a glance, so you can prioritize the fixes that matter most and make confident, timely decisions.
4. Auto-convert critical issues into urgent tickets
Go from alert to action in a flash. monday service auto-creates detailed service tickets with context, owners, and SLAs attached when a critical network alert strikes. For example, if a monitoring tool detects unexpected packet loss on a core router, monday service will set up your ticket and route it to the network operations team so your response stays structured and efficient right from detection through resolution.
5. Connect monitoring across your entire tech stack with built-in integrations
monday service bridges your ecosystem by integrating with tools like Slack, Gmail, Outlook, Azure DevOps, and API-based NPM tools. Pull in alerts and share updates as you collaborate across platforms to solve network issues faster, with full visibility and zero context switching.
Try monday serviceHow do AI and automation support network performance monitoring?
Even the most experienced IT team can’t watch every metric, every second of the day. That’s where AI and automation step in as integral components of monday service. AI can analyze vast amounts of performance data in real time, spotting weird patterns or anomalies that might take a human hours or days to detect.
Automation then takes the next step, triggering alerts, creating tickets, or even launching predefined workflows to fix common issues without manual intervention.
As a result, problems are detected and resolved earlier, often sorted before your users ever notice. Instead of reacting to outages, your team can focus on strategic improvements, while knowing AI has its eyes on the network 24/7.
How to monitor network performance in 7 steps
Effective network performance monitoring requires a process that gives you complete visibility and actionable insights. Here’s how to do it right:
- Map your network infrastructure: Identify all your devices, connections, and critical applications, so you know exactly what to monitor.
- Select the right monitoring tools: Choose a platform that supports your environment, integrates with existing workflows, and captures your key metrics.
- Define baseline performance metrics: Record benchmarks for normal operation across bandwidth, latency, errors, etc.
- Configure alerts and thresholds: Set up triggers for deviations beyond acceptable ranges.
- Enable continuous monitoring: Implement real-time data collection across your network segments.
- Review analytics and reports: Use historical data to uncover trends and recurring issues.
- Adjust configurations and capacity: Act on insights to optimize performance and prevent future problems.
Monitor your network performance to precision with monday service
The difference between a stable network and a costly outage often comes down to how quickly you can see and act on performance changes. monday service gives you the clarity, speed, and collaboration tools to protect uptime and keep your operations running at their best.
With our AI-driven workflows, you’ll spend less time chasing alerts and more time improving the network experience for your users. Get a trial of monday service to start monitoring your network proactively, without the effort.
Try monday serviceFAQs about network performance monitoring
What are the most reliable network performance monitoring solutions?
The most reliable network performance monitoring solutions are those that deliver high uptime, accurate insights, and regular feature updates to keep pace with evolving needs. Well-known options include SolarWinds, Cisco, Datadog, and monday service. For companies that require consistently available monitoring, monday service is a strong choice thanks to its 99.9% uptime commitment for enterprise customers and new feature releases every month.
What type of network monitoring data summarizes or analyzes network flow or performance data?
Flow data, such as NetFlow, IPFIX, and sFlow, summarizes network traffic patterns and performance.
- NetFlow (developed by Cisco) collects and analyzes IP network traffic to see where it’s coming from and going to.
- IPFIX (Internet Protocol Flow Information Export) is a standardized version of flow reporting that works across multiple vendors.
- sFlow samples packets and exports both packet and interface counters for high-speed traffic analysis.
This type of data shows which applications, endpoints, or protocols use bandwidth, making it easier to spot any unusual activity or congestion.
What is the significance of monitoring queue length in network performance?
Queue length measures how many data packets are waiting to be transmitted at a network device or interface. Monitoring it is important because long queues often signal congestion, which can lead to slower application performance. Tracking queue length enables IT teams to spot bottlenecks early and take action before they impact users.
How does Sui's real-time analytics system help in monitoring and optimizing network performance?
Sui’s real-time analytics system tracks key network metrics as they happen. This live visibility helps IT teams detect anomalies immediately, so they can investigate and decide how to optimize performance.
How do you measure network performance?
IT teams measure network performance by tracking key metrics such as bandwidth, latency, throughput, jitter, packet loss, and uptime. They use network monitoring tools to collect this data and compare it against baseline values or SLA targets to determine if the network meets performance expectations.
What does NPM mean in networking?
In networking, NPM stands for network performance monitoring. It’s the process of continuously tracking, analyzing, and optimizing the network’s health, availability, and speed to deliver a reliable, high-quality service for users and applications.