
Enterprise networks now span offices, cloud platforms, and remote endpoints. Manual methods can’t keep pace and blind spots expose organizations to risk.
Network mapping tools provide a live picture of the entire environment. They reveal every device, connection, and dependency, helping IT teams protect performance, strengthen security, and maintain operational clarity.
Use this guide to understand how mapping works, what features matter most, and which tools lead the market in 2025. You’ll also see how platforms like monday service helps IT leaders transform raw mapping data into faster resolutions and better outcomes.
Key takeaways
- Network mapping tools give IT teams a clear, up-to-date view of devices, dependencies, and traffic flows.
- Automated discovery reduces blind spots, saves time, and scales as networks expand.
- Strong platforms combine topology mapping with monitoring, reporting, and compliance support.
- monday service turns mapping signals into tickets, dashboards, and workflows to cut resolution times and improve collaboration.
Why network mapping matters (and what holds teams back)
A network map captures the current state of your environment, while a diagram shows the intended design. Leaders depend on maps for accurate, day-to-day decision making.
Topology is another piece of the picture. Bus, star, mesh, and hybrid structures all shape how devices are organized and how traffic moves. Mapping tools expose these patterns, so teams can manage risk and optimize performance with confidence.
How network mapping works: discovery methods and tradeoffs
Network mapping begins with discovery, a process that involves identifying all devices, connections, and traffic flows. Tools use different methods to capture this data, each with tradeoffs IT leaders should understand.
Choose active or passive scanning
- Active scanning sends probes into the network to identify devices and gather information. This approach is thorough but can create extra traffic.
- Passive scanning monitors existing traffic without injecting additional probes. It avoids extra load but may miss devices that generate little traffic.
Decide on agent or agentless
- Agent-based mapping requires software to be installed on devices, which provides detailed information but can be harder to deploy at scale.
- Agentless mapping uses protocols like SNMP or APIs to gather data without installation. It’s easier to roll out but may not capture every detail.
Collect data with SNMP, NetFlow, APIs, or packet capture
- SNMP polling queries devices for status and configuration details.
- NetFlow tracks traffic patterns to show how data moves across the network.
- APIs connect directly with devices and systems to pull structured information.
- Packet capture analyzes network traffic in detail, often used for troubleshooting.
Map hybrid, multi-cloud, and SDN environments
Modern networks span on-prem, cloud, and virtualized systems. Ephemeral resources and SDN abstractions change constantly, creating complexity that static diagrams can’t capture. Effective mapping platforms connect directly with cloud APIs and virtualization layers, giving teams one up-to-date view of both physical and virtual assets.
Want to learn more about cloud management? Check out our Cloud management made simple: Benefits, features, and implementation guide.
Remap often to stay accurate
Networks morph, devices are added, moved, or retired, and traffic patterns evolve. Remapping should be frequent enough to keep the data relevant. Automated discovery helps ensure maps remain accurate without requiring manual effort.
Must-have features of network mapping tools
The right tool should do more than generate a static picture of devices. Effective platforms combine discovery, visualization, monitoring, and reporting so IT teams always know what’s happening across the network.
- Discover changes automatically: Tools should identify devices and connections as soon as they appear. Incremental updates keep maps accurate without needing a full rescan every time something changes.
- Explore topology in clear, interactive maps: An intuitive visual layout makes it easy to understand complex environments. Look for maps that support filtering, zooming, and customization so teams can focus on the areas that matter most.
- Monitor health in real time: Seeing the network is only part of the picture. Continuous monitoring adds performance and availability data, helping teams detect issues before they affect users.
- Alert teams and report to leaders: Automated alerts ensure incidents get attention right away. Reporting features make it simple to share insights with leadership through dashboards and summaries tailored to decision-makers.
- Trace dependencies across apps and devices: Understanding how devices and applications depend on each other helps IT teams trace issues to the root cause. This visibility reduces downtime and speeds up resolution.
- Integrate with ITSM, CMDB, asset, and ticketing systems: Maps provide the most value when they connect to other IT systems. Integrations ensure that discovery data flows into service desks, asset inventories, and configuration databases.
- Enterprises face strict audit and regulatory requirements: Strong mapping tools help by generating audit-ready logs, flagging unauthorized devices, and supporting zero trust segmentation. Many also include built-in reports aligned to standards like HIPAA, PCI DSS, and SOC 2, cutting prep time for audits and reviews.
- Scale performance as networks grow: As networks grow, tools must scale without creating bottlenecks. Look for solutions that can handle thousands of devices, multiple sites, and hybrid environments without slowing down.
How to choose the right tool
Every organization comes to the table with different scale, governance needs, and team capacity. Use this section to decide what fits your environment, not an abstract ideal.
Start with outcomes, then match capabilities
If the goal is faster incident flow and leadership reporting, prioritize tools that produce an up-to-date map and feed data into service context. If the priority is deep packet analysis, choose platforms that excel at low-level telemetry even if setup takes longer.
Decision criteria
- Usability: New users should reach value quickly. Admin tasks (adding sites, adjusting polling, changing credentials) shouldn’t require specialty skills.
- Onboarding: Consider credential vaults, discovery wizards, and templates that simplify first-time scans and system links.
- Scalability: Look for proven performance across thousands of nodes, multiple regions, and multi-cloud footprints.
- Support: Vendor documentation, response times, and customer communities matter once you expand beyond a pilot.
- Cost: Evaluate price against device counts, sites, and add-ons. Include storage and data-retention needs.
- Security: Role-based access, encryption in transit/at rest, and audit trails should be standard.
Important tradeoffs
- Some teams prefer simplicity and a clear network view over granular analytics; others need deeper telemetry and are willing to manage extra configuration.
- Agents provide richer context on endpoints but add lifecycle work; agentless approaches move faster with less detail.
- Frequent polling improves currency but can increase load; tune intervals per site or device tier.
Pricing and licensing models (TCO matters)
Most vendors offer subscriptions (often tied to device or interface counts). Others rely on perpetual licenses with maintenance. The sticker price rarely tells the full story. Account for:
- Data retention or log storage overages
- Premium modules (advanced reporting, AI add-ons)
- Training and enablement costs
- Internal time to maintain open-source stacks (hardening, upgrades, plugin vetting)
Open-source can minimize upfront spend yet demands engineering time; commercial platforms often cost more initially and return value through faster onboarding and responsive support.
Adoption and migration
Switching tools touches discovery, credentials, security reviews, and downstream systems. Use a structured migration plan:
- Pilot in one environment to validate discovery depth and API connectors
- Import existing inventories, compare against a live scan, and reconcile differences
- Connect the new platform to ITSM, CMDB, observability, and asset sources before broad rollout
- Train admins and frontline users on both the map and the incident flow it supports
- Track performance and alert noise for the first 90 days, then tune polling frequency and thresholds
Top network mapping tools in 2026
The market spans cloud-delivered discovery engines, broad monitoring suites, and community-led projects. Your best choice depends on scale, required telemetry, and how you plan to move from map to ticket to resolution.
How these top tools compare at-a-glance
Each platform brings unique strengths to network mapping. This table highlights where they excel and what type of organizations benefit most.
| Platform | Best for | Key strengths |
|---|---|---|
| monday service | Enterprises needing service integration with mapping | AI-driven incident management, ticketing, leadership reporting, cross-team handoff |
| Auvik | MSPs and IT managing multiple networks | Automated discovery, cloud delivery, centralized multi-site management |
| SolarWinds Security Observability | Large enterprises and compliance-heavy organizations | Detailed Layer 2/3 views, compliance reports, customizable visuals |
| ManageEngine OpManager | Teams seeking mapping plus infrastructure monitoring | Broad monitoring suite, multi-vendor support, workflow automation |
| Nagios / Zabbix / Netdisco / OpenNMS | Smaller teams or Linux-focused shops | Low cost, flexible customization, strong community backing |
| Specialized visual-first tools | Executive communication and stakeholder reviews | Polished layouts, presentation-ready maps, lightweight discovery |
monday service
monday service brings network mapping into everyday IT service operations. Instead of leaving network data in a silo, it connects mapping insights directly to tickets, projects, and dashboards. When a monitoring tool detects a change or outage, that signal flows into monday workflows, where it’s logged, prioritized, and enriched with context from CRM, vendor records, or asset systems.
AI capabilities take this further. Incidents are classified automatically, routing work to the right team and surfacing early warnings before they escalate. Dashboards tie network health directly to service KPIs (key performance indicators) like SLA (service level agreement) compliance and ticket volume, giving leadership a clear view of impact without needing to interpret topology diagrams.
The platform complements existing topology tools rather than replacing them. It creates a single layer where network alerts connect with service workflows, ensuring faster resolutions, cleaner cross-team handoffs, and leadership-ready reporting.
Best for: Enterprises that want network insights to drive faster MTTR, streamlined collaboration, and decision-ready dashboards.
Key features
- Ticket management linked to mapping alerts and device context
- AI actions for incident classification, routing, and suggested next steps
- SLA tracking and service analytics
- Dashboards that connect network health to service KPIs
- System links to CRM, vendor/contract records, and asset sources
Pricing
- Pricing starts at $26/seat/mo
- 3 plans available: Standard, Pro, and Enterprise
- 14-day free trial available
What users say
We as a company are more connected and the visibility into where we are in the development of a project is unmatched. When everyone buys in to use the program, it truly does allow all members to be connected in a way that meetings can’t provide. — Danielle G.
Auvik
Auvik delivers cloud-based network mapping built for speed and scale. It automatically discovers devices, updates topologies, and monitors performance across multiple sites. Its multi-tenant design makes it a strong fit for managed service providers (MSPs) that oversee many client environments at once.
Deployment is simple: install collectors, provide credentials, and Auvik starts pulling data within minutes. From there, teams get an always-current view of the network without heavy manual upkeep. Centralized controls make it easy to enforce standards and manage credentials across clients.
Best for: MSPs and IT departments managing multiple sites and seeking a cloud-first tool with minimal administrative overhead
Key features
- Automated discovery with continuous topology updates
- Live monitoring of device performance and traffic patterns
- Alerts that highlight issues before they escalate
- Centralized credential and policy management across networks
- Cloud-first delivery for remote access and fast updates
Pricing
- Subscription pricing based on device count.
- Free trial available.
What users say
What I like best about Auvik is how effortlessly it maps out the entire network. The automatic device discovery and live topology view make it really easy to understand what’s connected where, without having to dig through a bunch of configs or spreadsheets. — Kapil R.
SolarWinds Security Observability
SolarWinds Security Observability offers deep mapping and monitoring capabilities tailored to compliance-driven environments. It provides Layer 2/3 maps, customizable visualizations, and policy-based controls, making it easier to manage complex infrastructures with confidence.
As part of the larger SolarWinds ecosystem, it integrates with modules for performance, logging, and security. This creates a richer service context where network data is paired with event insights and compliance checks. Organizations that must meet frameworks like HIPAA or PCI DSS benefit from built-in reporting that reduces audit prep time.
Best for: Large enterprises that need detailed topology discovery and compliance-ready reporting.
Key features
- Automated mapping across large, distributed environments
- Layer 2/3 topology views with customizable layouts
- Reports aligned to compliance frameworks (PCI, HIPAA, SOC 2)
- Policy controls to standardize configurations and track changes
- Native integration with the SolarWinds monitoring suite
Pricing
- Perpetual licensing with additional maintenance costs.
What users say
Solarwinds NPM provides automated networking tools to enable discovery and monitoring across network devices, in common devices like firewalls, switches, and load balancers. — Aftab A.
ManageEngine OpManager
ManageEngine OpManager combines mapping, fault detection, and performance monitoring in one tool. It’s designed for IT teams that want to simplify their stack without sacrificing visibility.
The platform supports a wide range of vendors and integrates with ManageEngine’s broader IT management suite. Admins can customize dashboards to match their priorities, while automation workflows reduce repetitive tasks like responding to threshold breaches. Remote deployment and SNMP/API support make it easier to roll out across distributed environments.
Best for: IT teams consolidating network monitoring, mapping, and alerting into a single, integrated platform.
Key features
- Layer 2/3 network maps enriched with device health status
- Fault and performance monitoring with automated alerts
- Multi-vendor device and protocol support
- Workflow automation to reduce manual overhead
- Dashboards and reports tailored for both operations teams and leadership
Pricing
- Subscription or perpetual licensing based on device count.
What users say
OpManager is one of the best tools for monitoring IT infrastructure. Easy to install and integrate with almost every OEM… It supports all SNMP versions and enables quick remote deployment. Customer support is excellent and responsive. — Rajiv T.
Free and open-source tools
Open-source platforms provide flexible options for teams with the skills and time to maintain them. They offer plugins, strong community support, and no licensing fees, but often require more effort for setup, security hardening, and updates.
Best for: Cost-conscious teams, lab environments, or organizations that prioritize customization and have in-house expertise.
Popular options include
- Nagios: A long-standing monitoring tool with plugins that extend into mapping.
- Zabbix: Offers discovery and dashboards that reflect the current topology.
- Netdisco: Specialized for Layer 2 discovery in large, switch-heavy environments.
- OpenNMS: A modular, enterprise-focused option that scales well.
Pricing
- Free to download and use
- Support, security, and upgrades depend on internal teams
What users say
Valued for flexibility and community-driven innovation, but often noted as resource-intensive to maintain.
Specialized visual-first tools
Some tools focus less on monitoring depth and more on presentation. They generate polished maps that are easy to share with executives, project managers, and non-technical stakeholders. IT leaders often pair these with monitoring systems for added context.
Their strength lies in communication. By turning complex networks into simple visuals, they help stakeholders understand service impact and make informed decisions faster.
Best for: Teams that need presentation-ready visuals to explain network health and service impact.
Key features
- Customizable layouts and map layers
- Presentation-ready exports and reports
- Lightweight discovery or API-driven imports from monitoring tools
Pricing
- Ranges from free or low-cost tiers to enterprise licenses.
What users say
Praised for producing clear, professional visuals that make complex networks easier to explain to leadership and stakeholders.
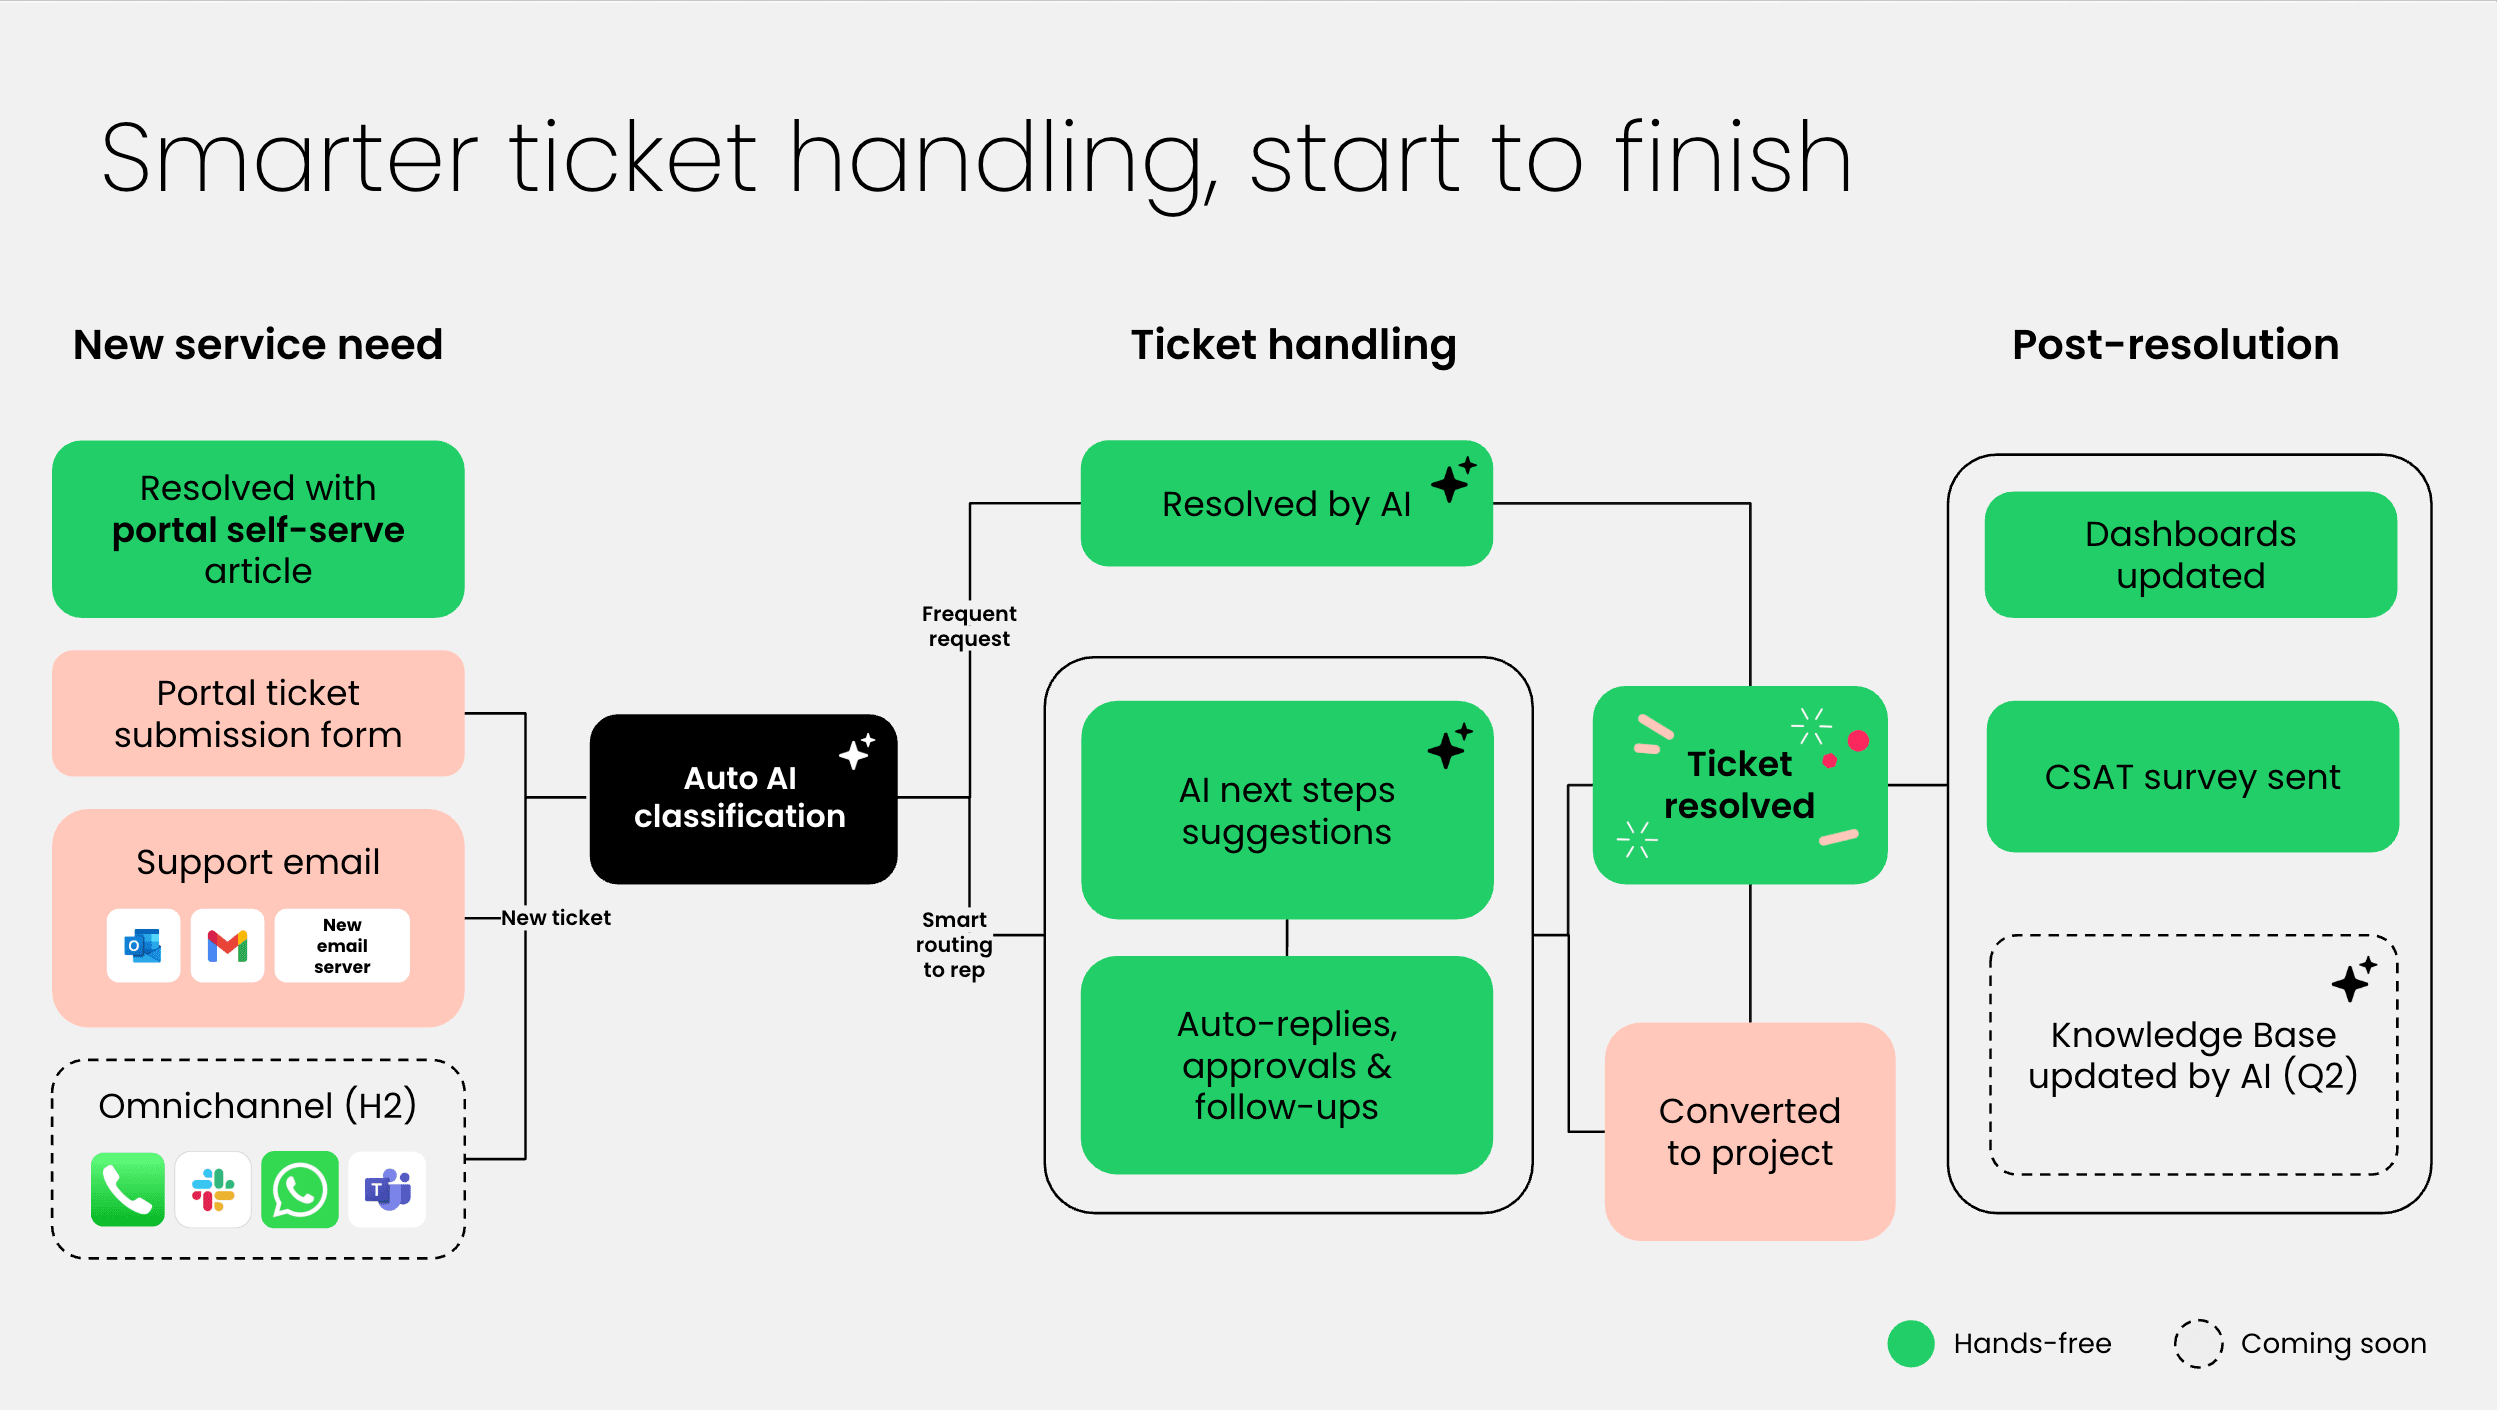
How monday service connects mapping to service workflows
Network mapping on its own delivers a live state of the infrastructure. The real payoff comes when those insights feed into service context — where alerts, tickets, and analytics work together to shorten MTTR and improve decision-making. The monday service platform provides that bridge.
Auto-create tickets from network alerts
When a monitoring or mapping tool detects an outage, an alert can automatically generate a ticket in monday service. The issue is logged instantly, assigned to the right team, and enriched with relevant records. This eliminates manual gaps that let incidents slip through.
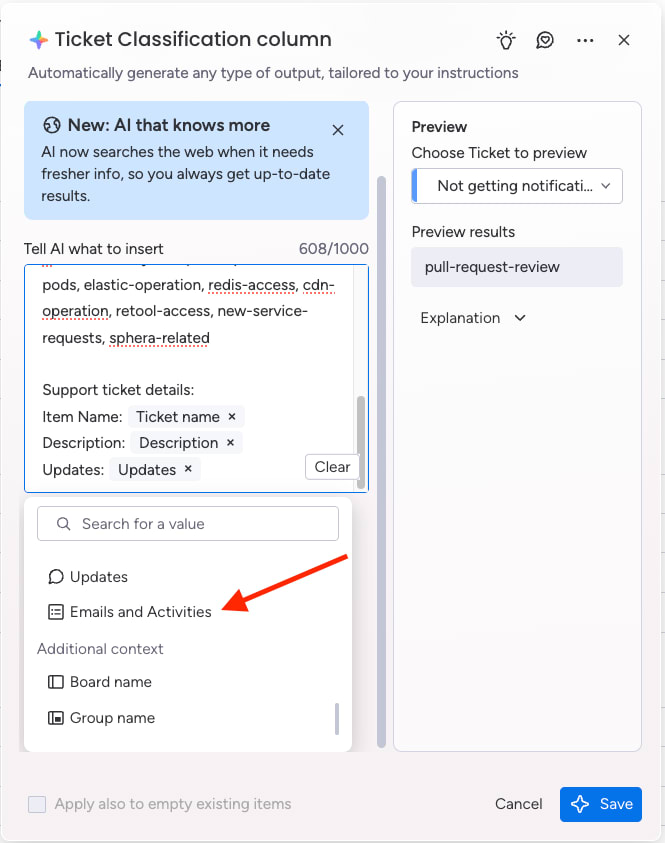
Use AI to predict issues and route work
AI classifies alerts and anticipates future issues. Predictive capabilities surface early warning signs, from unusual traffic spikes to patterns that suggest device fatigue, so teams can act before outages occur. Automations then ensure the alert is routed to the right workflow, and progress stays transparent.
Advanced use cases include spotting anomalies in traffic flows, flagging capacity risks, or forecasting device failures based on historical growth. This shifts mapping from reactive troubleshooting to proactive planning.
Share leadership-ready dashboards that tie health to SLAs
Dashboards link network health to service KPIs, such as ticket volumes, SLA compliance, or response times. Executives don’t need to interpret topology charts; instead, they see direct service impact and board-friendly reporting.
Collaborate across dev and vendor teams
Complex incidents often require a cross-team handoff. Tickets can be escalated to development or routed to vendor partners directly within monday service, keeping all context in one place. This reduces back-and-forth and accelerates fixes.
Pull context from CRM, vendor, and asset systems
System links ensure that every ticket includes information about affected assets, support contracts, or vendor contacts. That context streamlines troubleshooting and eliminates wasted cycles.
Adopt smoothly with existing mapping outputs
Organizations don’t need to abandon their current tools. Existing topology data can be connected into monday service so alerts and discovery outputs continue to flow, preserving continuity while layering in stronger workflows.
Case scenario: mapping in action
A mid-size enterprise cut outages significantly after aligning mapping data with service workflows.
Before: Monitoring tools generated alerts, but tickets weren’t created consistently. Some incidents were missed altogether, and resolution times dragged.
After: Connecting mapping alerts to monday service meant every incident triggered a ticket automatically. The new workflow looked like this:
- Discovery: monitoring tools detected issues in an up-to-date map
- Alert: signal created an automated ticket
- Ticket: the task was assigned instantly with full context
- Resolution: collaboration and escalation happened within the same platform
- Report: leadership reviewed dashboards showing incident impact and team response
The change gave the IT team a single current topology view, shortened resolution times, and gave executives confidence in the data driving decisions.
Challenges and pitfalls to watch for
Even the best mapping platforms come with risks IT leaders should plan for:
- Stale or incomplete maps: Networks evolve quickly; outdated maps create blind spots.
- False positives or cluttered visuals: Overly detailed layouts can overwhelm rather than clarify.
- Resource overhead from scanning: Aggressive polling can strain large environments.
- Data silos: Mapping that isn’t tied to service context leaves teams without the full picture.
- Governance gaps: Without policies, maps can expose sensitive information.
- Scaling into multi-cloud and SDN: Distributed, ephemeral resources demand tools that keep a continuous picture across environments.
The future of network mapping
Mapping continues to evolve with enterprise infrastructure. Watch for:
- AI-driven observability: anomaly detection and predictive insights woven into live network views.
- Cloud-native mapping: native connectors for AWS, Azure, and Google Cloud to follow ephemeral services.
- Automation tie-ins: tighter system links with SDN and intent-based networking to adjust topology dynamically.
- Business overlays: visuals that connect devices directly to the business services they support, making maps more valuable in boardrooms.
Cut resolution times with live, AI-ready network maps
Modern mapping tools help IT teams maintain an up-to-date view of their environments. They close blind spots, clarify dependencies, and give teams the service context needed to act quickly.
AI and automation extend that value by forecasting risks, keeping the map current, and turning raw data into insights. This reduces manual work and lets leaders focus on strategy instead of chasing alerts.
monday service reinforces the process by connecting mapping signals to tickets, dashboards, and cross-team workflows. The outcome: accelerated fixes, smoother collaboration, and decision-ready reporting that keeps leadership aligned.
Try monday service and turn network signals into faster resolutions.
FAQs
What’s the difference between a network map and a network diagram?
A network map shows the current state of all devices and connections in a network, while a diagram represents a planned or ideal design.
How do automated mapping tools work?
Automated mapping tools scan the network using methods like SNMP polling, NetFlow, or APIs to identify devices, connections, and dependencies, then generate an up-to-date map.
Are there truly free mapping tools for Windows?
Yes. Open-source tools like Nagios, Zabbix, and Netdisco work on Windows and can provide mapping features, though they often require more configuration and maintenance.
What features matter most for large enterprises?
Features that matter most to large enterprises include scalability, automated discovery, integrations with IT systems, security controls, and executive-ready reporting are key for enterprise environments.
How do mapping tools help with cybersecurity?
Mapping tools help with cybersecurity by detecting unauthorized devices, supporting network segmentation, and providing audit trails, which are critical for identifying vulnerabilities and maintaining compliance.
Can these tools produce executive-ready reports?
Many tools include reporting and dashboard features that summarize network health, incidents, and trends in a format designed for leadership.
How do mapping tools integrate with ITSM, CMDB, and observability stacks?
Most enterprise tools offer connectors or APIs to sync discovery data with IT service management platforms, configuration databases, and monitoring systems.
What’s the best way to migrate from legacy tools?
Start by exporting existing maps and device inventories, then import or sync them into the new platform. Test integrations with other IT systems before fully transitioning.