

Shipping more product, faster, is the constant drumbeat for development teams. But what happens when the rhythm is off? Work gets stuck, deadlines slip, and backlogs grow, all because there’s no clear view of the path from idea to deployment. This lack of clarity makes it difficult to plan accurately, align with business goals, or build team confidence. This lack of clarity makes it difficult to plan accurately, align with business goals, or build team confidence.
This is where Scrum metrics make a critical difference. Instead of relying on gut feelings, these data points provide objective insights into your team’s health, predictability, and delivery pace. They help you answer key questions: are we planning accurately? Where are our bottlenecks? Are we delivering real value to customers?
This article walks through the most essential Scrum metrics every agile team should track, from sprint velocity to customer satisfaction. We will explore how to use them to improve planning, remove bottlenecks, and demonstrate value. Take a few minutes and join us as you’ll also learn how to avoid common pitfalls and implement a system for tracking that supports your team’s unique workflow.
Key takeaways
- Start small: focus on three to four core Scrum metrics such as agile velocity, cycle time, and sprint goal success rate rather than tracking everything at once.
- Use metrics wisely: treat them as health indicators that guide improvements, not as targets to hit or ways to judge individuals. This keeps collaboration healthy and outcomes real.
- Balance speed with quality: track delivery pace alongside defect rates and customer satisfaction to make sure value is sustainable, not short-lived.
- Automated insights: metric collection and real-time dashboards in monday dev reduce manual tracking and connect seamlessly with your existing tools.
- Make it part of Scrum: bring metrics into sprint ceremonies by reviewing burndown charts in stand-ups, velocity in planning, and trends in retrospectives.
What are Scrum metrics?
Scrum metrics are the data points teams track to measure performance and guide improvement, and they’re critical for long-term success. According to Parabol’s Agile Statistics, 27% of teams say a lack of defined metrics holds back their Agile transformations.
These Agile metrics highlight how the team works, where bottlenecks slow things down, and whether value is being delivered consistently. Common Scrum metrics include Agile velocity, cycle time, and quality measures, all of which provide a clear picture of team performance.
Unlike traditional metrics, Scrum metrics focus on outcomes and Scrum values. They encourage continuous improvement and team collaboration rather than judging individual performance or locking work into rigid deadlines. The goal is to open up constructive conversations that drive progress.
12 essential Scrum metrics every Agile team should track
Every Scrum team needs a balanced set of metrics that cover different aspects of their work. You don’t need to track everything — just the metrics that help answer your most pressing questions about team performance and delivery.
Sprint metrics
Sprint metrics help you understand what happens within each Scrum sprint cycle. These measurements give you immediate feedback on planning accuracy and execution effectiveness.
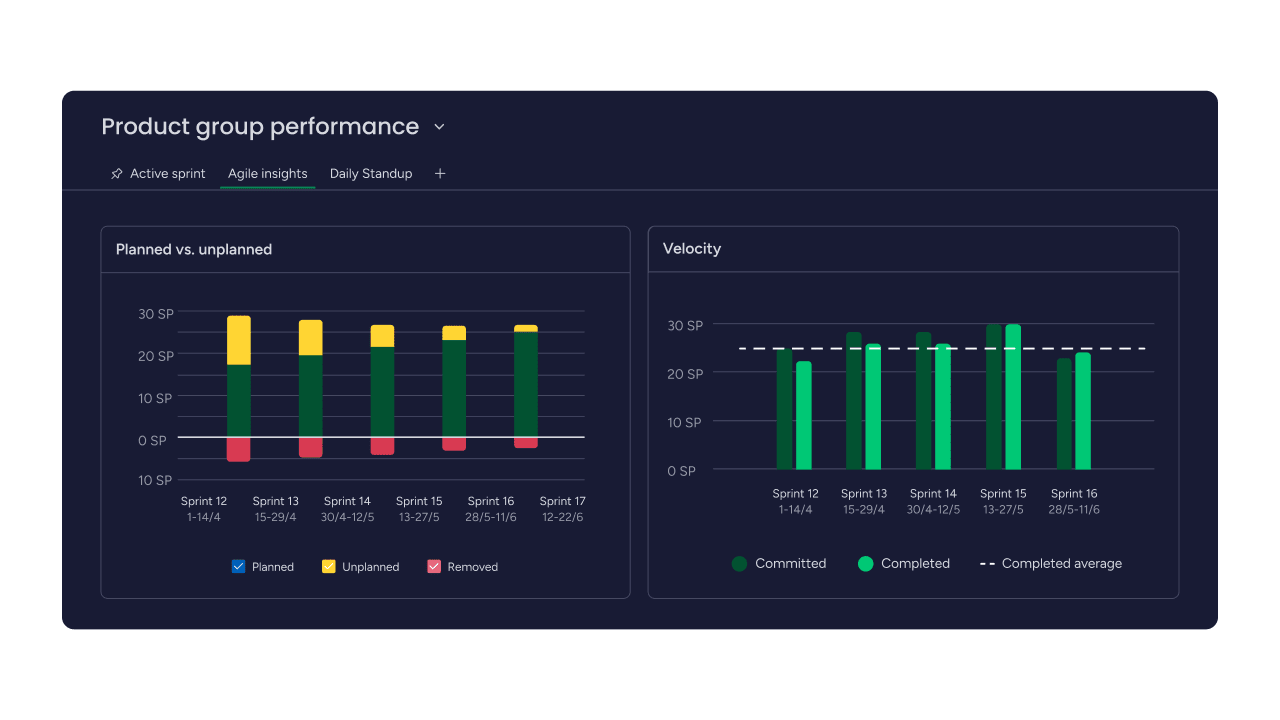
1. Sprint velocity
Velocity is the amount of work your team completes in a sprint, measured in story points or completed stories. This metric helps you forecast future sprints and understand your team’s sustainable pace.
To calculate velocity, add up the story points of all completed items at sprint end. Track this across multiple sprints to find your average range. Remember — velocity varies naturally, so look for trends rather than exact numbers.
2. Sprint burndown chart
A burndown chart shows remaining work versus time left in your sprint. This visual helps you spot problems early and adjust your approach before it’s too late.
The chart visualizes progress against an ideal timeline, making it easy to see if you’re on track. It consists of two key lines that tell the story of your sprint’s progress:
- Ideal line: shows perfect progress from start to finish.
- Actual line: shows your real progress day by day.
When the actual line stays above the ideal line, you might not finish everything. When it drops suddenly, scope might have been removed.
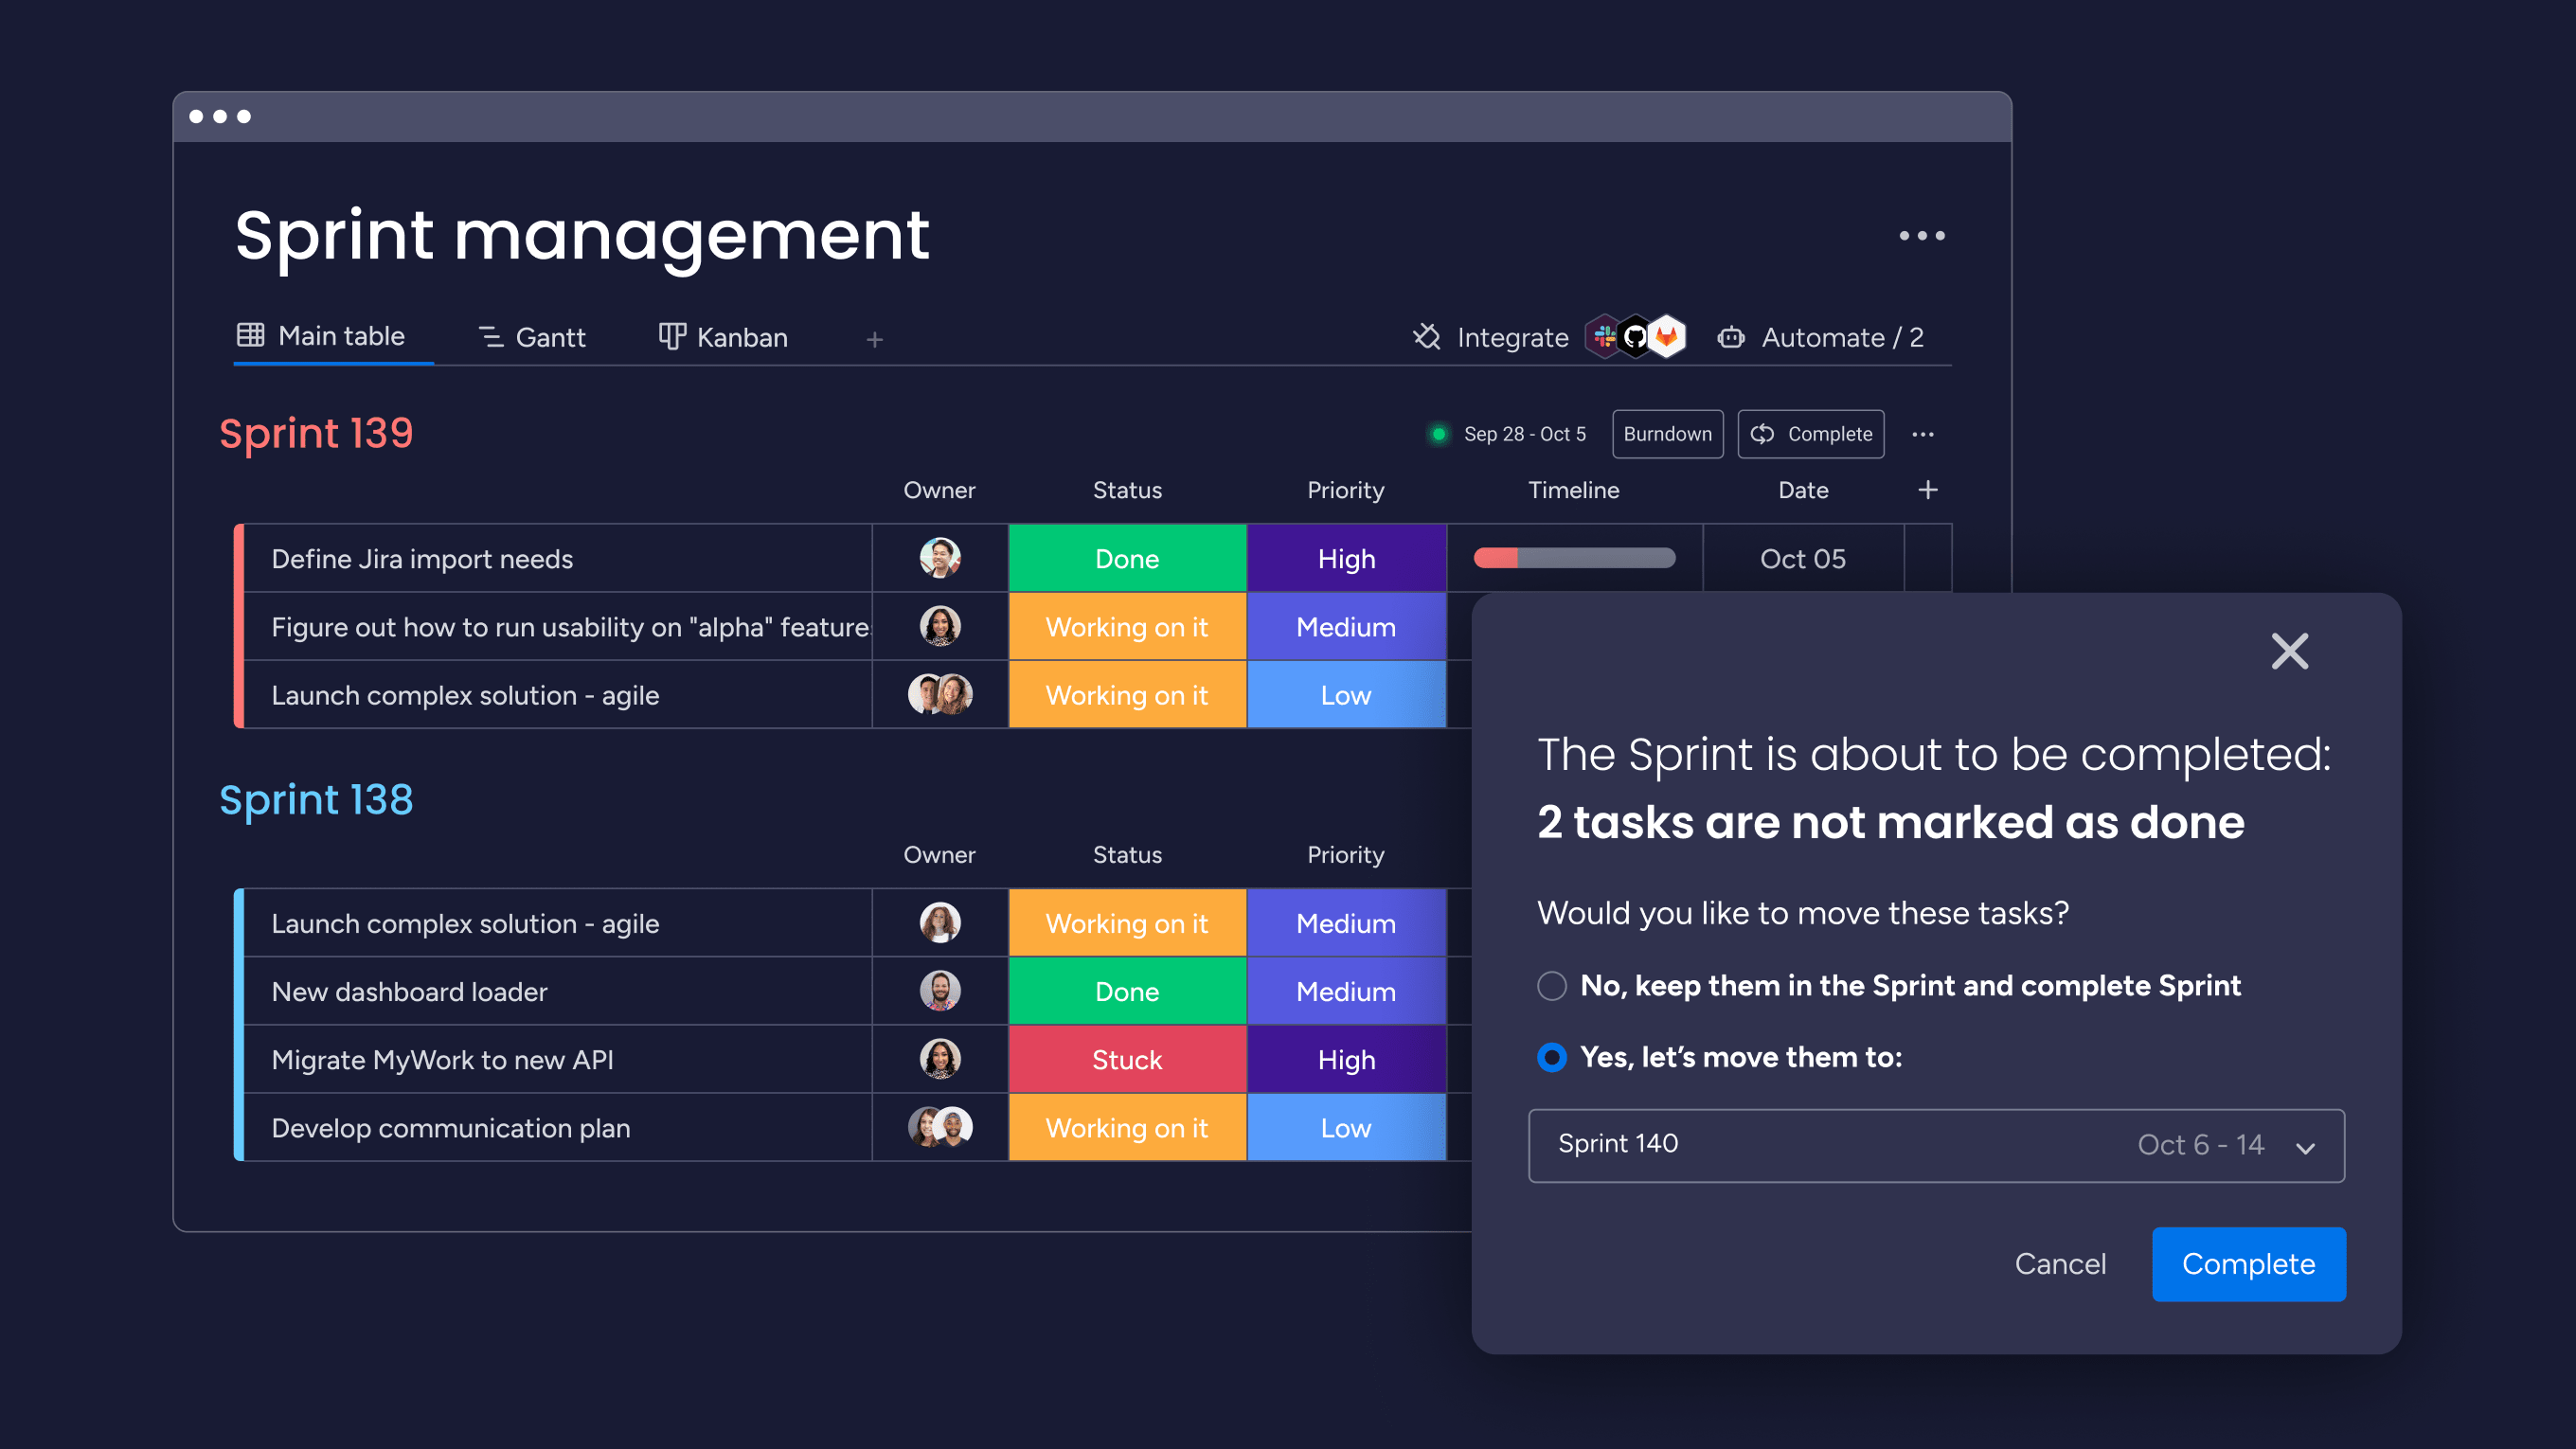
3. Sprint goal success rate
This measures how often your team achieves the sprint goal — not just individual stories, but the overall objective you committed to deliver. It’s about outcomes, not outputs.
Track this by recording whether you met each sprint’s goal. A pattern of missed goals might mean you’re overcommitting or facing unexpected obstacles.
4. Story completion ratio
This ratio compares stories completed versus stories started in a sprint. It reveals whether your team finishes what they start or leaves work partially done.
Calculate by dividing completed stories by total stories touched during the sprint. Low ratios often indicate too much work in progress or unclear acceptance criteria.
Flow metrics for Scrum teams
Flow metrics show how work moves through your development process. They help identify where work gets stuck and how predictable your delivery is.
5. Lead time
Lead time measures the total time from request to delivery — including all the waiting, planning, and development time. This metric matters because customers care about total delivery time, not just active work time.
Start measuring when a request enters your backlog. Stop when it reaches production. Shorter lead times mean happier customers and faster feedback loops.
6. Cycle time
Cycle time focuses only on active development — from when work starts until it’s done. This helps you understand your actual development efficiency without the noise of waiting periods.
Track cycle time for different types of work:
- Bug fixes: usually shorter cycles.
- New features: longer cycles with more complexity.
- Technical debt: varies based on scope.
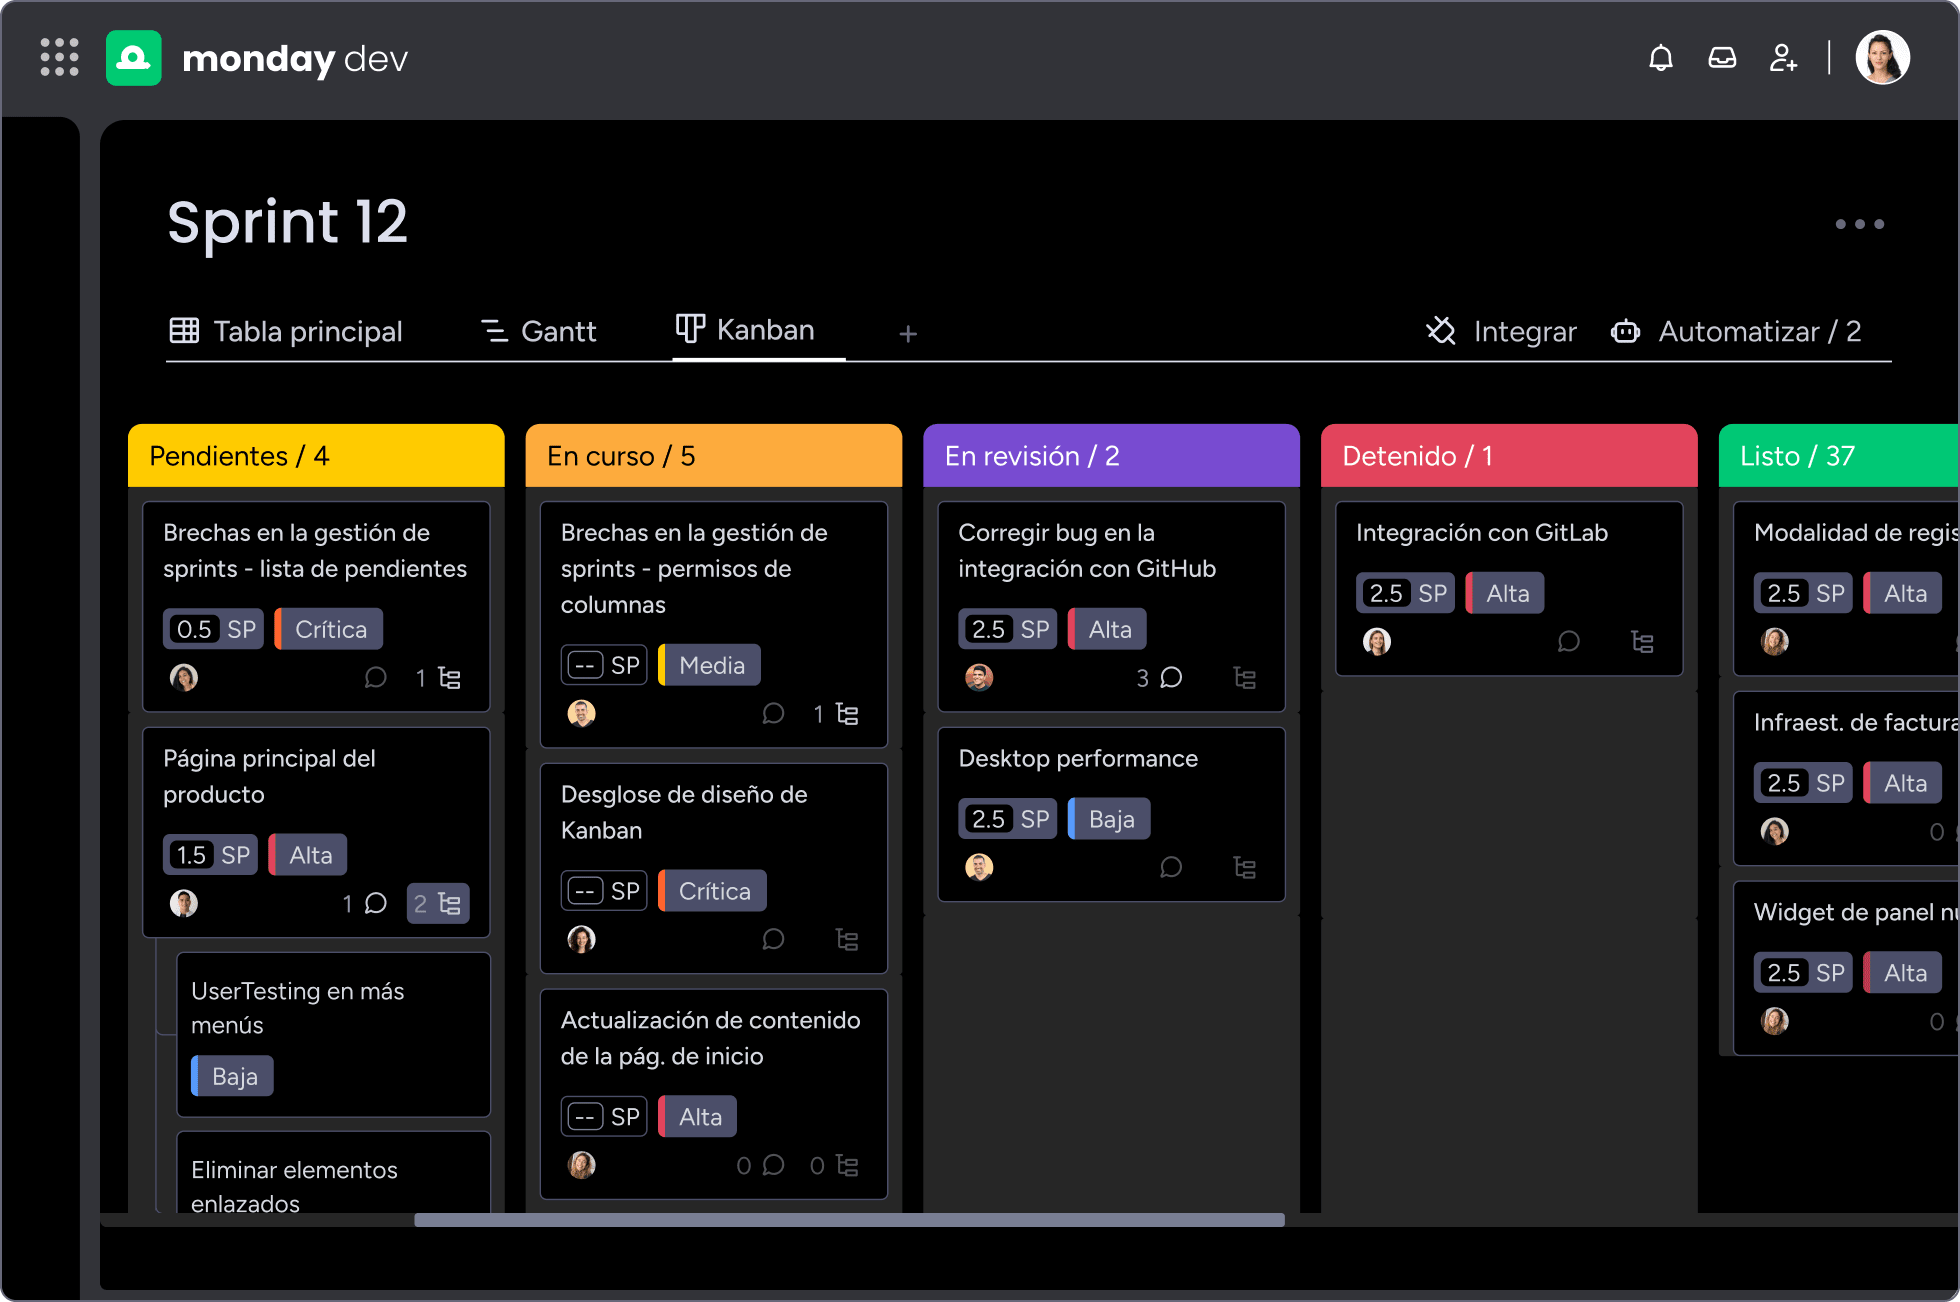
7. Work In Progress (WIP)
Work In Progress (WIP) counts how many items your team actively works on at any moment. Too much WIP slows everything down through context switching and divided attention. In fact, data from Parabol shows that teams aggressively controlling WIP can cut their time in process in half and reduce defects, though it can also impact productivity.
Set WIP limits for each workflow stage. When you hit the limit, finish something before starting new work. Platforms like monday dev helps visualize WIP across your Scrum board, making limits easy to enforce.
Agile quality metrics
Quality metrics ensure you’re not just delivering fast, but delivering well. They balance speed with sustainability and customer satisfaction.
8. Escaped defects
Escaped defects are bugs that reach customers instead of being caught during development. Every escaped defect damages trust and creates unplanned work.
Track these by counting customer-reported bugs and dividing by total features released. Look for patterns — do certain types of features have more escapes?
9. Defect removal efficiency
This measures how many bugs you catch before release versus after. High efficiency means your testing and review processes work well.
Calculate as: (bugs found before release / total bugs found) × 100. Aim for continuous improvement rather than perfection.
10. Technical debt ratio
Technical debt is the clean-up work you postpone to deliver faster. Some debt is strategic, but too much slows future development velocity.
Measure by tracking time spent on debt reduction versus new features. A healthy ratio depends on your product maturity and market pressure.
Agile team performance metrics
These metrics focus on the human side of development, which is a critical driver of success. According to the World of Work report by monday, employees who understand how success is measured are a lot more likely to feel motivated.
Tracking team and customer satisfaction ensures you’re building a sustainable, high-performing culture so this should never be overlooked.
11. Team satisfaction score
It may seem obvious but happy teams deliver higher-quality results. Satisfaction scores help you catch problems before they become crises.
Measure through regular surveys or retrospective feedback. Focus on trends:
- Declining scores: address issues quickly.
- Improving scores: understand what’s working.
- Stable high scores: maintain current practices.
12. Customer satisfaction (CSAT/NPS)
Customer satisfaction connects your development work to real business outcomes. These scores show whether you’re building the right things.
Collect feedback after releases or at regular intervals. Link satisfaction changes to specific features or improvements to guide future priorities.
Why your team needs Scrum metrics
Without metrics, you’re flying blind. You might feel busy but not know if you’re effective. Scrum metrics shine a light on what’s really happening in your development process.
Improve sprint planning accuracy
Historical data takes the guesswork out of sprint planning. When you know your velocity range and typical cycle times, you can make realistic commitments. This builds trust with stakeholders and reduces team stress.
With platforms like monday dev you can automatically tracks these patterns, easily revealing capacity trends without manual calculations. Your planning meetings become data-driven discussions rather than optimistic guessing games, ensuring a well-managed sprint backlog.
Identify and remove bottlenecks
Metrics reveal where work gets stuck. Maybe code reviews take too long. Perhaps testing becomes a bottleneck at sprint end. Without measurement, these problems hide in plain sight.
Once you spot bottlenecks, you can address them systematically. Add reviewers, parallelize testing, or revisit your Scrum artifacts. The metrics tell you if your fixes work.
Demonstrate value to stakeholders
Leaders want to see results, not just activity. Metrics translate technical work into business language — delivery speed, quality trends, and customer impact.
Regular metric reviews build confidence in your team’s ability to deliver. They also protect against unrealistic demands by showing what’s actually possible based on data.
How to use Scrum metrics in sprint events
Scrum ceremonies are designed to keep teams aligned, but they become far more powerful when backed by the right data. Scrum metrics give each event a clear purpose, helping teams plan with confidence, track progress in real time, demonstrate value to stakeholders, and reflect with evidence rather than assumptions.
The sections below show how specific metrics fit into sprint planning, daily stand-ups, sprint reviews, and retrospectives so every event drives meaningful outcomes instead of feeling like a routine meeting.
Metrics for sprint planning
Use velocity and capacity data to set realistic sprint goals. Look at your rolling three-sprint average, not just the last sprint. Consider team availability and any unusual factors.
Review cycle time for similar work items to improve estimation. If user stories typically take three to five days, don’t plan for a one day completion.
Tracking progress in daily stand-ups
Keep burndown charts visible during stand-ups. Quick glances show whether you’re on track without lengthy discussions. Focus conversation on deviations from expected progress.
WIP limits guide daily decisions. When you’re at capacity in testing, the team naturally swarms to clear the bottleneck.
Showcasing value during sprint reviews
Present completed work alongside relevant metrics. Show velocity trends, quality measures, and customer feedback. This context helps stakeholders understand not just what you built, but how well you built it.
monday dev’s dashboards can help make this presentation seamless. With real-time data, you can generate up-to-the-minute reports instantly, keeping you prepared for any review.
Driving improvement in sprint retrospectives
Metrics fuel meaningful retrospective discussions. Instead of general feelings, you discuss specific trends. Why did cycle time increase? What caused the spike in escaped defects?
Track action items from retrospectives and measure their impact. This creates a culture of continuous improvement based on evidence.
Scrum metrics vs traditional project management KPIs
Traditional project management relies on KPIs that assume predictability and tight control, measuring how closely work sticks to a plan created months in advance. Scrum metrics take a different approach. They embrace change and track how well a team delivers value consistently, aligning with the principles of the Scrum Guide.
The table below highlights how these two approaches differ, showing how Scrum metrics shift the focus from rigid outputs to meaningful outcomes.
| Traditional KPI | Scrum metric | Key difference |
|---|---|---|
| Resource utilization | Team velocity | Focus on output vs keeping people busy |
| Schedule adherence | Sprint goal success | Outcomes matter more than following plans |
| Individual performance | Team satisfaction | Collective success over individual metrics |
| Budget variance | Customer satisfaction | Value delivery over cost tracking |
Avoid these 5 common pitfalls when implementing Agile metrics
Agile metrics can drive real improvement, but only if they’re used thoughtfully. Missteps are easy to make, and the wrong approach can hurt collaboration instead of helping it. Knowing the most common pitfalls upfront gives Scrum masters and teams a better chance of avoiding them.
1. Focusing on individual performance over team success
Individual metrics destroy collaboration. When developers worry about their personal velocity, they stop helping teammates. The whole team suffers.
Keep all metrics at the team level. Celebrate collective achievements and address problems as a group.
2. Tracking too many metrics at once
Information overload paralyzes teams. When you track dozens of metrics, none get proper attention. Important signals get lost in the noise.
Start with three to four core metrics. Add others only when you have specific questions to answer. Quality beats quantity every time.
3. Using metrics as targets instead of indicators
When metrics become targets, they lose their value. Teams game the system to hit numbers rather than improve outcomes. Velocity inflation and quality shortcuts follow.
Treat metrics as health indicators. Use them to spot trends and guide improvements, not to judge performance.
4. Ignoring team input on metric selection
Metrics that are imposed from above often feel like surveillance, especially when there’s a gap between leadership and employees.
- Perception gap: monday’s World of Work report found that while 45% of senior leaders believe change is managed “very well,” only 23% of individual contributors agree.
- Lack of buy-in: when teams don’t see value in the metrics they’re asked to track, the data becomes unreliable.
The fix is simple: let teams choose metrics based on their current challenges. They know best which insights will actually improve performance.
5. Failing to act on metric insights
Collecting data without action breeds cynicism. Teams lose faith when problems identified through metrics never get addressed. The measurement process becomes meaningless overhead.
Create clear processes for reviewing metrics and taking action. Document improvements and their results to show the value of measurement.
How monday dev transforms Scrum metrics tracking
Scrum metrics only make an impact when they’re easy to capture and share. Manual spreadsheets and scattered tools slow teams down, while automated insights keep everyone aligned. That’s where monday dev adds real value. Built on the monday Work OS, it adapts to the way your team works and keeps metrics flowing without adding extra overhead.
The features below show how monday dev simplifies tracking, automates data collection, and creates dashboards that make metrics useful for every audience: from developers to executives.
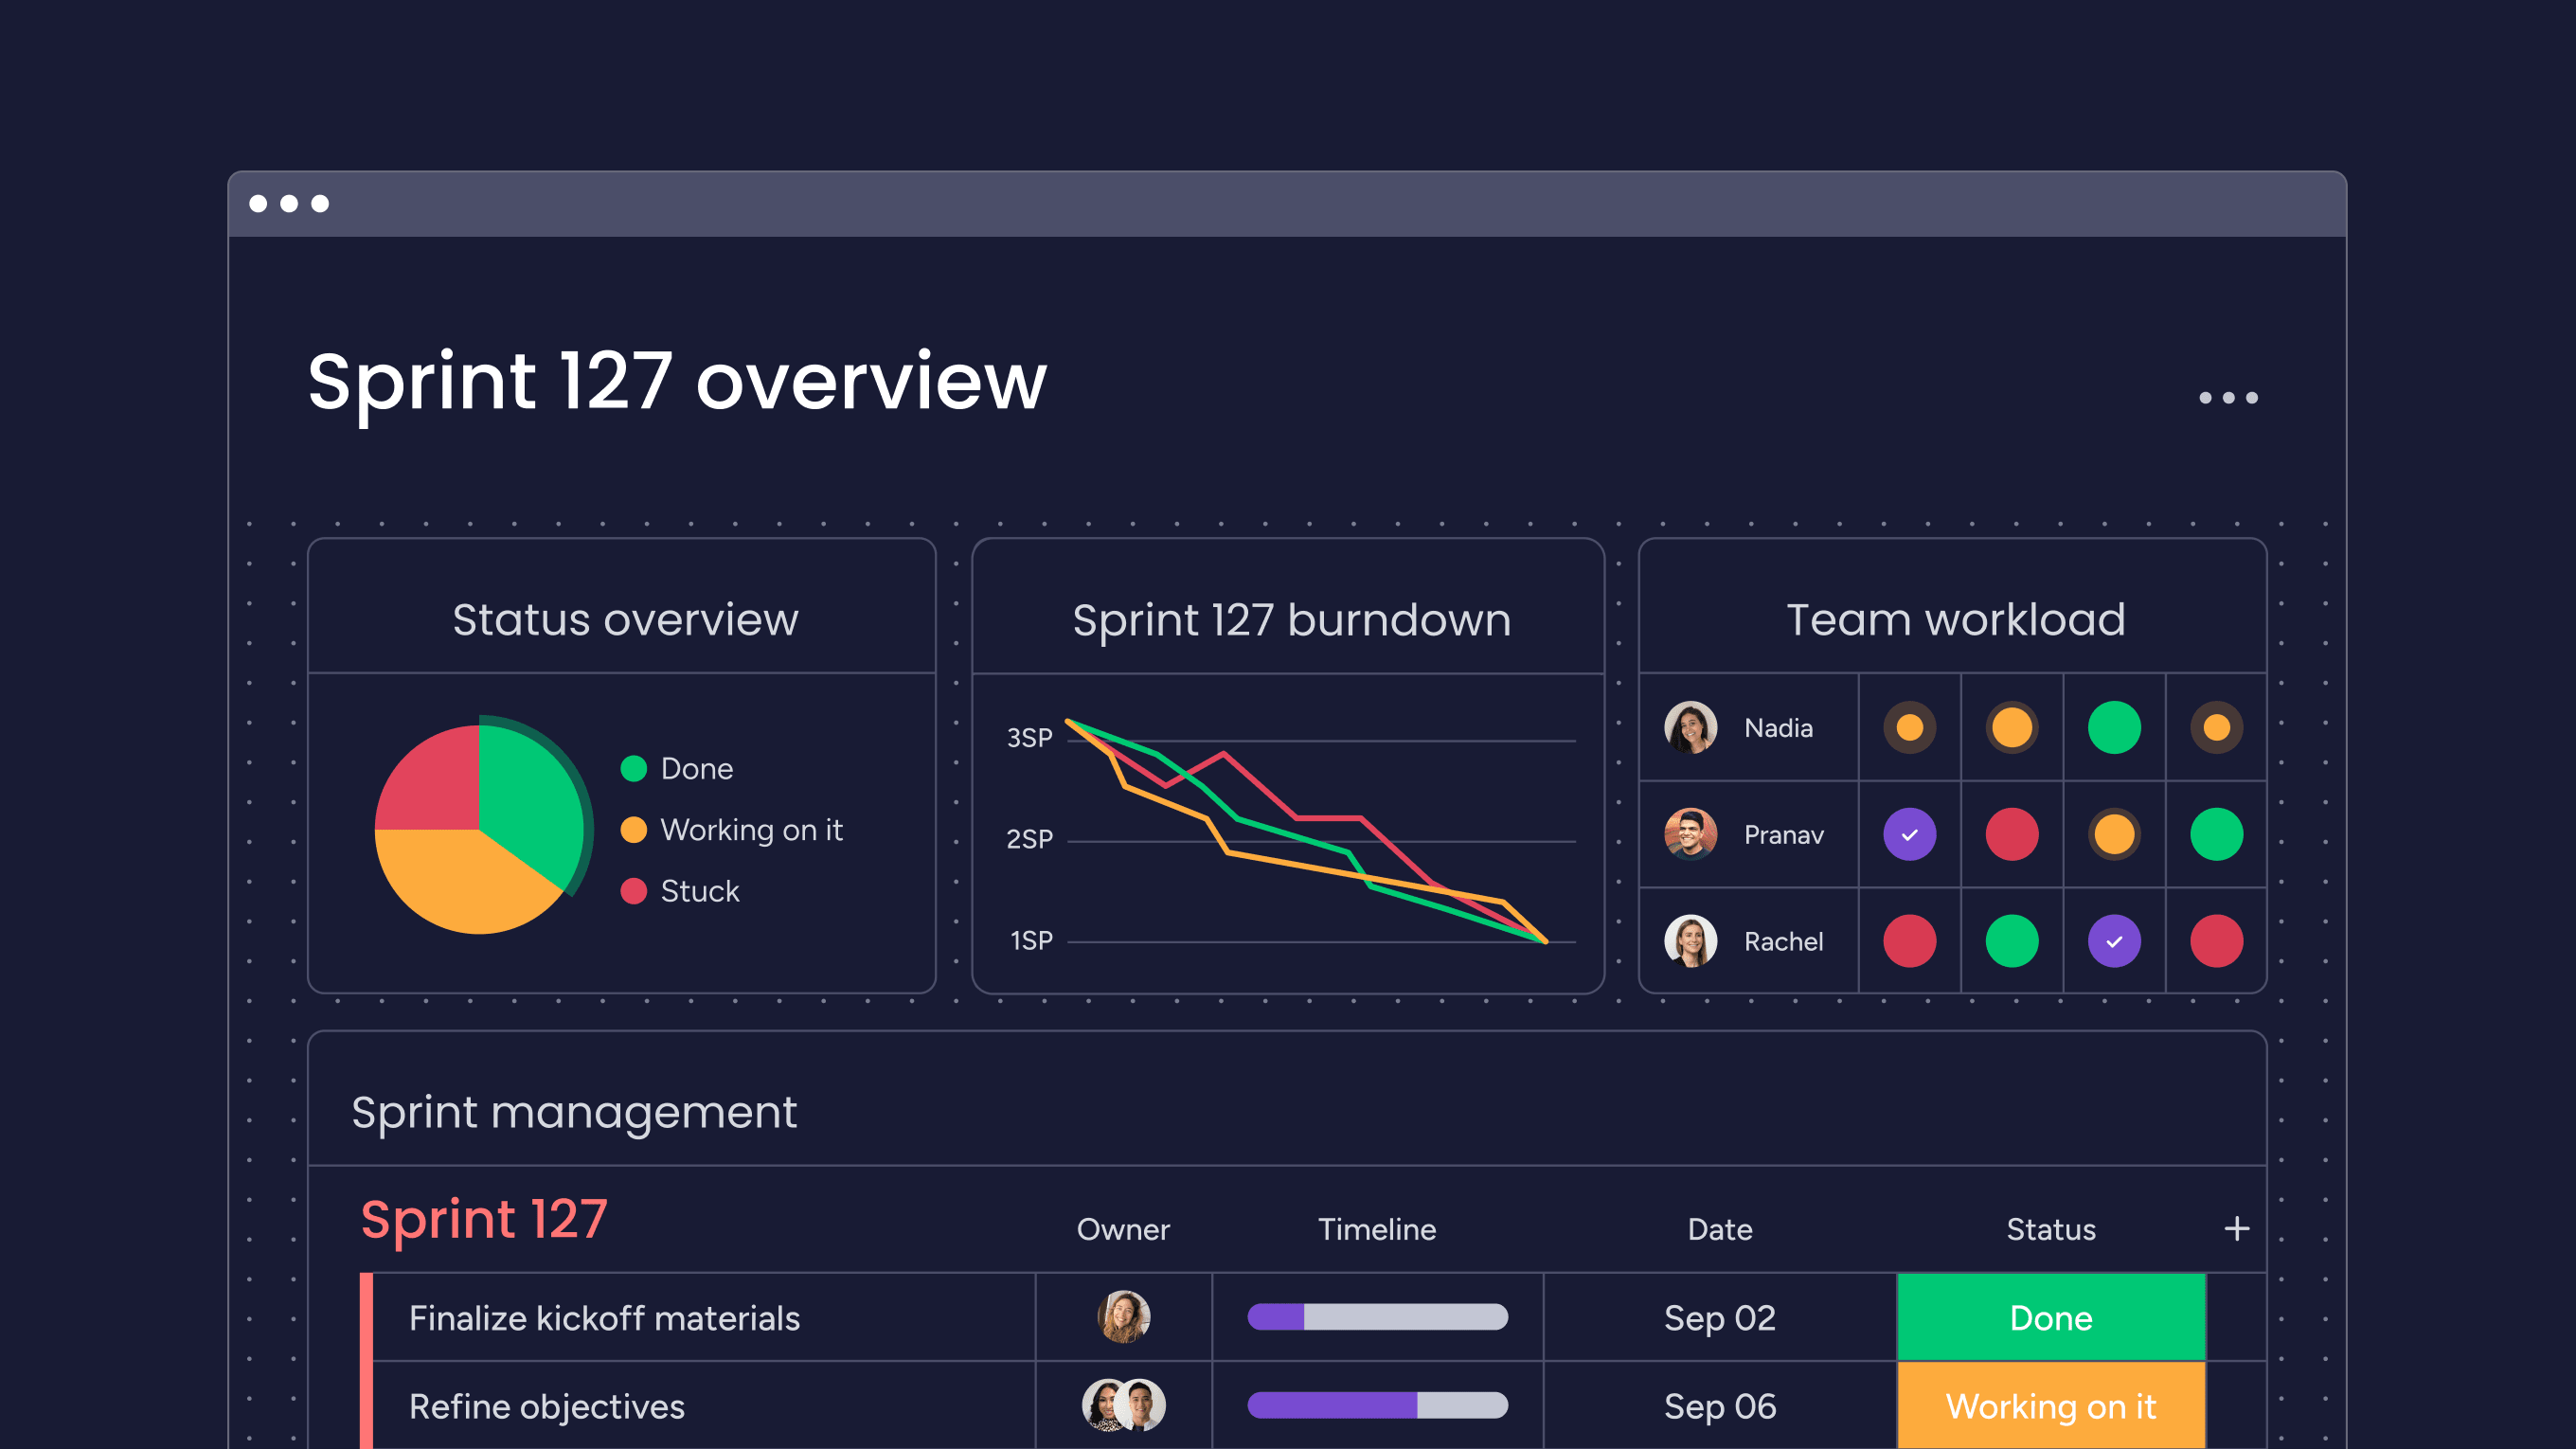
Real-time dashboards for instant visibility
With monday dev, metrics update automatically as work progresses, removing the need for spreadsheets and manual calculations. Dashboards make it simple to see exactly what matters, when it matters.
- Always current: monday dev refreshes data in real time so teams always have an accurate view of progress.
- Custom views: the Widget Center lets developers track burndown charts and WIP limits, managers follow velocity trends, and executives review high-level health indicators.
- One source of truth: every monday dev dashboard pulls from the same data, keeping all stakeholders aligned.
Automated data collection across your tech stack
monday dev integrates directly with the tools your team already uses, ensuring metrics are accurate and always up to date without manual effort.
- Development tracking: connect GitHub, Jira, or GitLab to automatically pull in commits, pull requests, and deployment data.
- Customer insights: link Zendesk or Intercom to bring satisfaction scores into your monday dev dashboards.
- Extensive integrations: choose from more than 200 native options to unify data across your stack.
- Real-time syncs: the Integration Centre in monday dev keeps everything connected so metrics stay current without extra work.
Custom workflows that adapt to your methodology
Whether you follow textbook Scrum or have evolved your own approach, monday dev flexes to match. Create custom fields with our Column Center for your specific metrics like “Sprint Goal Success Rate” or “Escaped Defects.” Build automations using our visual Automation Builder that calculate complex measures like cycle time averages or WIP violations.
Design boards with our drag-and-drop Board Builder that reflect your actual process—from Kanban flows to SAFe hierarchies to hybrid methodologies. The platform’s Formula Column feature even lets you create custom calculations that automatically update as work progresses, allowing the platform to grow with your measurement maturity while maintaining a single source of truth.
Start tracking smarter with the right agile metrics platform
The best Scrum metrics strike a balance: clear enough to guide decisions without overwhelming teams with unnecessary data. Start with a few core measures, learn from them, and connect every metric to meaningful improvements.
With monday dev, tracking becomes effortless. Automated data collection, flexible dashboards, and real-time insights give teams the clarity they need to improve performance while staying focused on delivery.
Ready to make metrics meaningful? Try monday dev today and see how automated tracking, real-time dashboards, and flexible workflows can transform the way your team runs Scrum.
Frequently asked questions
What are the 5 C's of Scrum?
The 5 C's of Scrum refer to the five values that guide Scrum teams: commitment, courage, focus, openness, and respect. These values shape how teams collaborate and make decisions together.
What is the 3-5-3 rule in Scrum?
The 3-5-3 rule describes Scrum’s structure: 3 roles (product owner, Scrum master, development team), 5 events (sprint, sprint planning, daily scrum, sprint review, sprint retrospective), and 3 artifacts (product backlog, sprint backlog, increment).
What is a KPI in Scrum?
A KPI in Scrum is a key performance indicator that measures how effectively your team achieves important objectives. Examples include velocity, sprint goal success rate, or customer satisfaction scores.
What are the 4 metrics of Kanban?
The 4 key Kanban metrics are lead time (request to delivery), cycle time (start to finish), work in progress (WIP), and throughput (items completed per time period).
How often should Scrum metrics be reviewed?
Scrum metrics should be reviewed at different frequencies: daily for burndown charts during stand-ups, per sprint for velocity and quality metrics, and monthly for longer-term trends and strategic adjustments.
Can Scrum metrics predict project success?
Scrum metrics indicate project health and performance trends but cannot guarantee success. They help you make informed decisions and spot problems early, but success depends on many factors beyond what metrics can measure.