

Big projects are never as simple as checking off a to-do list. Every task connects with another, and if one slips, it can throw off your whole schedule. Without a clear picture of how everything fits together, it’s easy for teams to get blindsided by bottlenecks or deadlines that sneak up out of nowhere.
A project network diagram provides this essential visibility by mapping out task relationships and identifying the critical path. This guide explains what network diagrams are, how they differ from Gantt charts, and the key components that make them effective. We will also walk through the steps to create one for your own projects.
Understanding how to build and use these diagrams will give your team the foresight to manage risks, optimize resources, and deliver their work with confidence.
Try monday work managementKey takeaways
- Network diagrams are visual maps that show how project activities connect and depend on each other, helping you identify the critical path that determines your project’s minimum duration.
- Unlike Gantt charts that focus on timelines and progress tracking, network diagrams excel at revealing task dependencies and logical work flow during the planning phase.
- The three main types of network diagrams are Activity on Arrow (AOA), Activity on Node (AON), and PERT, with AON being the most popular for modern project management due to its flexibility and software compatibility.
- Creating effective network diagrams requires 5 key steps: listing all project activities, mapping dependencies, drawing the visual diagram, calculating the critical path, and adding duration estimates and resource assignments.
- monday work management automatically generates network diagrams from your existing project data and updates them in real-time, eliminating manual drawing and maintenance while enabling seamless team collaboration.
What is a network diagram in project management
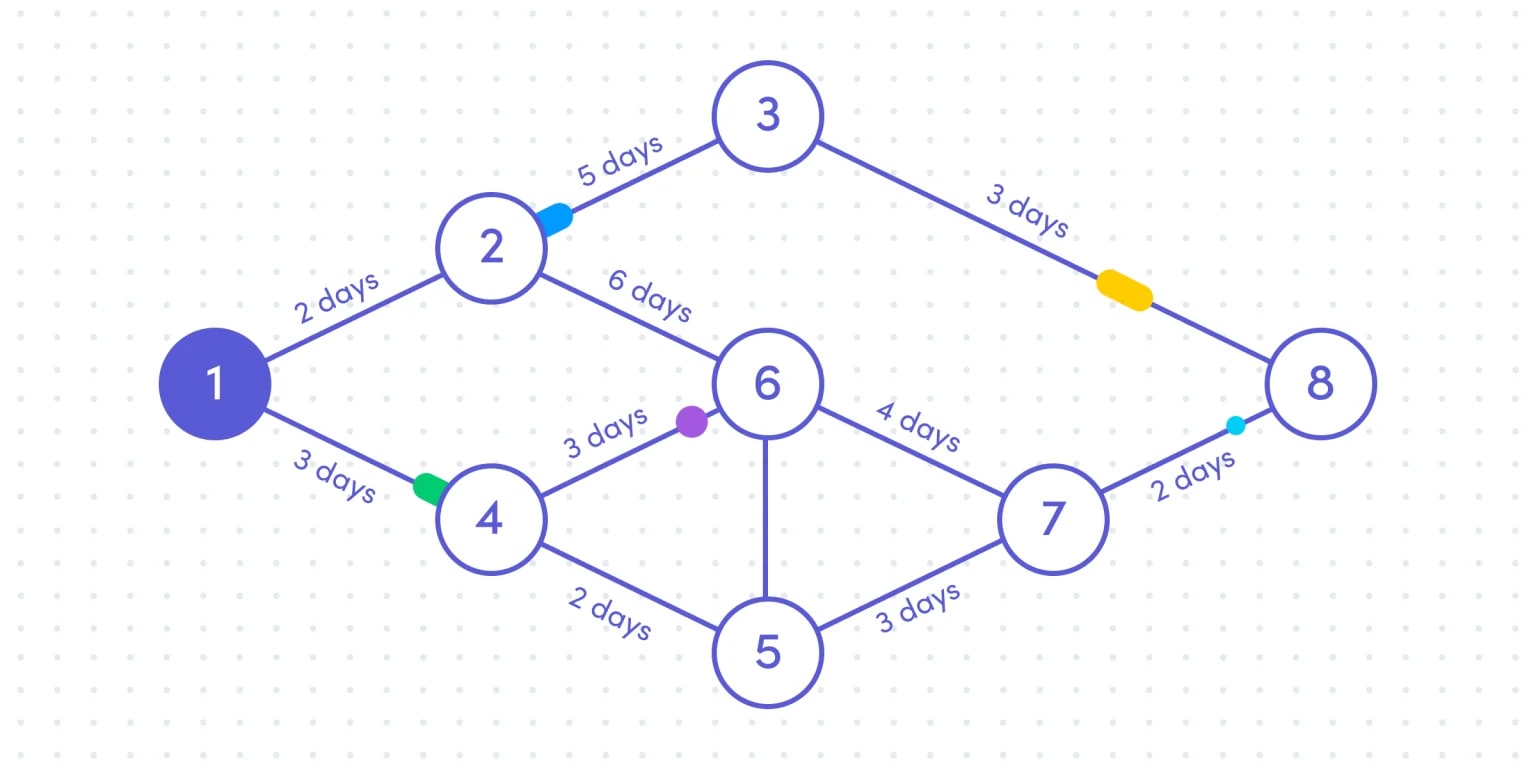
A network diagram is a visual map that shows how project activities connect and depend on each other. Think of it as a flowchart that reveals which work must happen before other work can begin.
These diagrams display activities as boxes connected by arrows that show dependencies. This visual approach helps you spot the critical path — the longest chain of dependent activities that determines your project’s minimum duration.
Network diagrams excel at showing task relationships during planning. While Gantt charts track progress on a timeline, network diagrams reveal the logical flow of work. Modern platforms like monday work management generate these diagrams automatically from your project data.
Project network diagrams vs Gantt charts
Network diagrams and Gantt charts serve different purposes in project management. Understanding when to use each helps you choose the right visualization for your needs.
Network diagrams focus on dependencies — they show which activities must finish before others can start. Gantt charts emphasize scheduling — they display when activities happen on a timeline.
Here’s how they compare:
| Aspect | Network diagram | Gantt chart |
|---|---|---|
| Primary focus | Task dependencies | Timeline and progress |
| Best for | Planning phase | Execution monitoring |
| Visual style | Connected flowchart | Timeline bars |
| Complexity handling | Excellent for dependencies | Simpler for schedules |
Most project managers use network diagrams to map dependencies during planning. Then they switch to Gantt charts to track progress during execution.
Key benefits of using network diagrams
Network diagrams transform complex project plans into visual maps that everyone can understand. These benefits become especially valuable when multiple teams coordinate on tight deadlines.
The main advantages include:
- Risk identification: Spot bottlenecks before they delay your project.
- Resource optimization: See exactly when you need specific team members and allocate them effectively.
- Stakeholder communication: Show project complexity visually to align executives and partners.
- Change management: Understand how delays ripple through your schedule to make informed adjustments.
monday work management creates network diagrams from your existing project data. No manual drawing required — the platform updates dependencies automatically as your project evolves.
3 types of network diagrams
Project managers use three main network diagram methods to visualize workflows. Each method suits different project types and industries.
1. Activity on arrow method
The Activity on Arrow (AOA) method uses arrow diagrams to represent activities and circles for milestones. This traditional approach still appears in construction and manufacturing projects.
In AOA diagrams, arrows show work activities with durations. Circles mark completion points or milestones. Sometimes you need dummy activities — dashed arrows that show dependencies without actual work.
AOA characteristics include:
- Arrow activities: Each arrow represents one project activity
- Circle milestones: Nodes mark important completion points
- Dummy dependencies: Dashed lines show logical connections
- Sequential focus: Works best for linear projects
While less common today, AOA remains useful for projects with clear sequences and milestone tracking needs.
2. Activity on node method
Activity on Node (AON), also known as the precedence diagram, has become the standard for modern project management. Activities appear in boxes, with arrows showing the flow between them.
This method handles complex projects effectively and integrates seamlessly with project management software. Its visual structure makes it easy for teams to understand the project’s flow.
AON elements include:
- Activity boxes: Rectangles contain activity names and details
- Flow arrows: Lines show dependencies between activities
- Flexible layout: Accommodates parallel work streams
- Software ready: Works with platforms like monday work management
AON’s popularity comes from its ability to represent modern project complexity while remaining easy to understand.
3. PERT network diagrams
Program Evaluation and Review Technique (PERT) adds uncertainty management to network diagrams; it was originally created in the 1950s to help manage the creation of weapons and defense projects for the US Navy. Instead of single time estimates, PERT uses three: optimistic, pessimistic, and most likely.
PERT features include:
- Three-point estimates: Accounts for best, worst, and likely scenarios
- Probability calculations: Shows chances of meeting deadlines
- Critical path analysis: Identifies the longest activity sequence
- Uncertainty planning: Perfect for research and development projects
PERT works especially well when you can’t predict activity durations precisely.

Essential components of network diagrams
Every network diagram contains core elements that work together to show your project’s workflow. Understanding these components helps you create diagrams that guide successful execution.
Nodes and project activities
Nodes are the building blocks of your network diagram. Each node represents a specific piece of work or an important milestone.
Well-defined nodes make the difference between a useful diagram and a confusing chart. Each activity needs a specific description, a measurable output, and an assigned owner.
Effective node definition requires:
- Specific deliverables: Use action verbs like “Design homepage mockup”
- Right-sized work: Break activities into 1-10 day chunks
- Clear ownership: Assign each activity to someone
- Measurable completion: Define what “done” looks like
Vague activities like “Work on design” create confusion. Specific activities like “Create checkout page wireframes” drive action.
Activity dependencies and relationships
Dependencies show how activities connect to each other. Four types of dependencies capture different working relationships:
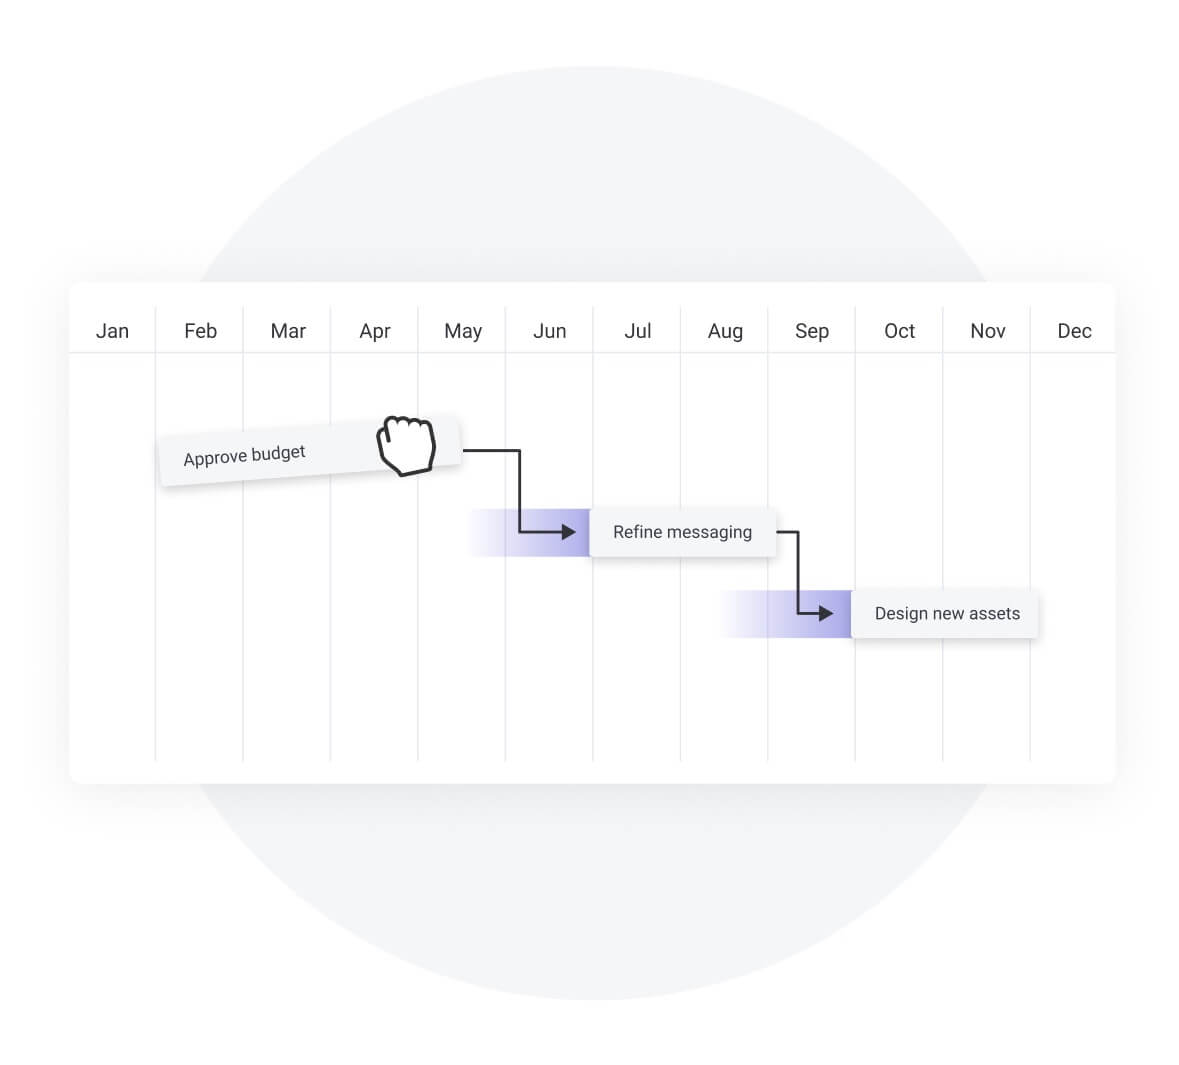
- Finish-to-start: Most common. Activity A must finish before Activity B starts
- Start-to-start: Activities begin together, like writing and design for a campaign
- Finish-to-finish: Activities end together, like testing and documentation
- Start-to-finish: Rare. one activity starting triggers another to finish
Understanding dependencies helps you model real project constraints. monday work management handles all dependency types automatically, updating your diagram as relationships change.
The critical path
The critical path is your project’s backbone — the longest sequence of dependent activities that determines project duration. Any delay on this path delays your entire project.
Activities on the critical path have zero float, meaning they have no flexibility and can’t be delayed without impacting the project timeline. Activities off the path have float time, meaning they can slip without affecting the project end date.
Critical path insights include:
- Minimum duration: The shortest possible project timeline
- Resource focus: Where to concentrate your best resources
- Risk areas: Which delays hurt most
- Optimization opportunities: Where parallel work might help
Platforms like monday work management calculate your critical path automatically and update it as conditions change.
How to make a network diagram in 5 steps
Creating a network diagram transforms your project scope into a visual workflow. Follow these steps to build diagrams that guide successful execution.
Try monday work managementStep 1: List all project activities
Start by breaking your project into specific activities. Each activity should produce something measurable and take a reasonable amount of time.
Think through your deliverables and work backward. What needs to happen to create each deliverable? Who will do the work?
For a website redesign, your list might include:
- Gather stakeholder requirements
- Create homepage wireframes
- Design mobile layouts
- Develop CSS framework
- Write page content
- Test user flows
- Deploy to production
Each activity is specific, assignable, and has a defined completion point.
Step 2: Map activity dependencies
Now identify which activities depend on others. Ask “What must finish before this can start?” for each activity.
Look for patterns like design-before-development or approval-before-launch. Consider both technical requirements and resource constraints.
Create a simple dependency table:
This preparation makes diagramming much smoother.
Step 3: Draw your network diagram
Transform your activities and dependencies into a visual diagram. Arrange activities from left to right in rough chronological order.
Show parallel work on separate horizontal tracks. Use arrows to connect dependent activities. Keep the layout clean and readable.
Diagram layout principles:
- Left-to-right flow: Match natural reading patterns
- Parallel tracks: Show simultaneous work clearly
- Clean arrows: Avoid crossing lines when possible
- White space: Leave room for readability
With monday work management, you don’t have to worry about arranging boxes or drawing arrows. The platform automatically organizes your activities and dependencies into a clear, professional network diagram.
As you define relationships and update project data, the visual layout adjusts in real time to reflect changes, ensuring your diagram always stays accurate, readable, and aligned with your project’s actual workflow.
Step 4: Calculate the critical path
Find the longest path through your network. This path determines your minimum project duration.
Calculate the earliest start and finish times for each activity (forward pass). Then calculate the latest times without delaying the project (backward pass).
Activities where early and late times match are on your critical path. These activities have zero scheduling flexibility.
If Design (3 days) → Develop (5 days) → Test (2 days) is your longest path at 10 days, that’s your critical path and minimum project duration.
Step 5: Add duration and resources
Complete your diagram by adding time estimates and resource assignments. This transforms your diagram into an execution guide.
Base duration estimates on team capacity and task complexity. Assign specific people to each activity. Mark important milestones.
Final touches include:
- Time estimates: Add realistic durations
- Owner names: Specify who does what
- Milestone markers: Highlight key completion points
- Update schedule: Plan regular diagram reviews
Your network diagram now guides daily execution and helps teams stay aligned.
“monday.com has been a life-changer. It gives us transparency, accountability, and a centralized place to manage projects across the globe".
Kendra Seier | Project Manager“monday.com is the link that holds our business together — connecting our support office and stores with the visibility to move fast, stay consistent, and understand the impact on revenue.”
Duncan McHugh | Chief Operations OfficerNetwork diagram examples by project type
Different projects require different approaches to network diagramming. These examples show how to adapt the method to your specific needs.
Software development projects
Software projects involve technical dependencies where components build on each other. Database schemas come before application code. APIs develop before front-end integration.
A software network diagram might include requirements gathering, architecture design, database development, API creation, front-end coding, integration testing, and deployment. Technical dependencies often create the critical path.
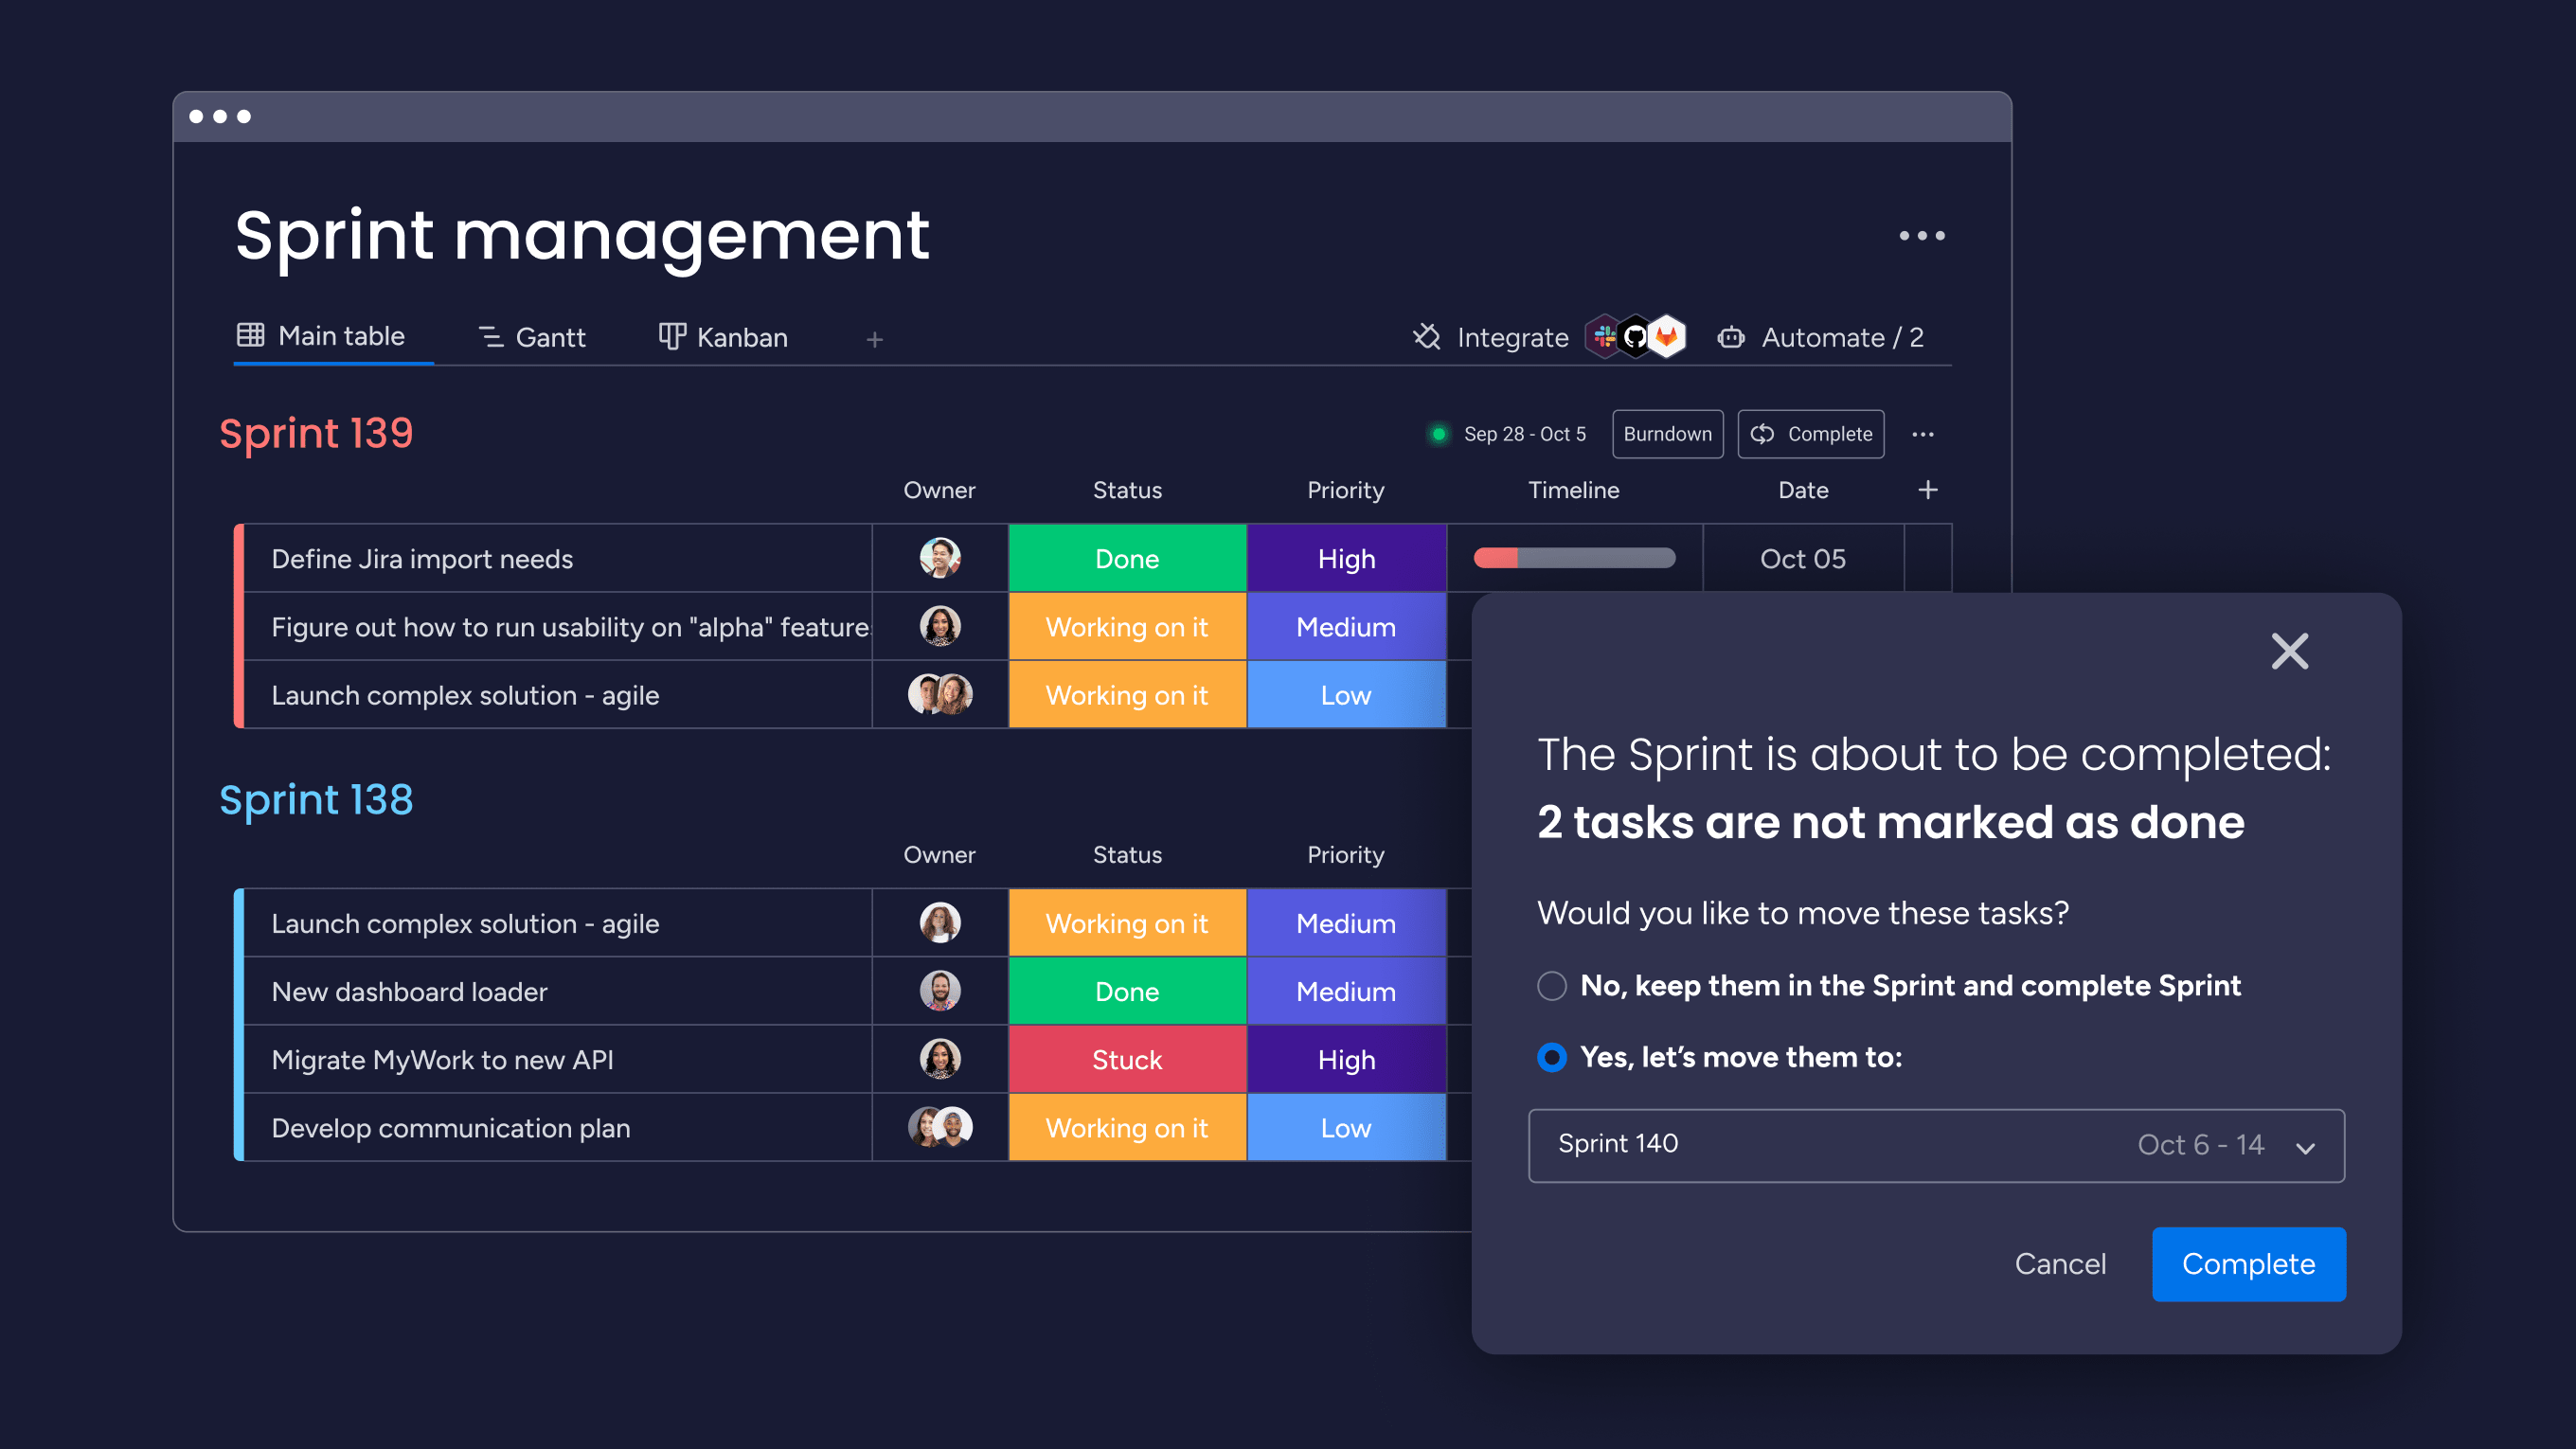
monday work management integrates seamlessly with development tools like GitHub, Jira, and Bitbucket, automatically syncing updates from code commits, issue tracking, and sprint boards directly into your project network diagram.
This ensures your diagrams always reflect the latest task statuses, dependencies, and blockers. Your team has real-time visibility into progress, potential delays, and shifting priorities without manual updates.
Marketing campaign projects
Marketing projects feature parallel creative work converging at launch. Content, design, and channel prep often happen simultaneously.
External dependencies matter more here — vendor deliveries, approval cycles, and media deadlines create constraints. Your diagram coordinates these moving pieces.
Key phases include strategy development, creative briefing, content production, design creation, channel setup, approvals, and launch coordination. Multiple paths converge at launch.
Business operations projects
Operations projects focus on process changes across departments. Current state analysis, future design, implementation, training, and change management all need coordination.
Network diagrams visualize how process design, technology work, and training development must align for successful rollout. Multiple workstreams converge at pilot launches and full implementation.
Best practices for network diagramming
Creating useful network diagrams requires balancing detail with clarity. Follow these practices to build diagrams that actually improve project execution.
Keep your diagrams focused and simple
A well-organized visual determines whether your diagram helps or confuses. Complex diagrams often get ignored by the people who need them most, and since adoption can be a challenge in large enterprises, simplicity is key to ensuring these tools provide value.
Clarity principles include:
- Consistent shapes: Use the same visual elements throughout
- Readable text: Keep activity names short but descriptive
- Logical flow: Minimize crossing lines
- Right detail level: Include what matters, skip what doesn’t
Design for stakeholders with varying project management experience. Clarity beats completeness.
Update network diagrams regularly
Network diagrams must evolve with your project. Static diagrams quickly become expensive wallpaper.
Update your diagram when:
- Scope changes: New activities appear or disappear
- Timelines shift: Duration estimates change
- Resources change: Team availability shifts
- Dependencies emerge: New relationships surface
Standardize your diagram symbols
Consistent symbols across projects improve understanding. Create standards for how you represent different elements.
Symbol standards might include:
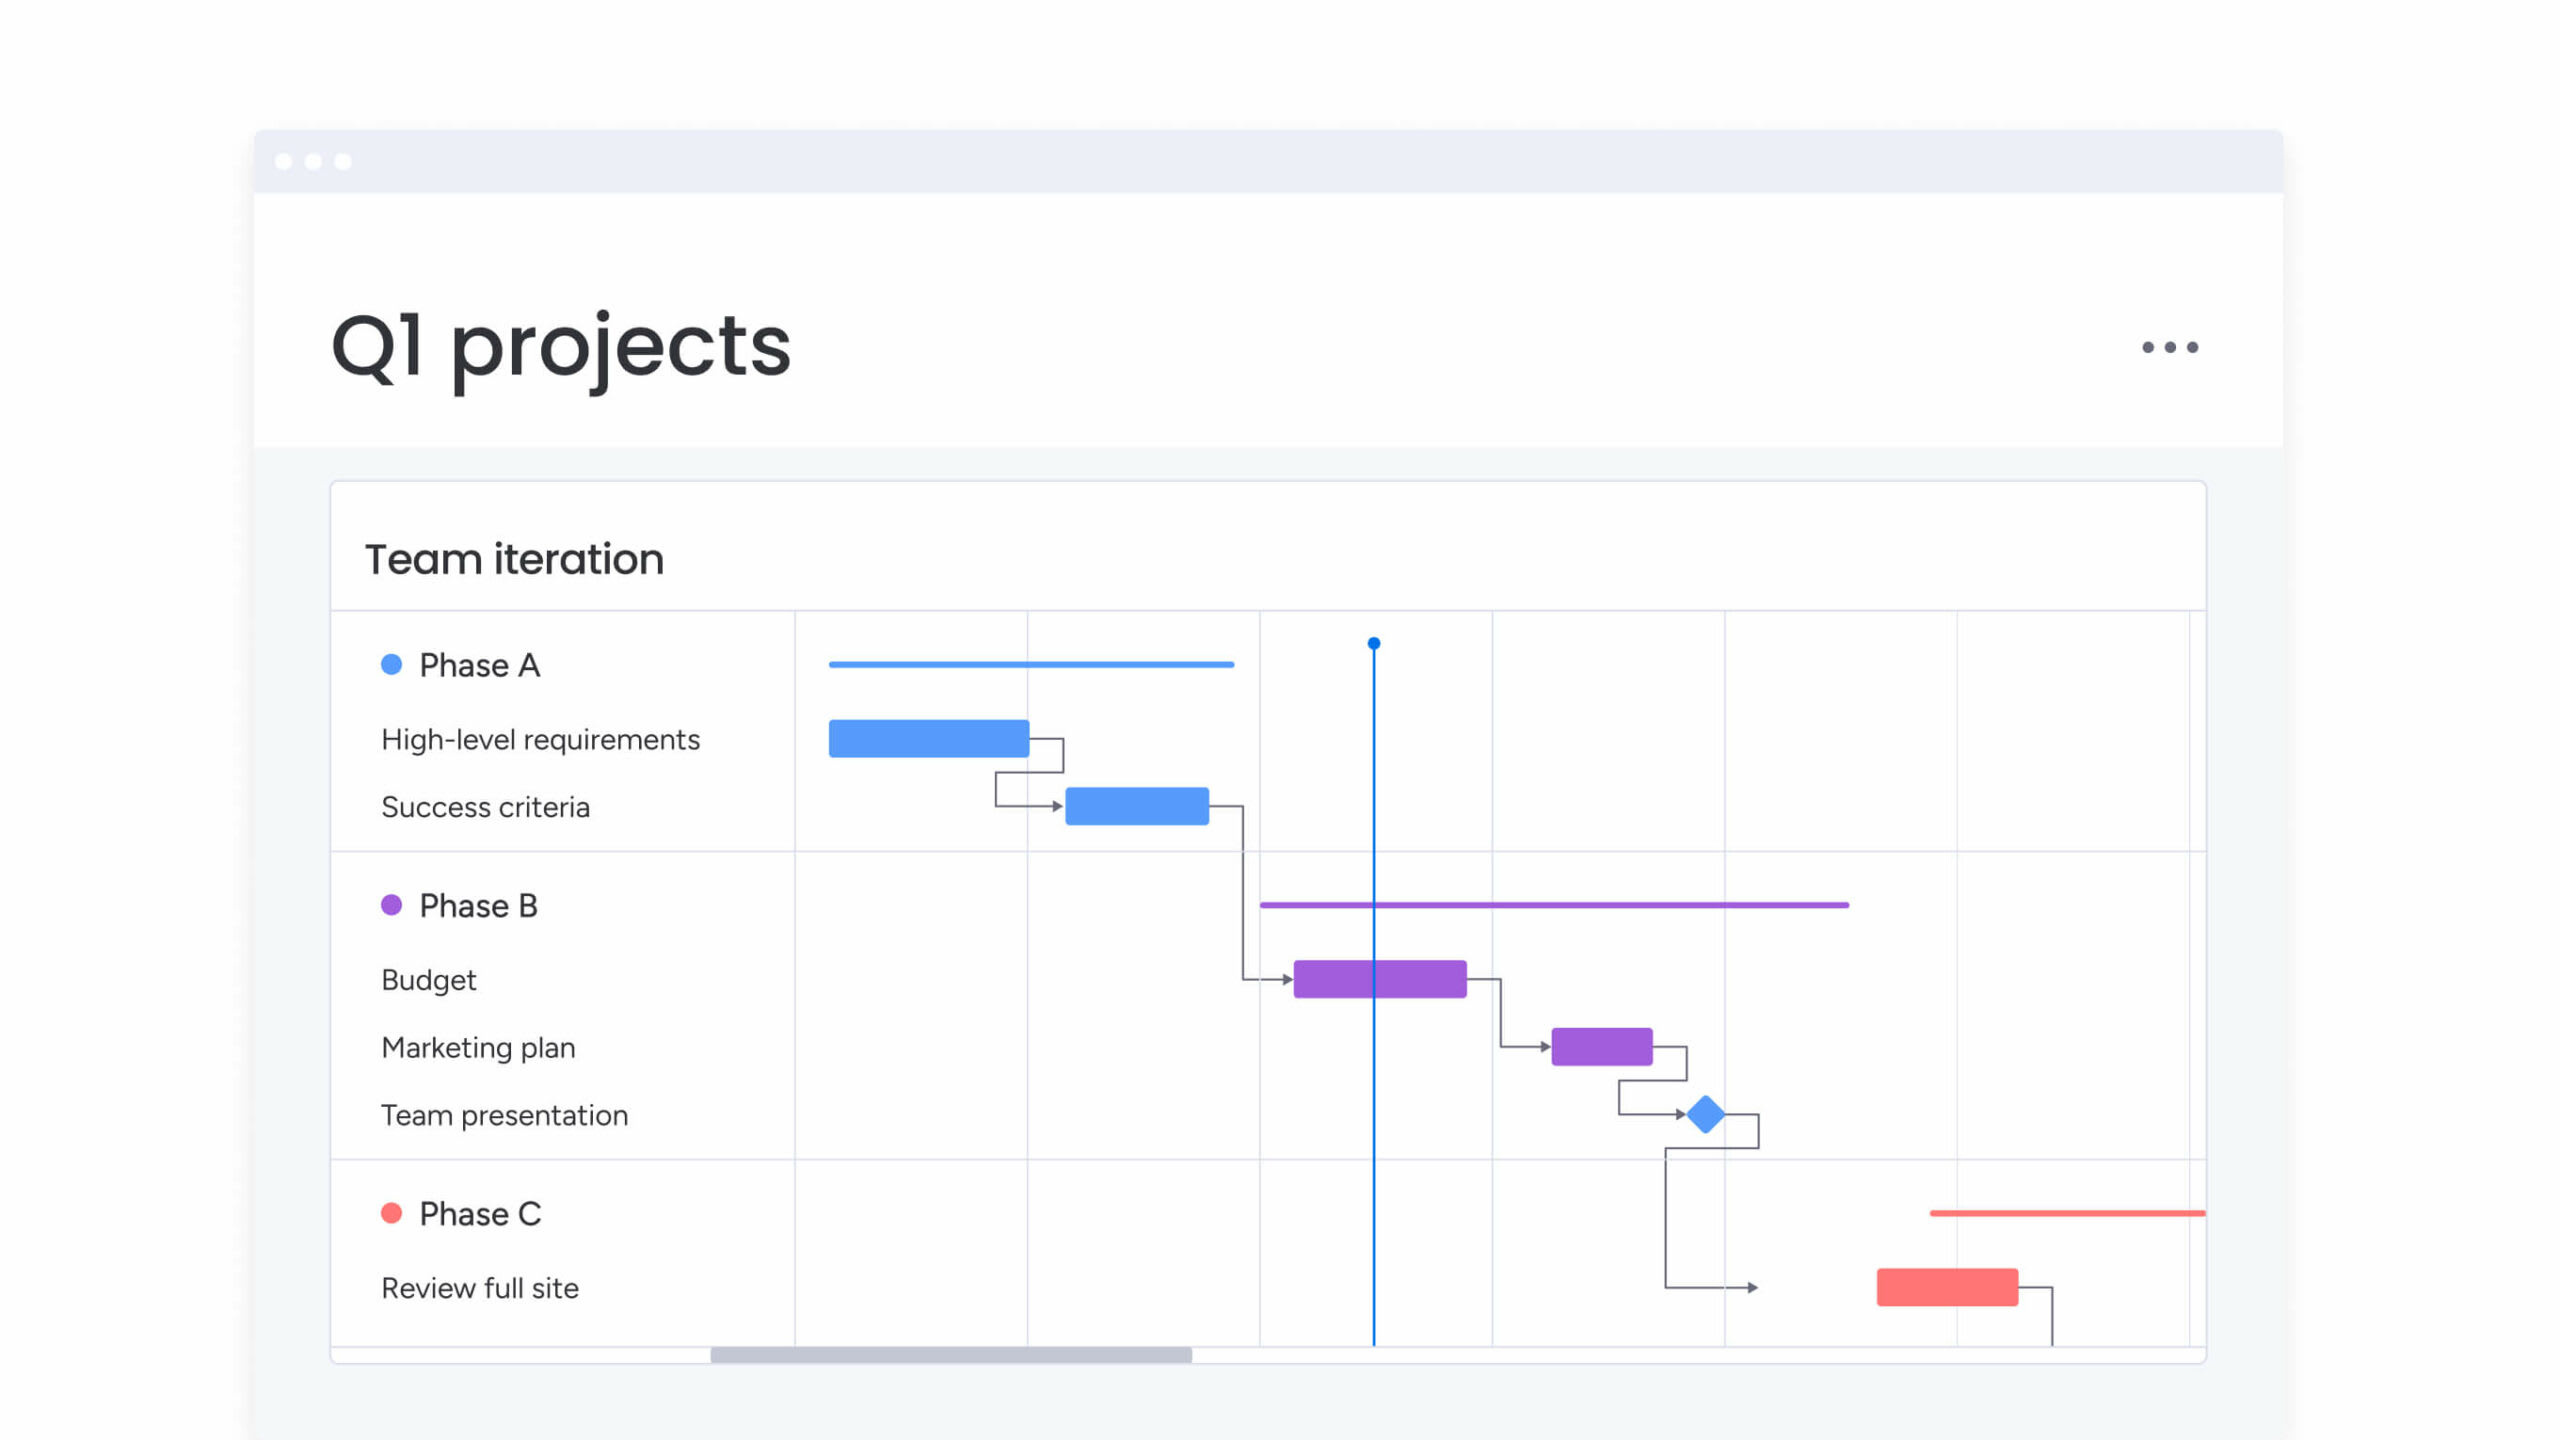
- Activity rectangles: Standard boxes for work activities
- Milestone diamonds: Diamonds for key completion points
- Dependency arrows: Solid lines for dependencies
- Critical path highlighting: Bold or colored lines
Standardization helps stakeholders quickly understand any diagram they encounter.
Enable team collaboration
Network diagrams work best when teams help create and maintain them. Collaborative development improves accuracy and buy-in.
Involve teams through:
- Input sessions: Gather dependency knowledge from those doing the work
- Review meetings: Update diagrams during regular project meetings
- Shared access: Ensure everyone can view current diagrams
- Easy feedback: Create simple ways to suggest updates
Platforms like monday work management make collaboration natural by connecting diagrams to live project data.
Try monday work managementBuild network diagrams that drive project success
Network diagrams transform project complexity into an intuitive visual map. They reveal dependencies, highlight critical paths, and help teams deliver on time.
Success comes from creating diagrams teams actually use. Focus on simplicity, maintain currency, and involve your team throughout the process.
monday work management eliminates manual diagramming work by generating network views from your project data. It then updates them automatically, and provides collaboration features that teams need.
Transform how your team plans and executes projects with a platform that does the work for you.
Frequently asked questions
What is the difference between a network diagram and a flowchart?
The difference between a network diagram and a flowchart is their primary purpose: network diagrams show project activities and their time-based dependencies, while flowcharts illustrate decision processes and workflow logic. Network diagrams focus on scheduling and project management, whereas flowcharts map out business processes and decision trees.
Can network diagrams be created in Excel?
Network diagrams can be created in Excel using shapes and connectors, though this approach requires manual updates and lacks automated calculations. Dedicated project management platforms provide automated network diagram generation and real-time updates that Excel cannot match.
How often should project network diagrams be updated?
Project network diagrams should be updated whenever project scope, timelines, or dependencies change, typically during weekly project reviews. Regular updates ensure the diagram remains an accurate reflection of current project plans and continues to guide decision-making effectively.
Which network diagram software works best for teams?
The best network diagram software for teams provides automated diagram generation, real-time collaboration, and integration with project management features. Platforms like monday work management combine network diagramming with comprehensive project tracking and team coordination capabilities.
What is a Gantt chart compared to a network diagram?
Compared to a network diagram, a Gantt chart displays project activities as horizontal bars on a timeline. Network diagrams, in contrast, show activities as connected nodes to emphasize task dependencies. Network diagrams excel at planning and dependency analysis, while Gantt charts are ideal for tracking progress and communicating schedules to stakeholders.
How do you draw a network diagram?
Drawing a network diagram involves listing all project tasks, mapping their dependencies, arranging them in a logical flow from left to right, calculating the critical path, and adding duration estimates. monday work management can automate this process using your project data.