
Imagine sitting in front of 10 different screens, each flashing different numbers, charts, and reports. How would you make a quick, informed decision about your business? For many enterprise leaders, this overwhelming flood of data makes it difficult to focus on what really matters.
An executive dashboard cuts through the noise, consolidating critical insights into a single, clear view. Just like a car dashboard helps a driver monitor speed, fuel, and engine health at a glance, an executive dashboard provides real-time business data, alerting leaders to key issues before they escalate.
This guide explores executive dashboards in more detail, including their benefits, different types, and how to set yours up in monday work management.
Get StartedWhat is an executive dashboard and what should it look like?
An executive dashboard provides a high-level view of business outcomes for the C-suite and senior executives. It focuses on strategic goals, financial health, and company-wide key performance indicators (KPIs).
Unlike general dashboards, which may focus on department-specific analytics or operational data, executive dashboards are designed for high-level decision-making. They prioritize strategic findings over granular details, so the C-suite can quickly assess trends, identify opportunities, and respond to risks without getting lost in data overload.
An effective executive dashboard should have a clean, organized layout with intuitive navigation, so the C-suite can interpret data and take action. It typically includes:
- Data visualizations: Charts, graphs, and key figures to present insights at a glance
- Real-time updates: Automated analytics refreshes for up-to-the-minute accuracy
- Customizable views: Different executives can see the metrics most relevant to their role
- Drill-down capabilities: Interactive elements allowing detailed takeaways when needed
Why executives need real-time dashboards for decision-making
Executive leaders can access key company figures in a variety of ways. They might attend meetings where senior managers present them with key metrics, receive weekly digest reports by email, or have access to hundreds of charts and spreadsheets. These are all valid sources of data that executives may lean on, but here’s why executive dashboards present a superior alternative:
Gain access to the insights that matter
Big data can be daunting. According to research by customer journey management platform TheyDo, half of executives experience data overwhelm due to the vast volume of intel they receive every day. The research found that 34% of executives lack enough hours in the day to analyze data effectively, so they only use 45% of these business findings in their decision-making.
An executive dashboard cuts through the noise, transforming overwhelming raw analytics into a clear, focused view. Instead of sifting through endless reports, executives can configure their dashboard to surface only the most relevant, real-time insights so they can act quickly and with confidence.
Support strategic planning
A bird’s-eye view of the entire company allows the C-suite to connect the dots between different functions and learn what’s happening on the ground. This visibility supports meaningful strategic planning by helping executives anticipate challenges, allocate resources effectively, and ensure every department is aligned with broader business goals.
For example, Howard Kennedy, a London-based law firm with over 450 employees, needed a way to align its ambitious growth strategy across all departments. To expand revenue from £55M to £80M in 3 years, leadership sought a solution to centralize strategy execution, improve cross-team collaboration, and enhance decision-making agility.
The firm used executive dashboards to connect strategic planning to daily operations, enabling its legal services, HR, and finance teams to work toward unified goals. With visibility across departments, leadership was able to turn strategic vision into action by tracking key objectives, quickly adapting to market shifts, and optimizing resource allocation. This approach has also improved Howard Kennedy’s hiring, cybersecurity planning, and budget adjustments by eliminating silos and providing data-driven takeaways at every level.
Prioritize risk management
Every business faces risks — whether financial, operational, or regulatory. But without a centralized view of potential threats, executives may struggle to take proactive action. An executive dashboard works as part of a larger enterprise risk management plan to surface risk indicators in real time, which allows leaders to spot anomalies, monitor compliance, and respond swiftly before small issues escalate into major business disruptions.
For example, a real-time risk management widget in the executive dashboard can track security vulnerabilities, monitor IT infrastructure health, and provide automated alerts if unusual activity is detected. Similarly, financial leaders can use executive dashboards to monitor budget overruns, fluctuating market conditions, or supply chain risks, so they can pivot strategies before financial losses occur.
Increase agility in a changing market
The business world never stands still for long. Whether grappling with economic challenges, evolving customer expectations, or strong market shifts, organizations must adapt quickly to thrive and survive in the shifting landscape.
Research from the Business Agility Institute shows that organizations with strong business agility experience a 31% year-over-year increase in revenue per employee, reinforcing the financial benefits of adaptability. Yet, many enterprises struggle to respond swiftly due to fragmented data and slow reporting processes. Executive dashboards provide real-time visibility into business performance, helping leaders identify risks, reallocate resources, and adjust priorities with confidence.
4 types of executive dashboards
The beauty of setting up an executive dashboard is that it’s customizable. The chief executive officer of one organization may choose to view different metrics versus the CEO of another. Equally, executives within the same company will each look through a different lens of insights. Typically, though, executive dashboards fall into 4 common buckets:
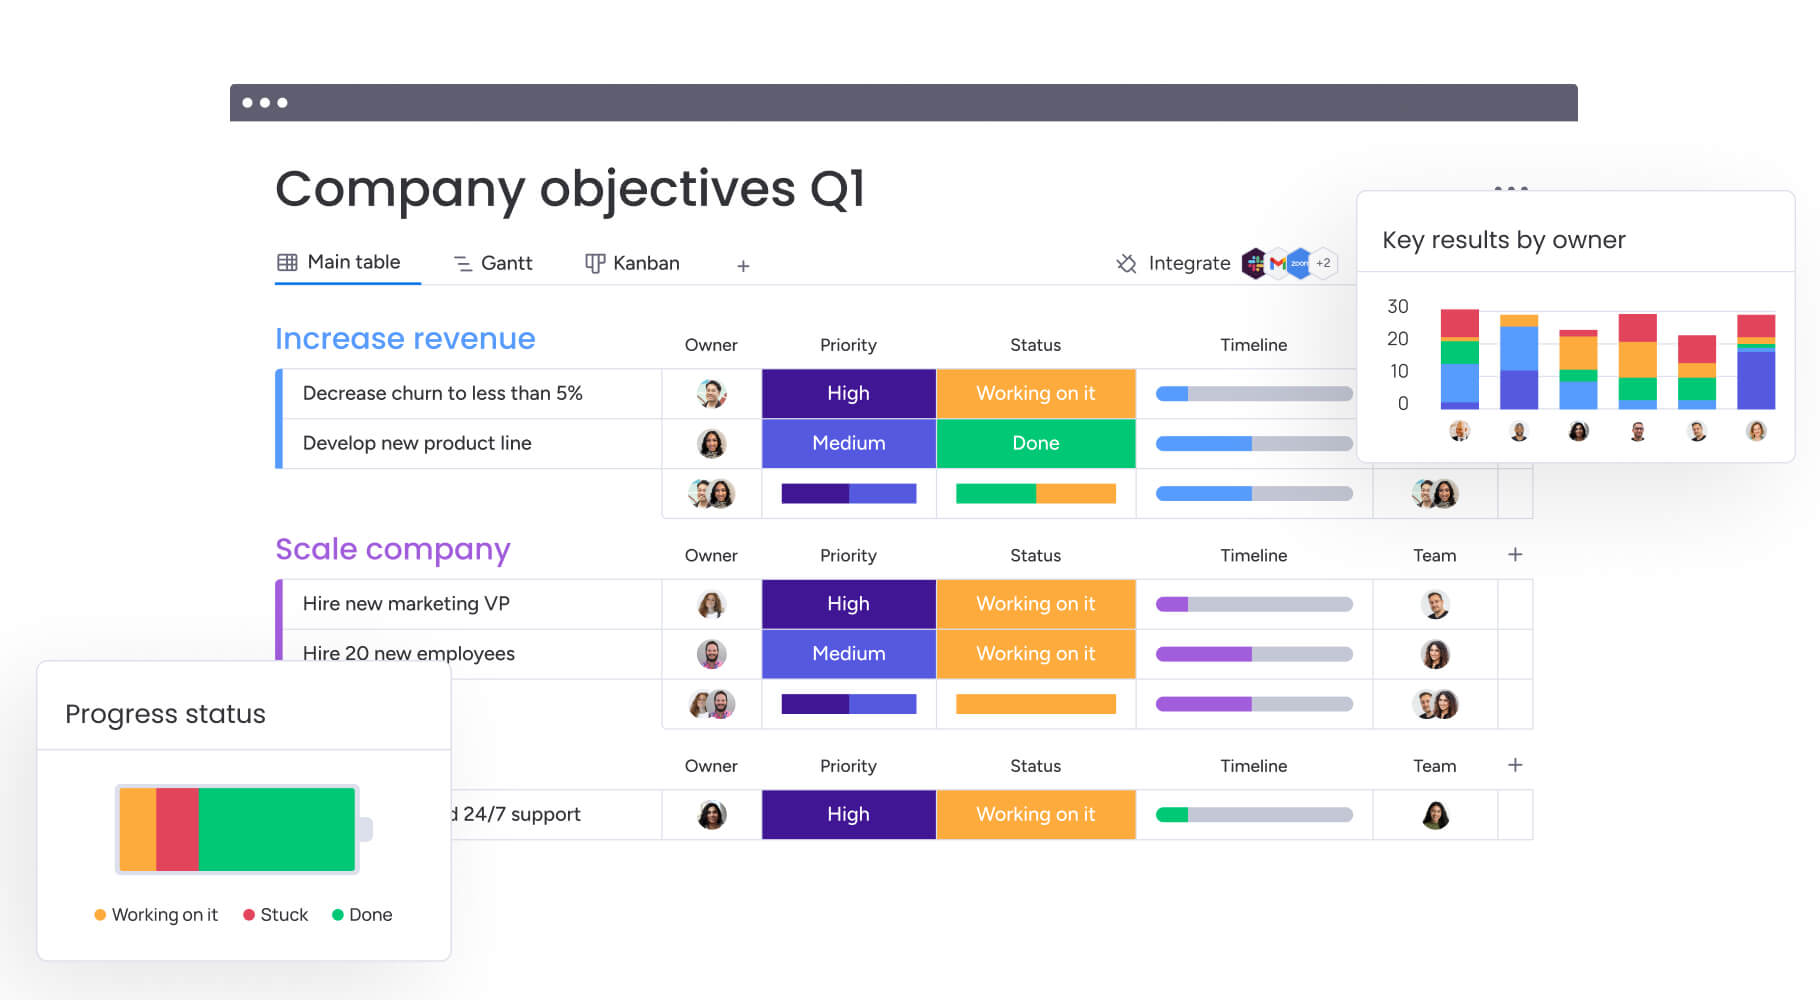
1. Strategic dashboards for long-term performance and business goals
Best for: CEOs, chief financial officers (CFOs), chief operating officers (COOs), and senior executives responsible for corporate strategy
Strategic dashboards provide high-level visibility into long-term business objectives. They help executives track company-wide KPIs, measure progress toward annual goals, and guide strategic planning. These dashboards often include:
- Year-over-year revenue growth
- Customer acquisition and retention trends
- Market share analytics
- Financial forecasts
2. Analytical dashboards for in-depth insights and trend prediction
Best for: CFOs, chief security officers (CSOs), chief marketing officers (CMOs), and strategy executives who rely on data for forecasting and decision-making
Analytical dashboards contain large datasets and help decision-makers uncover patterns, correlations, and predictions. These dashboards are commonly used for financial modeling, market research, and business intelligence. Examples of key metrics include:
- Multi-year financial performance analysis
- Customer behavior and sentiment tracking
- Predictive sales and demand forecasting
- Profitability by product, region, or segment
3. Operational dashboards for real-time monitoring and process efficiency
Best for: COOs, department executives, and senior operations leaders overseeing business processes
Operational dashboards focus on short-term execution and daily business activities. They provide real-time updates on critical functions such as budgeting, production, and service operations. Metrics typically include:
- Live analysis of project budgets vs. total spend
- Cost per acquisition and conversion rates
- Daily or weekly sales results
- Customer service response times and resolution rates
4. Tactical dashboards for performance tracking and execution
Best for: COOs, VPs, and senior executives overseeing execution and efficiency
Tactical dashboards provide granular performance tracking to ensure company-wide strategic execution aligns with leadership goals. Unlike operational dashboards, which focus on daily team tasks, tactical dashboards help senior executives assess productivity, optimize workflows, and improve team efficiency. Common metrics include:
- Employee performance and productivity metrics
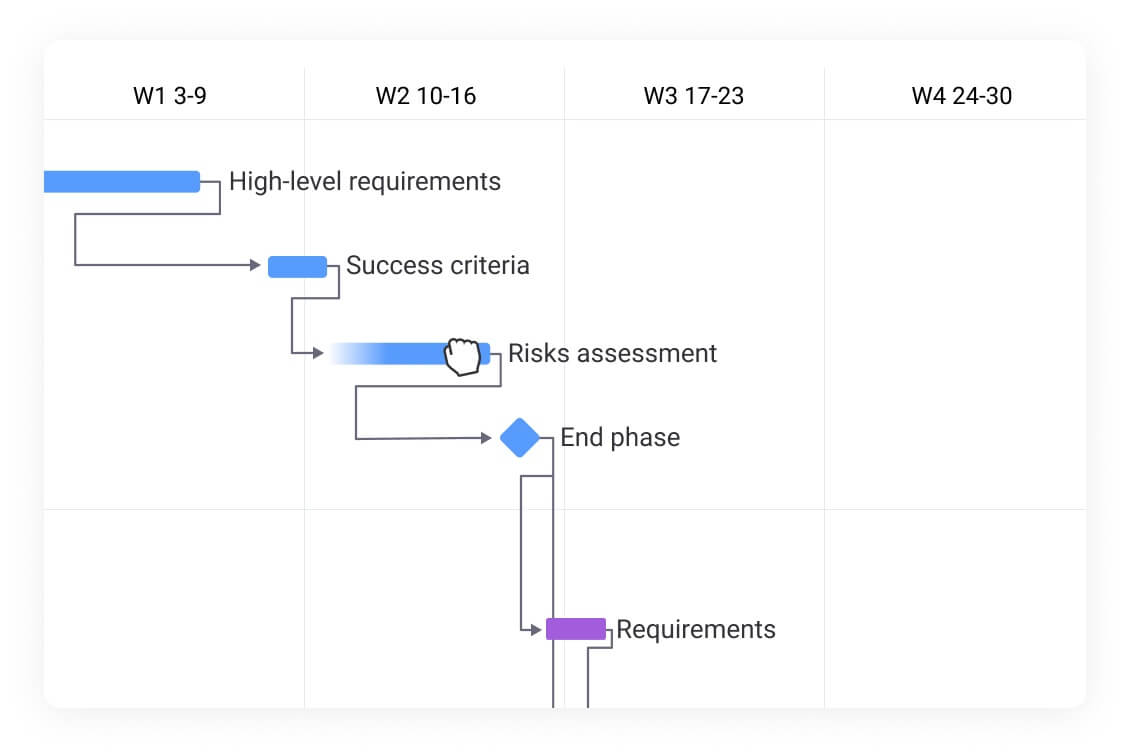
- Project milestones and completion rates
- Marketing campaign engagement (clicks, impressions, cost per lead)
- Hiring and HR analytics (cost per hire, training effectiveness)
9 executive dashboard examples to ensure company-wide success
Every executive dashboard serves a different purpose, depending on who’s using it and what insights they need most. Within the strategic, analytical, operational, and tactical categories we’ve explored, each business function benefits from a tailored dashboard to ensure alignment, accountability, and efficiency.
Here are 9 essential executive dashboards designed to help enterprise leaders track progress, measure success, and make data-driven decisions.
1. CEO dashboards
A chief executive officer (CEO) dashboard provides a cross-functional view of an organization’s performance, allowing the CEO to monitor key business metrics and assess progress toward strategic goals. This dashboard consolidates key figures from all departments, ensuring alignment across teams.
Example metrics:
- Revenue growth and profitability trends
- Departmental performance summaries
- Customer acquisition and retention
- Strategic goal progress and market benchmarks
2. CFO dashboards
A chief financial officer (CFO) dashboard provides visibility into the company’s financial stability, helping finance leaders optimize spending, manage risks, and plan for long-term growth. Instead of manually compiling financial reports, leaders can instantly review profit margins, accounts payable, and budget forecasts.
Example metrics:
- Cash flow and liquidity status
- Profit margins and expense breakdowns
- Budget utilization per department
- Financial risk indicators and forecasts
3. COO dashboards
A chief operations officer (COO) dashboard provides a centralized view of business operations, helping leaders identify inefficiencies and optimize resource allocation across multiple teams, supply chains, and production lines. By integrating live departmental analytics, this dashboard enables COOs to monitor logistics and execute business processes smoothly.
Example metrics:
- Supply chain performance and inventory levels
- Production efficiency and output trends
- Project timelines and resource allocation
- Operational costs and process optimization insights
4. CMO dashboards
A chief marketing officer (CMO) dashboard gives insights into campaign effectiveness, lead generation, and audience engagement. Compiling success metrics from multiple marketing channels allows teams to see at a glance which campaigns are delivering results.
Example metrics:
- Ad spend vs. ROI
- Lead conversion rates and pipeline health
- Website traffic, social media engagement, and email performance
- Customer segmentation and retention trends
5. CSO dashboards
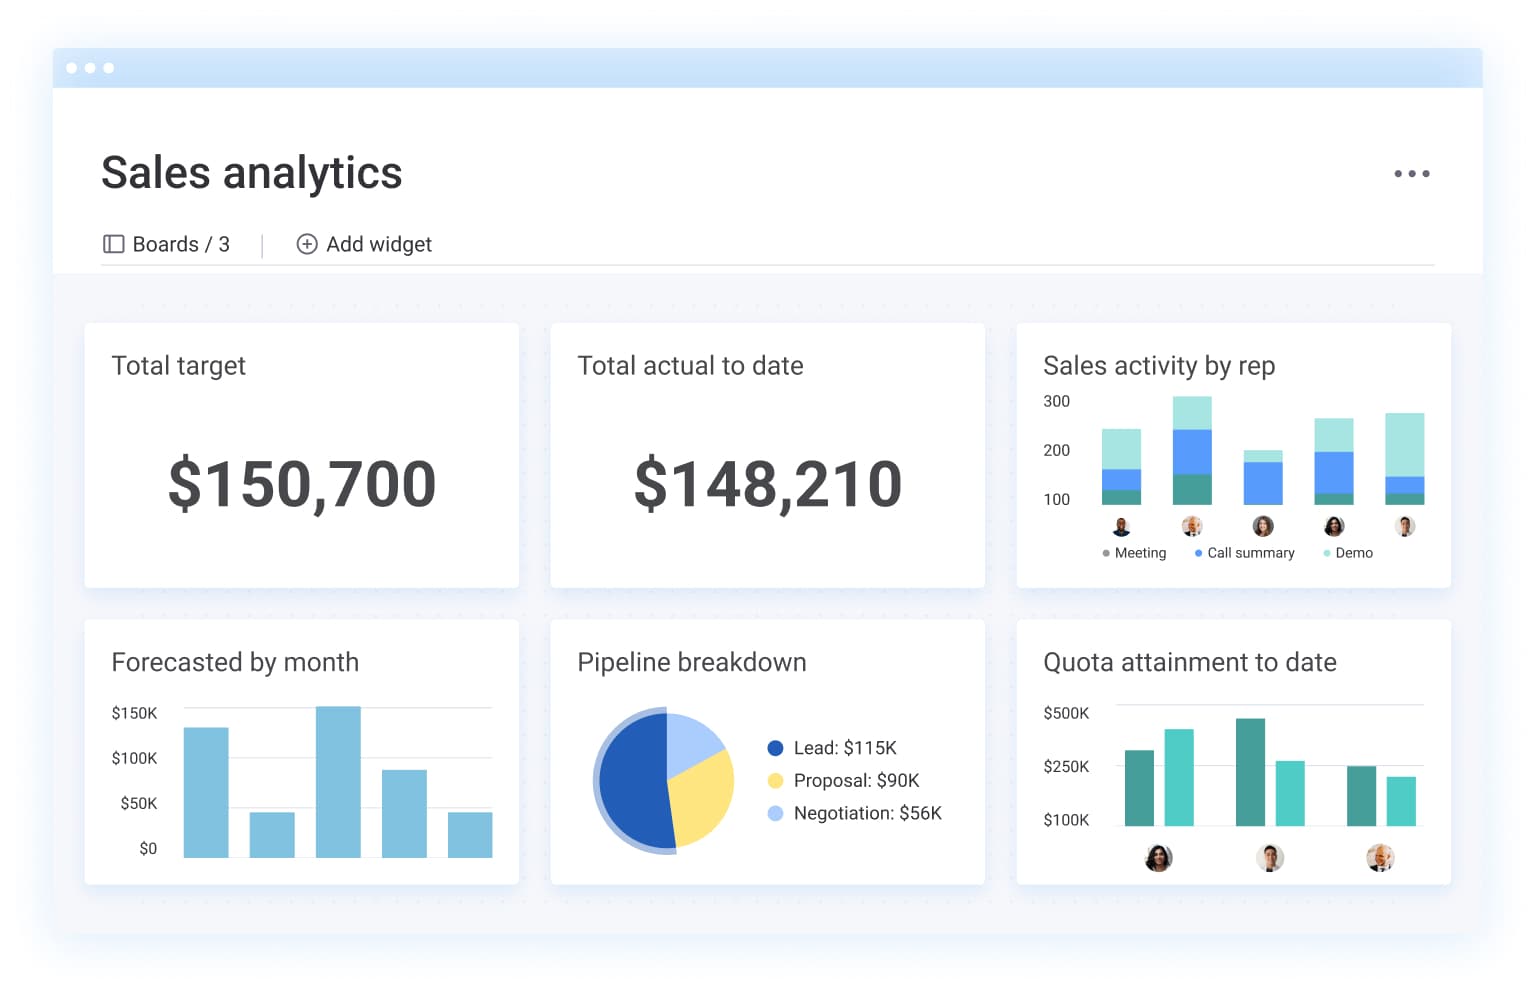
A chief security officer (CSO) dashboard gives chief sales officers visibility into pipeline health, revenue forecasts, and quota attainment. This executive dashboard consolidates key figures from CRMs, helping teams track progress toward revenue goals and identify key opportunities.
Example metrics:
- Total revenue and sales outcomes vs. targets
- Pipeline health and sales cycle duration
- Quota attainment by sales rep and team
- Customer acquisition and churn rates
6. CIO dashboards
A chief information officer (CIO) dashboard allows chief information officers to track IT infrastructure performance, cybersecurity risks, and project timelines. CIOs will also use the dashboard to stay abreast of upcoming software updates or critical security patch deadlines, maintaining a proactive approach to risk management.
Example metrics:
- System uptime and downtime tracking
- Security incidents and breach attempts
- Software update and patch deadlines
- IT budget allocation and project timelines
7. CHRO dashboards
A chief human resources officer (CHRO) dashboard gives chief human resource officers visibility into all aspects of the employee lifecycle and workforce planning. This view consolidates relevant data on recruitment progress and diversity metrics, ensuring a well-balanced talent strategy.
For example, HR teams and recruiters can use the dashboard to monitor multiple job openings and recruitment stages, providing an intuitive way to follow applicants through the hiring funnel, from initial screening to final offer acceptance.
Example metrics:
- Employee satisfaction and engagement scores
- Turnover and retention rates
- Recruitment pipeline and time-to-hire trends
- Workforce diversity and training completion rates
8. CPO dashboards
A chief product officer (CPO) dashboard provides a centralized view of product strategy, development progress, and market performance. By integrating real-time data from engineering, marketing, sales, and customer success, a CPO dashboard enables product leaders to prioritize features, assess product-market fit, and drive revenue growth.
Example metrics:
- Feature adoption rates
- User engagement & retention
- Customer feedback & sentiment (e.g., NPS)
- Revenue impact per feature
9. CCSO dashboards
A chief customer success officer (CCSO) dashboard enables customer success leaders to track customer service strategy, experience, and satisfaction, ensuring the company maintains strong customer relationships.
Example metrics:
- Customer satisfaction and Net Promoter Score (NPS)
- Average response and resolution time
- Ticket volume and escalation rates
- Customer churn and retention rates
5 best practices when setting up executive dashboards
An effective executive dashboard should provide clarity, real-time insights, and strategic alignment. Follow these best practices to design your dashboard:
1. Focus on a specific goal
The most valuable executive dashboards focus on critical KPIs that directly impact business decisions. Avoid cluttering the dashboard with unnecessary data points; each element should serve a clear business purpose and provide immediate value.
Tip: Create separate executive dashboards or views for each executive. A CEO may need high-level revenue trends, while a CFO focuses on cash flow and financial forecasts.
2. Prioritize data accuracy and reliability
A dashboard is only as good as the operational intelligence it presents. Inaccurate or outdated information erodes trust and can lead to poor decision-making. Ensure your dashboard pulls from verified data sources and integrates seamlessly with your existing business systems.
Tip: Regularly enrich your data and flag any discrepancies before they appear in reports.
3. Design for clarity
Executives need quick insights, not complicated reports. Use intuitive data visualization techniques to make complex information digestible. For example:
- Trend lines visualize patterns over time, making them useful for tracking revenue growth, market trends, or customer retention.
- Bar charts are ideal for comparing categories, such as sales performance across different regions or product lines.
- Heat maps use color gradients to highlight high- and low-performing areas at a glance. In an executive dashboard, they can quickly reveal trends, such as regional sales variations or operational bottlenecks, making it easier to identify areas that need attention.
Tip: Avoid using too many colors and hard-to-read fonts. Use consistent formatting and labeling to make dashboards easy to scan.
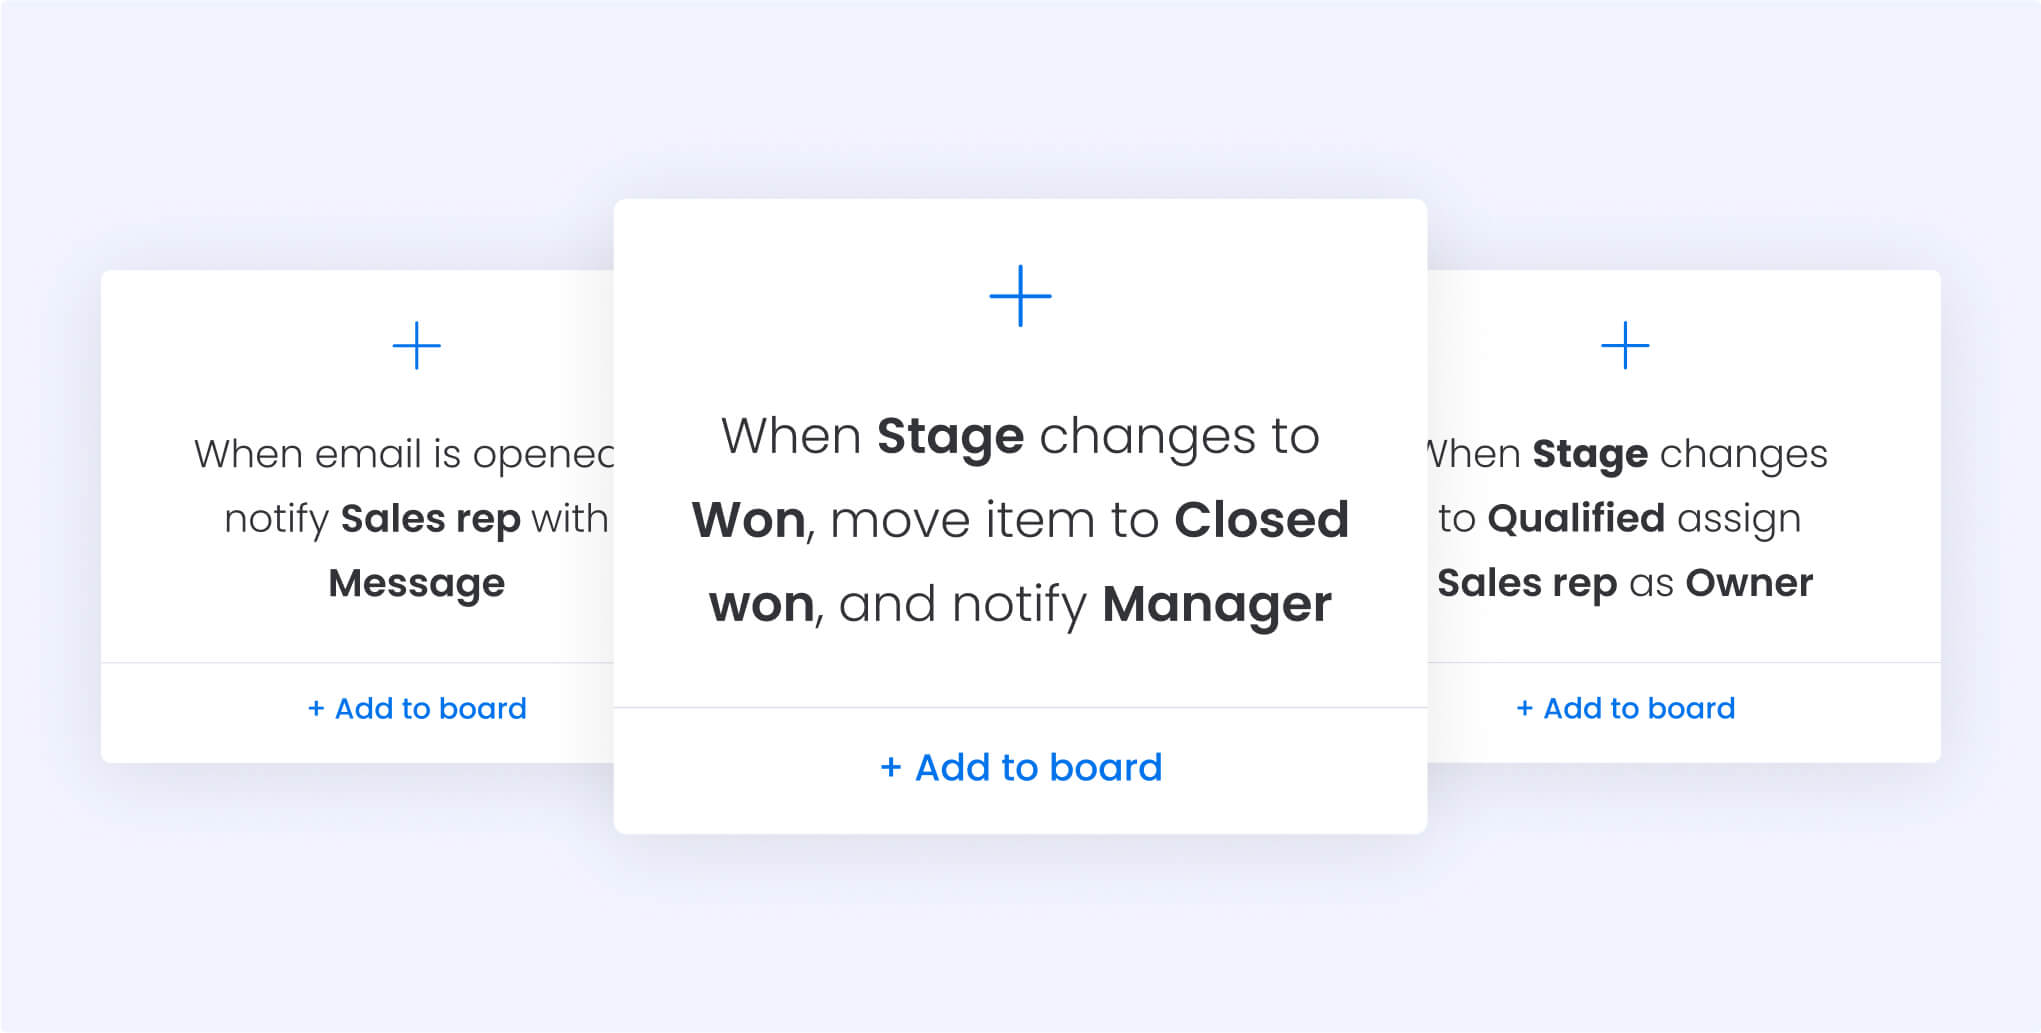
4. Lean on automation
Static dashboards quickly become obsolete, providing only a snapshot in time that may not reflect current business conditions. To keep takeaways relevant, implement dynamic dashboards with automated data refreshes. This gives executives access to the most up-to-date findings without waiting for manually generated reports.
Tip: Set up real-time alerts for critical business changes, such as revenue drops, inventory shortages, or project delays.
5. Make dashboards accessible anywhere
Executives make decisions on the go, so they need the ability to access essential operational intelligence from wherever they are. Dashboards must be available across a range of devices and geographies, so leaders can access insights in real time.
Tip: Test dashboards on multiple screen sizes to optimize for cross-device compatibility and test access from different locations.
What common challenges do executives face with dashboards?
An executive dashboard should be a company’s ultimate decision-making tool, giving leaders a clear, real-time view of company performance. But in reality, many C-suite dashboards fall short of their promise. Instead of providing seamless analytics, they can leave executives frustrated. Here’s why:
Data siloes and integration difficulties
Dashboards rely on data from multiple departments, but when teams use separate tools that don’t communicate with each other, executives are presented with an incomplete or misleading view of company results. For example, the marketing team’s campaign results may sit in one system, while the finance team’s revenue tracking is in another, leading to fragmented insights.
To break down data silos, businesses should integrate their dashboards with a centralized platform that connects all key business tools, such as CRMs, finance software, and HR systems. Automating information transfers between these systems gives executives a real-time, unified view of performance without switching between platforms.
Technology adoption
Even the most sophisticated executive dashboard is useless if the C-suite and their teams don’t use it. Resistance to change, lack of training, or an overly complex interface may cause leaders to fall back on old habits, such as relying on static spreadsheets, requesting manual reports, or making decisions based on intuition. These outdated strategies leave your enterprise dashboards underutilized and ineffective.
To tackle change management and ensure adoption, create intuitive dashboards that are tailored to each senior leader’s needs and goals.
How do I build an executive dashboard in monday work management?
Enterprise companies will love the ability to display high-level takeaways in monday work management. Whether you need data on budget, goals, schedules, resources, or anything else at your fingertips, our platform’s drag-and-drop widgets make it easy to view the key figures you need to make sharper, faster decisions. Here’s how to create an effective executive dashboard:
1. Define your objectives and key metrics
Start by identifying the primary goal of your dashboard; for example, do you want to track finance, resources, or operational health? Determine which KPIs align with these objectives so your dashboard can deliver actionable findings.
2. Organize your boards
An executive dashboard built on monday work management relies on an array of foundational boards to pull data from. Each of these boards represents different projects, teams, or workflows. Once everything is set up, your executive dashboard pulls operational intelligence from your selection of boards to provide a clear and consistent overview of business performance.
To ensure your executive dashboard delivers accurate insights, first identify the boards you want to include, for example, financial planning, resource allocation, or strategic initiatives.
3. Create a new executive dashboard
Navigate to the “Dashboards” section in monday work management. Click on “Add New” and select “Dashboard” to initiate the creation process. When prompted, give your dashboard a clear and specific name based on its purpose and audience. For example, you might name it “CMO’s Executive Dashboard” for marketing findings or “Finance Leadership Overview” for revenue tracking.
Next, once inside your new dashboard, use the “Boards” option to connect the relevant data sources. These boards feed information into your dashboard, allowing executives to monitor key metrics without switching between multiple project views.
For example, if you’re building a financial performance dashboard, you might link boards evaluating budgeting, revenue, and expense management. If it’s an operations dashboard, you might connect boards related to resource allocation, project timelines, and team productivity.
4. Customize your executive dashboard
Based on your preferences, add timelines, widgets, or charts to display data visually. You can customize each by accessing its settings and tailoring the presentation to your needs.
From here, arrange your widgets in a logical sequence, grouping related data. For example, you might group budget information at the top of your page, resources in the middle, and team metrics at the bottom.
5. Set your permission and sharing options
An executive dashboard houses highly confidential information, so you’ll want to carefully consider who can view or edit the dashboard. Set appropriate permissions and share the dashboard with the right stakeholders to ensure alignment and transparency across teams.
6. Test and iterate
Once your dashboard is live, check that it’s accurate and easy to use. Where appropriate, gather feedback from users and make necessary adjustments to improve functionality and relevance. For example, if you rarely reference a chart, consider switching it out for something else you need to keep tabs on as your business objectives evolve.
Get StartedPower your enterprise with monday work management
An executive dashboard is only as powerful as the technology behind it. With the right work management system, enterprise leaders can ensure alignment, business agility, and efficiency by turning data into clear, actionable insights, not just static reports.
With monday work management, enterprise leaders gain a trusted, best-in-class platform to observe progress from dynamic dashboards that act as a single source of truth. Using flexible workflows, intuitive dashboards, and powerful automation, monday work management enables leaders to:
- Align strategy with execution: Set goals, track OKRs, and ensure ownership across teams.
- Gain full visibility and control: Monitor projects, risks, and resources in real time to make informed decisions faster.
- Optimize efficiency at scale: Streamline workflows, break down silos, and accelerate execution without complexity.
Unlike traditional dashboards that simply display data, monday work management connects strategic insights to action, so leaders can see what’s happening and respond immediately.
Enterprise leaders need clarity, control, and confidence, and that’s exactly what you’ll get when you use monday work management as your decision-making hub. See how it works for your organization by signing up for a free trial today.
Get StartedFAQs
What are the 3 key aspects of designing a great dashboard?
Businesses can focus on 3 main principles to design a dashboard that enhances visibility, efficiency, and strategy execution. These include:
- Relevance: Focus on essential metrics aligned with business goals, and avoid cluttering the dashboard with excessive data points.
- Clarity and simplicity: Use clear visuals, color coding, and intuitive design to make key figures easily digestible.
- Real-time accuracy: Ensure the dashboard pulls from reliable, up-to-date sources to support informed decision-making.
What is the difference between executive and operational dashboards?
Executive and operational dashboards both provide key analytics into the pulse of a business at any given time. But they do so from different angles:
- Executive dashboards are a consolidated, visual display of your organization’s key performance indicators. It gives enterprise leaders a snapshot of their business health in real time.
- Operational dashboards track day-to-day activities and workflows for department heads and team leads. These dashboards focus on project execution, process efficiency, and team productivity.
How do executive dashboards improve decision-making?
Executive dashboards improve decision-making by transforming raw data into actionable insights. They allow leaders to:
- Identify trends early: Spot patterns in sales, market shifts, or operational success before they escalate.
- Assess risks: Monitor financial stability, customer churn, or supply chain disruptions as they happen.
- Align strategy with performance: Track progress toward key business goals and adjust tactics based on data-backed findings.
- Speed up responses: Reduce reliance on manual reports, enabling faster, more informed decision-making in critical situations.
Can executive dashboards integrate data from multiple sources?
Yes, executive dashboards can pull data from various systems, such as CRMs, finance platforms, and HR tools, using integrations and automated syncing. This ensures a unified, up-to-date view of business performance across departments.