
Every successful business plan depends on one thing: accurate forecasting. But when projections rely on scattered spreadsheets or outdated assumptions, financial decisions become reactive instead of strategic. Many teams struggle to connect forecasts to the realities of sales, expenses, and cash flow, making it difficult to see where the business is truly heading.
That’s where financial forecast templates make a real difference. They bring structure, clarity, and consistency to your planning process — helping you organize data, test scenarios, and adjust in real time. Whether you’re preparing for investor presentations, managing budgets, or guiding long-term strategy, a reliable forecasting model keeps your team aligned and your finances predictable.
In this article, you’ll find practical guidance on how to build and customize templates for income statements, balance sheets, and cash flow forecasts. You’ll also discover how to connect these templates to your daily operations, transforming financial forecasting from a one-time report into a living, strategic tool that drives smarter decisions all year long.
Key takeaways
- Match timeframes to objectives: use 12 month templates for cash flow management, three year forecasts for investor planning, and five year projections for long-term strategy.
- Ground projections in operational reality: align financial assumptions with real sales capacity, resource availability, and project timelines to avoid inflated targets.
- Build three forecast scenarios: create best-case, base-case, and worst-case models to understand key variables and prepare effective contingency plans.
- Connect planning to execution with monday work management: integrate your forecasts with live project data, AI-powered insights, and team dashboards for real-time accuracy.
- Keep forecasts current: review and update projections monthly or quarterly to detect trends early and adjust before small variances become major issues.
What is a financial forecast template?
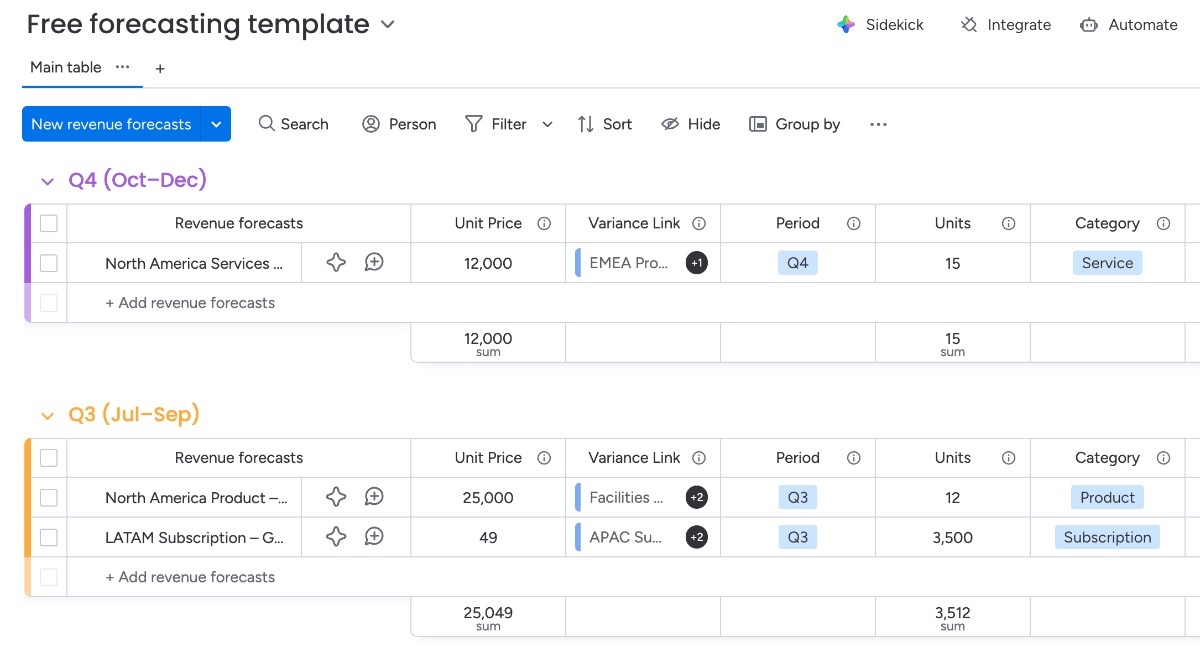
A financial forecast template is a pre-built spreadsheet that helps you predict future revenues, expenses, and cash flows. In simplistic terms, it’s a ready-made framework with formulas already in place — you just add your numbers.
If you want more flexibility, a spreadsheet template can be adapted to fit your business’s forecasting style.
Although business forecasting can be complex, these templates turn complex financial modelling into a step-by-step process. Instead of building formulas from scratch, you input your data and watch the calculations happen automatically.
Financial forecasts vs projections vs budgets
Financial forecasts predict what will likely happen based on current trends. On the other hand, projections explore different scenarios and possibilities whereas budgets set specific targets for what should happen.
If you need a separate resource to outline these scenarios, a pro forma template for Excel can guide your assumptions and calculations.
Here’s how they differ in practice:
| Term | Purpose | Time frame | Flexibility | Primary use |
|---|---|---|---|---|
| Financial forecast | Predict likely outcomes | 12-36 months | Updated frequently | Strategic planning |
| Financial projection | Estimate scenarios | 3-5 years | Scenario-based | Business plans |
| Budget | Set spending targets | 12 months | Fixed annually | Operational control |
Benefits of using financial forecasting templates
Templates give you structure without starting from zero, ensuring you include all critical components while saving hours of setup time.
However, the real value comes from consistency and accuracy. When everyone uses the same template, you can compare forecasts across departments, and built-in formulas reduce errors. Professional formatting makes stakeholder presentations more compelling, while an Excel accounting template can further simplify data collection.
Types of financial projection templates
Different planning horizons need different templates. Your choice depends largely on whether you’re planning next quarter’s cash flow or pitching investors on a five year vision.
Let’s explore the different types of financial projection templates, and how they can help:
12 month financial forecast template
This template breaks down revenue and expenses month by month. It’s your go-to for operational planning and cash management.
Monthly detail helps you spot seasonal patterns and plan for working capital needs. You’ll see exactly when cash gets tight and when you’ll have surplus to invest.
3 year financial projection template
The three year template balances detail with strategic vision. Year one typically shows quarterly breakdowns, while years two and three show annual summaries.
This timeframe works well for investor presentations and strategic planning. It’s far enough to show growth potential but close enough to make reasonable assumptions.
5 year financial forecasting template
Five year templates focus on trends rather than precise numbers. They help you evaluate major investments and long-term strategic decisions.
Accuracy naturally decreases over time, so these projections emphasize direction over detail. Use them for market expansion plans or major capital investments.
Start-up financial projections template
Start-up templates handle unique challenges like pre-revenue periods and rapid growth assumptions. These factors can also be captured in a startup budget template for accurate early-stage planning. They include specific sections for:
- Customer acquisition costs: how much you’ll spend to gain each customer.
- Monthly burn rate: cash spent before reaching profitability.
- Funding runway: wow long your cash will last at current spending.
Small business financial forecast template
Small business templates strip away complexity to focus on essentials. They’re designed for owners who handle their own financial planning without a finance team.
These templates prioritize cash flow and basic profitability metrics. Simple scenario planning helps you prepare for different outcomes without overwhelming detail.
If you need to present these spending plans to stakeholders, a budget proposal template can streamline the process.
Essential components of financial projections
Every financial forecast needs three core statements that work together. It’s also helpful to rely on a financial statement template that organizes these core components for clarity.
Understanding how they connect can really help you build more accurate projections.
Income statement forecast template elements
The income statement shows whether you’ll be profitable. It starts with revenue and subtracts costs to show net income. Consider using a profit and loss template for an easy overview of your revenue and expenses.
Key components include:
- Revenue projections: your expected sales based on market analysis.
- Cost of goods sold: direct costs to produce your product or service.
- Operating expenses: overheads like rent, salaries, and marketing.
- EBITDA: earnings before interest, taxes, depreciation, and amortization.
Cash flow projection components
Cash flow tracks when money actually moves in and out, so consider a cash flow statement template to keep it organized.
Remember that although you can show a profit on paper, you may still be running out of cash if timing doesn’t align: this is a very common challenge, as one analysis found that only 28% of companies’ cash forecasts were within 10% of their annual targets.
The three sections tell different parts of your cash story:
- Operating activities: daily business cash movements.
- Investing activities: equipment purchases and asset sales.
- Financing activities: loan proceeds and repayments.
Balance sheet forecasting items
The balance sheet shows what you own and owe at specific points in time. It must always balance: Assets = Liabilities + Equity.
Components fall into distinct categories. Current assets include cash and receivables. Fixed assets cover equipment and property. Liabilities show what you owe. Equity represents owner investment plus retained earnings.
Break-even analysis calculations
Break-even analysis shows when you’ll start making money. The formula is straightforward: Fixed Costs ÷ (Price per Unit – Variable Cost per Unit) = Break-even Units.
This calculation helps you understand minimum performance requirements. It’s especially useful when evaluating new products or pricing changes.
How to build financial projections in 6 steps
Building projections feels less overwhelming when you break it into distinct steps.
Each of the steps outlined below builds on the previous one to create a complete forecast:
Step 1: collect historical financial data
Start with what you know. Pull together two to three years of financial statements, monthly revenue patterns, and expense trends.
This data reveals patterns you might miss otherwise. Seasonal fluctuations, growth rates, and cost relationships all become visible when you analyze historical performance.
Step 2: set revenue projection assumptions
Revenue forecasting requires choosing the right approach for your business model. Consider these methods:
- Market-based: start with total market size and estimate your share.
- Customer-based: build up from customer acquisition and retention rates.
- Product-based: forecast each product line separately.
Step 3: forecast operating expenses
Expenses behave differently as you grow. Fixed costs like rent stay constant while variable costs like materials change with sales. Keep in mind that semi-variable costs like utilities have both fixed and variable components.
Understanding these relationships helps you model how profitability changes with growth. A business with high fixed costs becomes more profitable as it scales but some organizations also rely on a budget formula to map these expenses precisely against projected revenue.
Step 4: project cash flow statements
Cash flow timing creates the biggest challenges for growing businesses. Consider these timing differences:
- Accounts receivable: the gap between making a sale and getting paid.
- Inventory: cash tied up in products waiting to sell.
- Accounts payable: the delay between receiving goods and paying suppliers.
Step 5: complete financial statement projections
The three statements connect in specific ways. Income flows to the balance sheet through retained earnings. Both feed the cash flow statement.
Maintaining these connections validates your assumptions. Ensuring the statements connect validates your assumptions; a mismatch indicates an area that needs review.
Step 6: test multiple scenarios
Finally, create three scenarios to understand your range of outcomes. Best case uses optimistic assumptions. However, base case reflects most likely outcomes and worst case prepares you for challenges.
This approach helps you identify which assumptions matter most, and an impact analysis template can reveal how each variable affects your final forecast.
It’s important to note that small changes in key variables can dramatically affect results, so scenario planning is a must: refining your outcomes for different market conditions.

Revenue projection methods for accurate forecasts
Reliable revenue forecasting is the foundation of every financial plan. The method you choose should fit your business model, available data, and growth stage. Some approaches work best for established teams with historical sales data, while others help new ventures estimate potential in emerging markets.
Below are three proven methods for projecting revenue accurately — each offering a different perspective on how money flows into your business and how to plan for what comes next.
Market-based revenue forecasting
Start with the total addressable market and work down. What’s the overall market size? What portion can you realistically serve? What share can you capture?
This method works well for new products or market expansion as it grounds your projections in market reality rather than wishful thinking.
Bottom-up sales projections
Build revenue from specific sales activities. How many salespeople will you have? How many deals can each close monthly? What’s your average deal size?
This approach often produces more accurate short-term forecasts. It directly connects revenue to operational capacity.
Subscription revenue templates
Recurring revenue models need specialized metrics. Monthly recurring revenue (MRR) forms your baseline. Customer lifetime value (CLV) shows total expected revenue per customer.
It’s also important to include the churn rate — the percentage of customers who cancel. Even small changes in retention dramatically affect long-term revenue.
Advanced cash flow forecasting strategies
Basic forecasting gets you started, but sophisticated approaches provide more actionable insights.
These forecasting strategies detailed below will help you stay ahead of cash flow challenges.
Rolling forecast methodology
Rolling forecasts always look forward the same period, like 12 months. As each month ends, you add another month to the forecast.
Benefits include:
- Continuous planning horizon: always see the same distance ahead.
- Fresh assumptions: regular updates based on actual results.
- Improved accuracy: learn from variances and adjust
Working capital projections
Working capital directly affects your company’s liquidity and cash flow. When receivables rise, available cash drops; when payables stretch, cash temporarily improves. Tracking these movements accurately is key to avoiding shortfalls.
With connected platforms like monday work management, teams can monitor receivables, payables, and inventory in real time. This visibility links day-to-day operations with financial forecasts, keeping projections current and ensuring project budgets stay aligned as conditions change.
Seasonal cash flow planning
Seasonal businesses need special strategies. Build cash reserves during peak seasons. Arrange credit facilities for lean periods. Time inventory purchases to match demand patterns.
Planning for seasonality prevents cash crunches during predictable slow periods.
5 ways to improve your financial forecasting accuracy
ven the best forecasts can miss the mark when they rely on assumptions instead of real data. Accuracy comes from discipline — questioning optimism, capturing hidden costs, and continuously updating numbers as new information emerges.
The strategies below highlight the most common forecasting pitfalls and practical ways to avoid them, helping your projections stay reliable, grounded, and ready for real-world conditions.
1. Overly optimistic revenue projections
Optimism bias affects most forecasts. We often overestimate growth rates and underestimate competitive challenges.
Ground your assumptions in reality. Use historical growth as a baseline. Consider market saturation and match growth projections to operational capacity.
2. Missing hidden operating costs
Certain costs hide until you’re already committed. Common examples include:
- Compliance costs: industry regulations and licensing.
- Technology infrastructure: software subscriptions that multiply with headcount.
- Professional services: legal and accounting fees that grow with complexity.
3. Inadequate cash buffer planning
Running out of cash kills profitable businesses. Timing mismatches between revenue and expenses create dangerous gaps.
Maintain reserves equal to three to six months of operating expenses (this buffer handles unexpected delays and seasonal fluctuations).
4. Static vs dynamic forecasting
Static forecasts become outdated quickly. Dynamic forecasting, which continuously incorporates actual results and fresh assumptions, can produce forecasts that are 20% to 40% more accurate.
The extra effort pays off through improved accuracy and faster response to changing conditions.
5. Disconnected operational data
Financial projections must reflect operational reality. Can your team actually deliver the projected revenue? Do you have production capacity for forecasted sales?
Connect financial assumptions to operational metrics. This is critical for bridging the disconnect between high-level strategy and on-the-ground execution, as research shows a significant perception gap exists between leadership and employees.
For example, 92% of senior leaders believe their organization fosters shared ownership, while only 76% of individual contributors agree.
Always ensure that you link revenue to sales capacity and tie expenses to actual requirements.
Financial forecast templates by business stage
The right forecasting approach depends on where your business is in its growth journey. A start-up estimating first-year revenue needs a very different model from an established enterprise managing multiple divisions. Aligning your forecast template with your company’s maturity ensures the data you track supports the decisions you need to make.
Below we’ve listed three forecasting templates tailored to key business stages and designed to keep projections both realistic and actionable.
Pre-revenue start-up projections
Without historical data, you rely on market research and assumptions. Focus on:
- Market sizing: use competitor data and industry benchmarks.
- Customer validation: test assumptions with potential customers.
- Funding requirements: calculate runway to profitability or next round.
Growth-stage company templates
As businesses scale, forecasting becomes a balancing act between ambitious targets and real operational limits. Templates at this stage help track performance across markets, allocate resources efficiently, and plan capacity for sustainable growth.
Using connected platforms like monday work management, teams can link financial projections directly to live project data and resource planning. This alignment keeps forecasts grounded in operational reality while enabling faster, data-driven adjustments as conditions change.
Enterprise financial planning models
Large organizations need sophisticated approaches for multiple divisions and international operations. Consolidate forecasts across business units. Handle currency fluctuations. Meet regulatory reporting requirements.
Automate and enhance your financial projections
Manual spreadsheets can only take your forecasting so far. As your business grows, accuracy and speed depend on connecting financial planning directly to live operational data. Modern forecasting tools and workflows make this possible by automating updates, streamlining collaboration, and delivering real-time visibility into performance.
The approaches below show how automation and connected systems transform static projections into adaptive, data-driven forecasts that evolve with your business.
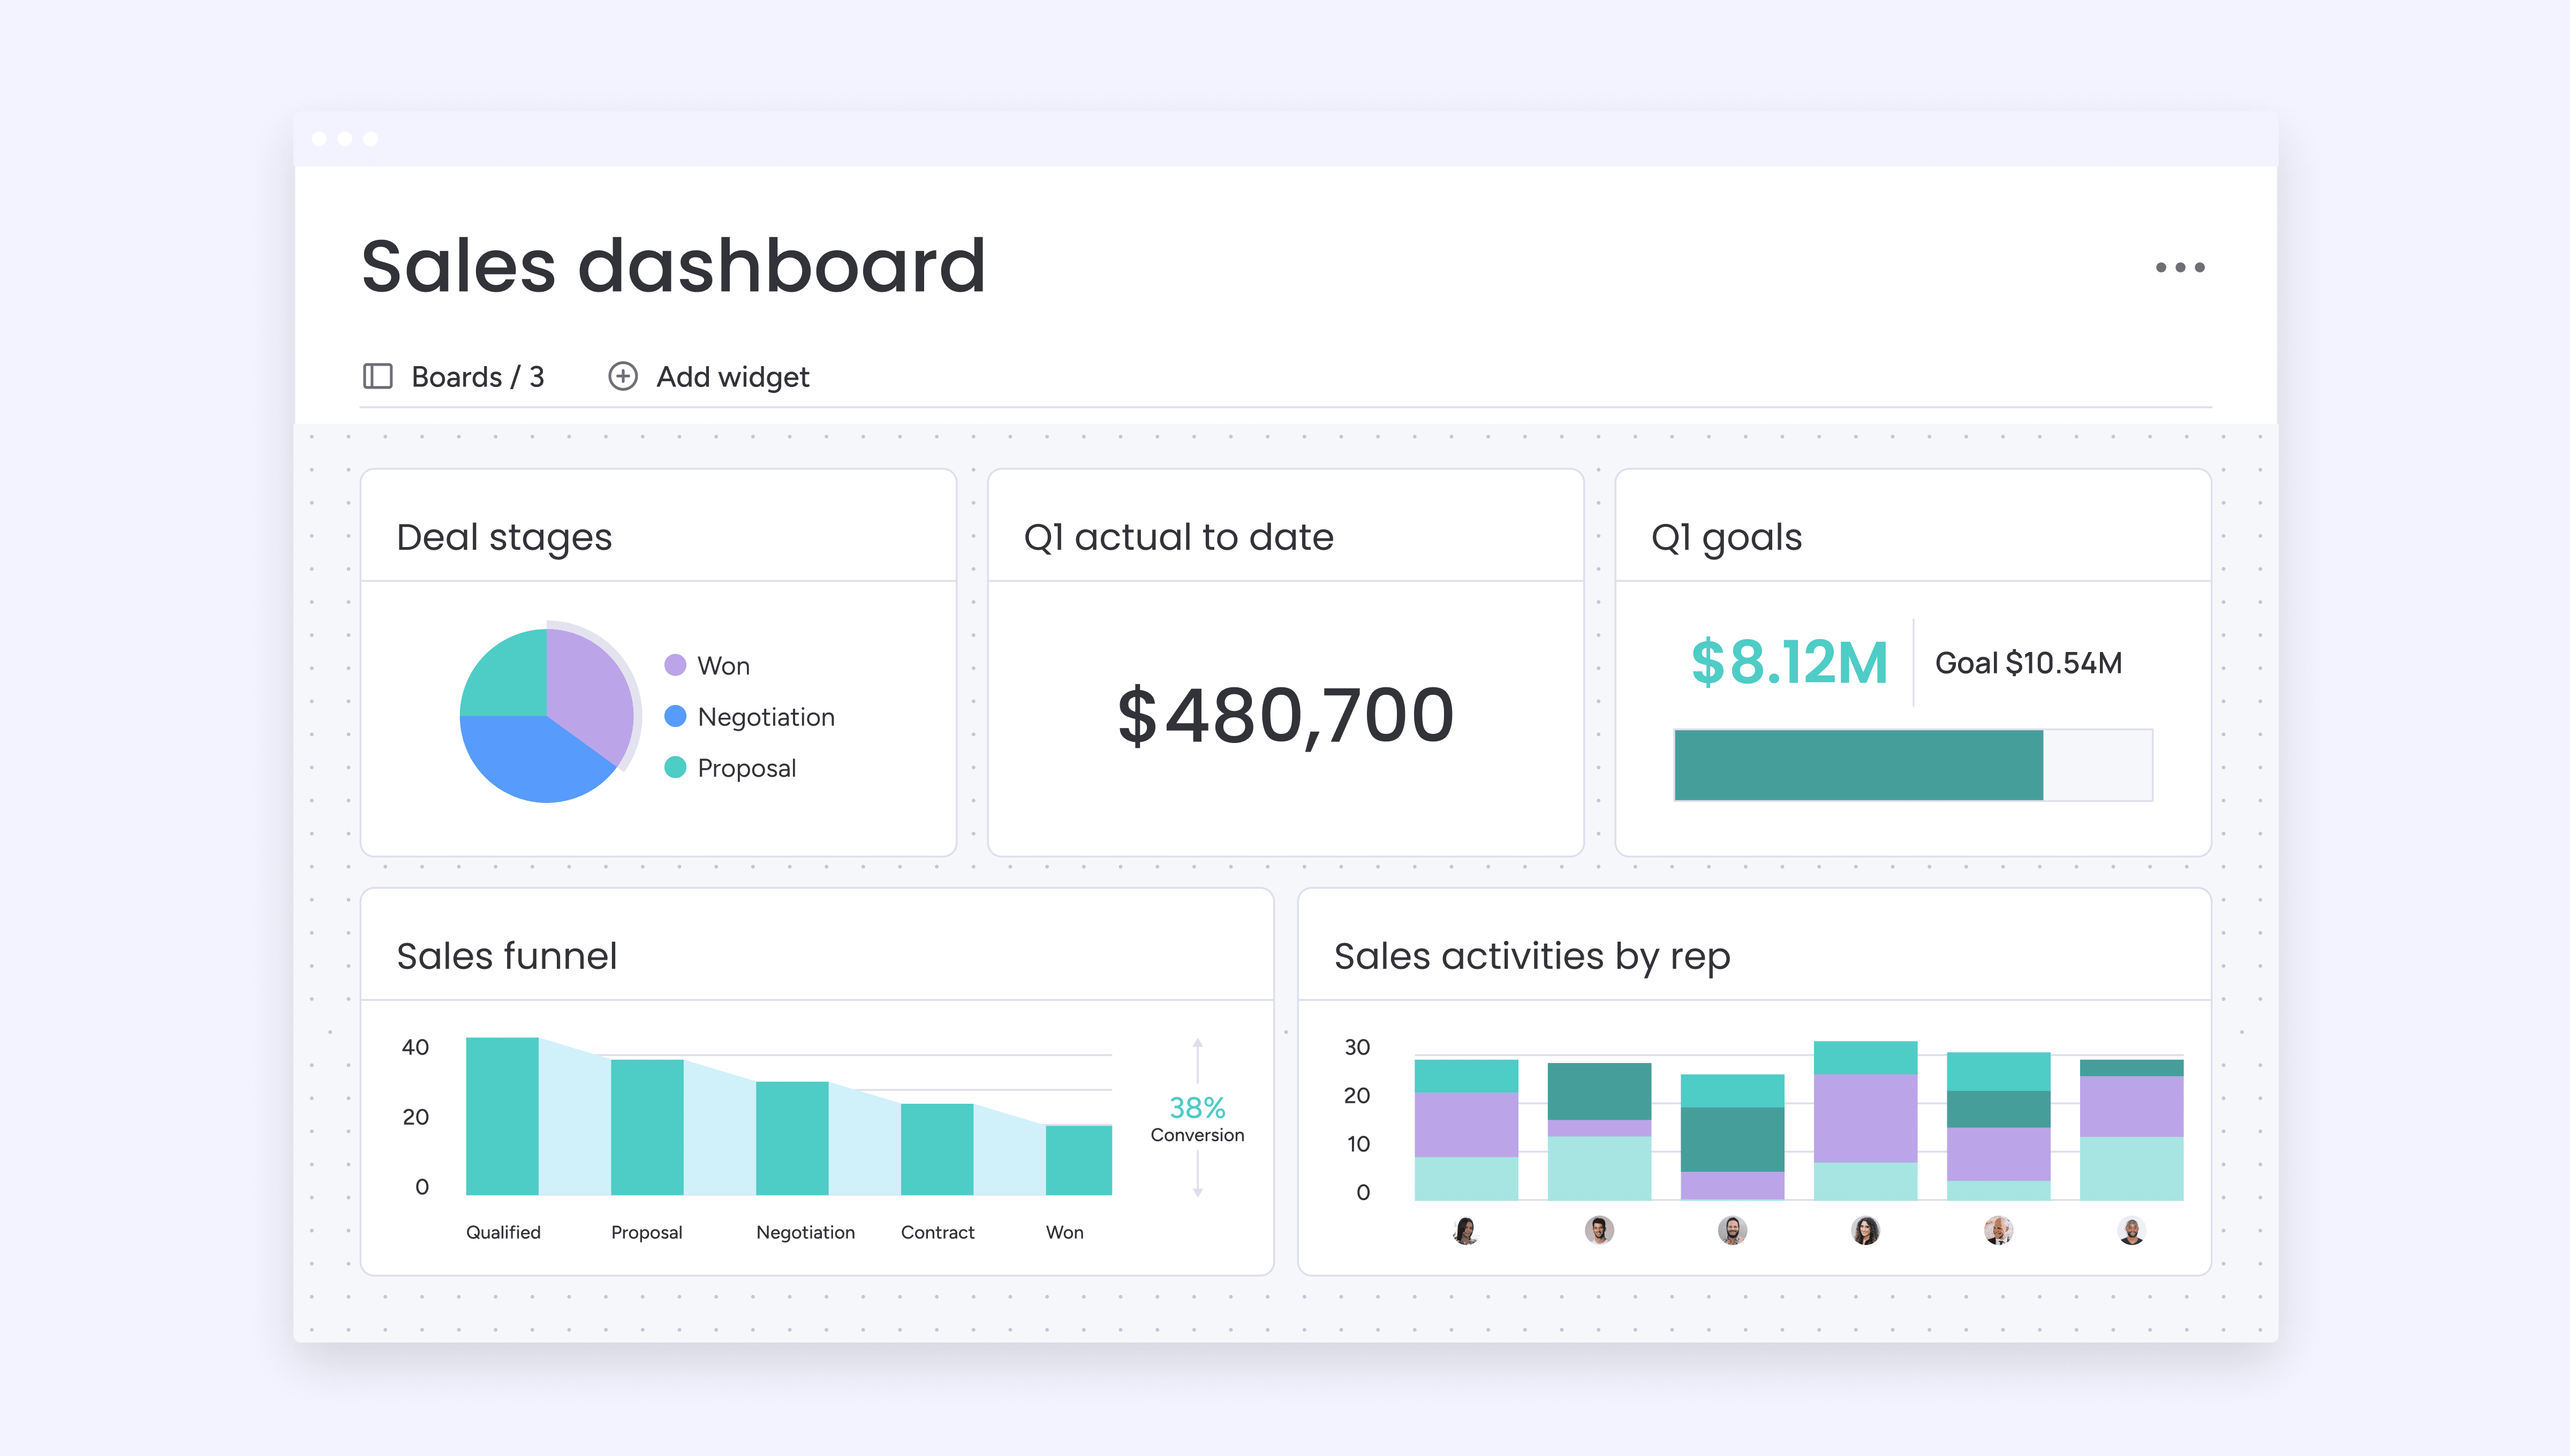
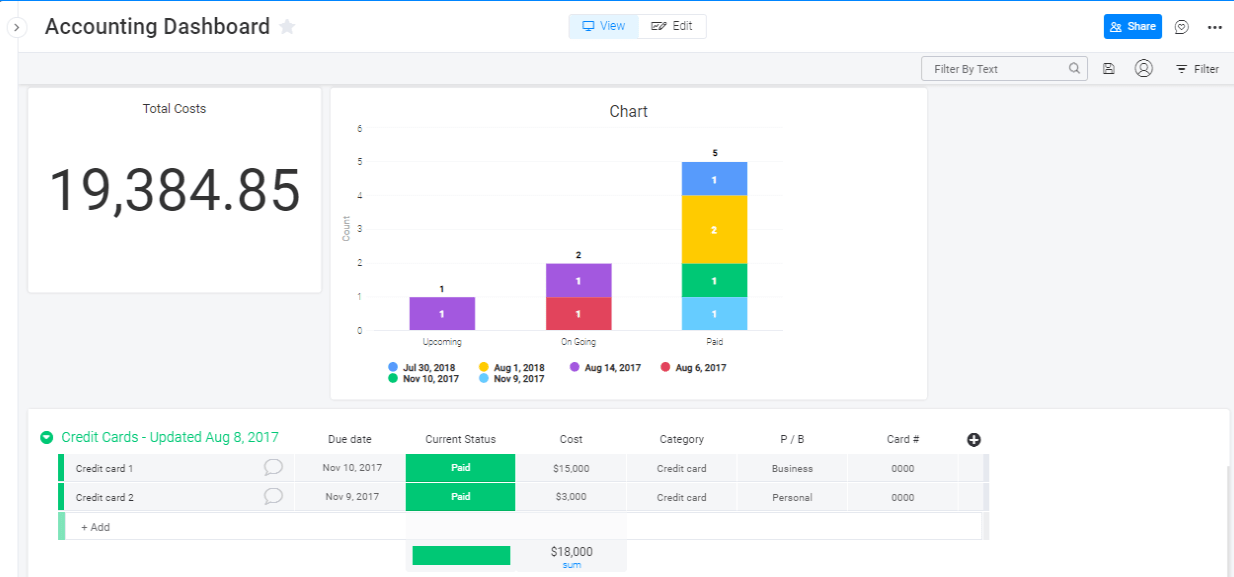
Real-time financial dashboard integration
Live dashboards show variances as they happen: you can spot trends early and adjust before small issues become big problems.
Automatic updates eliminate manual data entry. Variance analysis happens instantly. Early warning indicators help you stay proactive.
Automated scenario modelling
Generate multiple scenarios instantly by adjusting key variables. Test different pricing strategies. Explore expansion options. Evaluate risk factors.
This capability makes thorough analysis accessible to more team members, not just financial experts.
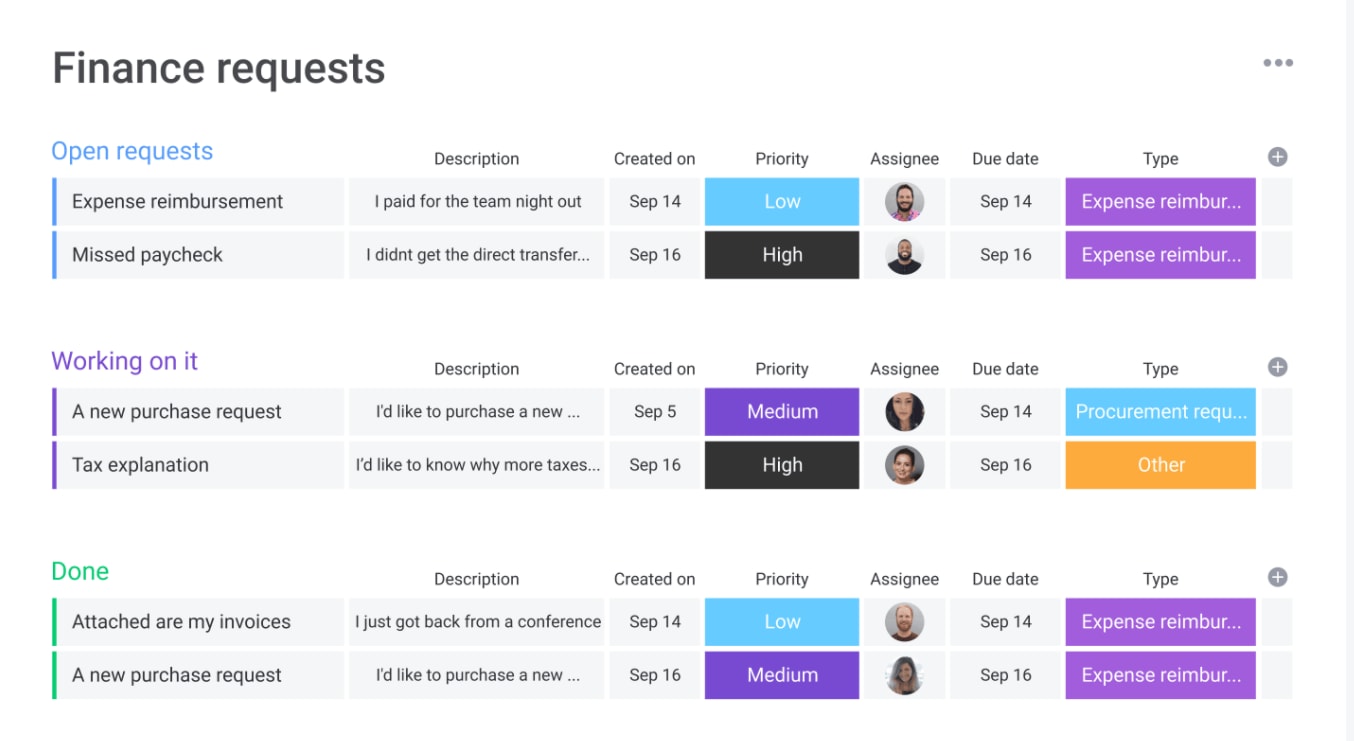
Collaborative planning workflows
Financial planning works when departments contribute their expertise. Sales provides pipeline data. Operations confirms capacity. Marketing shares campaign plans.
Structure this collaboration with defined workflows. This is especially important since tech adoption varies widely by department; for instance, one report found that while 77% of marketing professionals use AI, only 51% of their sales counterparts do.
Remember, it’s essential to define who contributes what. Set review cycles. Maintain version control.
Build dynamic financial forecasts with monday work management
Traditional spreadsheets create silos between planning and execution. Your financial projections live separately from the work that drives them.
Sophisticated platforms like monday work management changes this by connecting financial planning to operational reality. Your forecasts reflect actual project timelines and resource allocation.
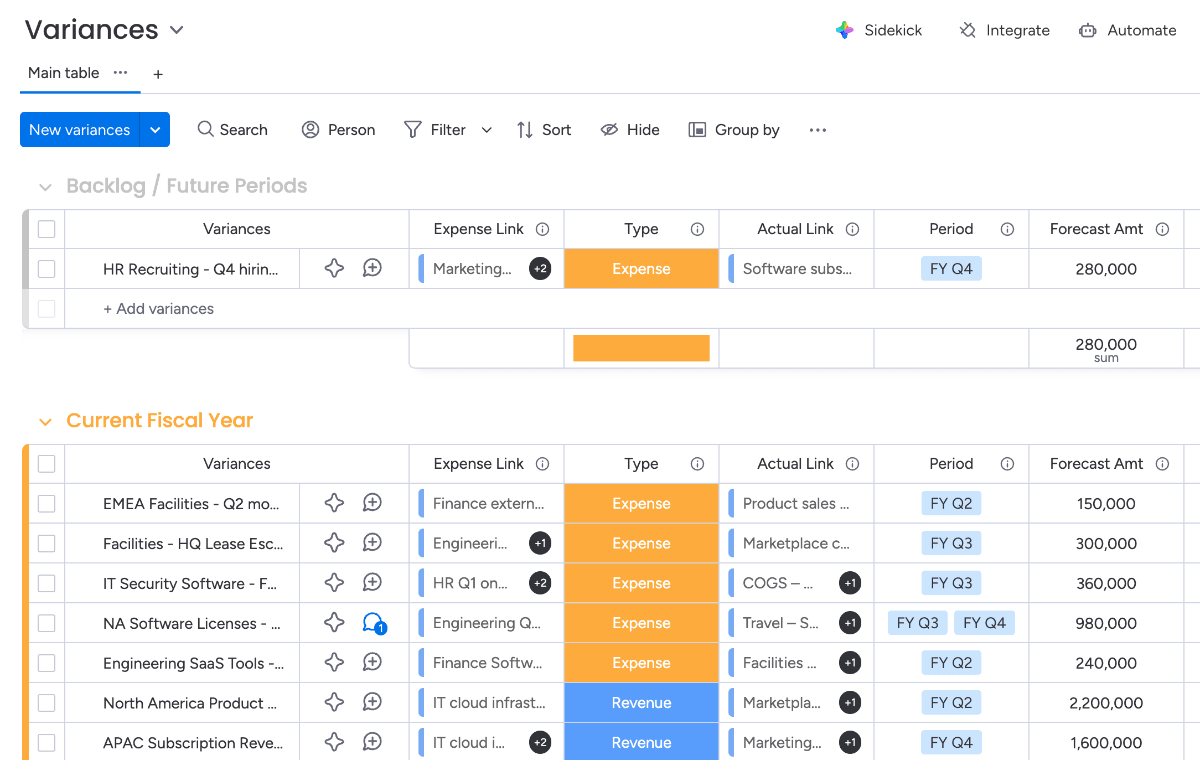
Connect financial and operational data
Link revenue projections to sales pipeline data. Connect expense forecasts to project budgets. Align cash flow timing with project milestones.
This integration ensures your financial plans match what’s actually happening in your business.
Automate forecast updates with AI
AI Blocks categorize transactions and identify trends automatically. Digital Workers monitor performance and flag variances. Smart notifications alert you when actuals deviate from plan.
These capabilities reduce manual work while improving forecast accuracy.
Collaborate across finance and operations teams
Shared dashboards give everyone visibility into financial targets and performance. Integrated workflows connect planning to execution. Real-time updates keep all stakeholders aligned.
Create custom financial templates without code
Every business has unique needs but monday work management lets you build custom templates that match your specific requirements.
Drag-and-drop interfaces make customization simple. Formula columns handle complex calculations. Pre-built templates provide starting points you can modify.
Frequently asked questions
How often should I update my financial forecast template?
Update your financial forecast template monthly or quarterly based on your business volatility. More frequent updates improve accuracy and help you respond faster to changing conditions.
What's the difference between a financial forecast and a financial projection?
A financial forecast predicts likely outcomes based on current trends and historical data. A financial projection explores potential scenarios under different assumptions, often extending further into the future.
How do I create a financial forecast in Excel?
Create a financial forecast in Excel by setting up separate sheets for income statements, cash flow, and balance sheets. Link cells between sheets with formulas, build in your assumptions, and use Excel's built-in functions for calculations.
Can I build financial projections without accounting experience?
You can build basic financial projections using templates without deep accounting knowledge. Templates provide structure and formulas, though complex businesses benefit from professional guidance to ensure accuracy.
What should I include in a start-up financial forecast template?
Include pre-revenue assumptions, customer acquisition costs, monthly burn rate, funding runway, and milestone-based revenue projections in your start-up financial forecast template. Focus on cash flow since profitability may be years away.
How many years should my financial projections cover?
Financial projections typically cover three to five years for strategic planning and investor presentations. Use 12-month forecasts for operational planning, as accuracy decreases significantly beyond three years.