Leadership teams often spend hours debating complex decisions, only to leave meetings without clarity or consensus. Different functions prioritize different outcomes: cost, speed, security, or long-term value, making alignment difficult as deadlines approach.
These situations stall progress not because of a lack of expertise, but because many teams lack a structured way to evaluate options objectively. Decision matrices address this gap by replacing opinion-driven debate with a clear, criteria-based framework.
In the sections below, this article explores what decision matrices are, when they work best, and how to build them effectively. It also breaks down five common matrix types, real-world examples from portfolio management, and practical guidance to avoid common mistakes when evaluating complex choices.
Key takeaways
Structured decision-making reduces ambiguity and helps teams move forward with confidence, especially when multiple stakeholders and competing priorities are involved. The following takeaways highlight how decision matrices support clearer, more defensible choices across business contexts.
- Decision matrices replace subjective debate with objective evaluation: they translate complex choices into measurable criteria, making trade-offs explicit and decisions easier to justify.
- Effective matrices focus on a limited set of high-impact criteria: using four to eight well-defined factors prevents over-engineering while capturing what truly differentiates options.
- Weighting criteria forces alignment on real business priorities: assigning importance upfront surfaces strategic trade-offs and reduces misalignment before scoring begins.
- Different matrix types suit different decision contexts: weighted scoring, Pugh matrices, and risk-reward grids each address distinct needs, from portfolio prioritization to innovation planning.
- Connecting decision frameworks to execution platforms like monday work management strengthens outcomes: dynamic matrices tied to workflows help teams turn decisions into action and track results over time.
A decision matrix is a structured framework that helps you compare multiple options against specific criteria to make objective, data-driven choices as part of your decision-making process. It turns complex decisions into a scoring system where you rate each option, weight what matters most, and calculate which choice best fits your goals.
The framework is a grid with options as rows and evaluation criteria as columns. Each criterion gets a weight based on its importance to your strategic objectives. You then score how well each option meets each criterion, multiply by the weights, and sum the results to identify the strongest choice.
To build an effective matrix, you need to understand its core components. Each element serves a specific purpose in turning subjective opinions into an objective evaluation. The following components work together to create a complete and defensible analysis:
- Options (alternatives): the specific choices you’re evaluating, such as software vendors, project proposals, or marketing strategies.
- Criteria (factors): the standards for judging each option, including cost, ROI, implementation time, or strategic fit.
- Weights (importance): numerical values showing each criterion’s priority relative to others.
- Scores (ratings): numbers indicating how well each option satisfies each requirement.
A decision matrix catches nuance that simple pros-and-cons lists miss. Not all advantages carry equal weight. A small cost saving might not offset a major security gap. This framework works best for complex decisions with multiple stakeholders, where transparency and buy-in matter as much as the final choice.
When should you use a decision matrix?
Decision matrices work best when choices are complex, resources are limited, and the wrong decision costs you big. They’re most useful in four scenarios where structured evaluation prevents costly mistakes and gets everyone on the same page.
Project selection and portfolio prioritization
Most organizations have more project ideas than people to execute them. A decision matrix evaluates competing proposals against criteria like ROI potential, resource needs, strategic fit, and risk levels. This ensures the projects you pick support business goals rather than personal favorites.
Consider a marketing team choosing between three campaign concepts. They evaluate each against target audience reach, budget efficiency, and brand alignment. The matrix makes your reasoning transparent, improving buy-in even when a stakeholder’s preferred project doesn’t make the cut.
Vendor and supplier evaluation
Vendor selection means balancing competing priorities. Cost versus quality. Speed versus reliability. A decision matrix standardizes this by comparing suppliers against consistent criteria like cost, SLAs, delivery reliability, and support quality. This cuts recency bias, that tendency to favor whoever pitched last.
IT teams selecting software vendors weigh technical capabilities, security compliance, integration requirements, and support quality. The matrix shows whether a vendor’s advanced features justify the higher price tag.
Strategic resource allocation
Leadership teams constantly decide how to split limited resources across competing initiatives. Matrices ensure you allocate resources based on capacity and strategic priorities.
An executive team distributing annual budgets uses a matrix to evaluate department requests against strategic impact, urgency, and expected returns. Resources go where they’ll create the most value, not to whoever got funding last year or has the loudest voice.
Cross-functional team decisions
When teams with different priorities need to agree, decision matrices offer neutral ground. Engineering prioritizes stability. Sales prioritizes speed. Product prioritizes features. The structured approach ensures you consider all perspectives and weight them appropriately.
Product development teams choosing feature priorities face competing demands. Engineering complexity clashes with customer demand. A matrix helps diverse teams find common ground by agreeing on criteria first. Once everyone accepts the math, the decision feels like a shared win, not a compromise.
Five types of decision matrices for business success
Different decisions require different levels of analysis. Matrix types range from simple grids to complex multi-criteria frameworks. Each works for different situations, helping you match the right approach to your decision.
| Matrix type | Best for | Key characteristic |
|---|---|---|
| Weighted scoring matrix | Decisions where criteria have unequal importance | Multiplies scores by weights for final ranking |
| Pugh matrix method | Comparing new concepts against current baseline | Uses +/−/0 ratings against reference solution |
| Eisenhower matrix | Prioritizing based on urgency and importance | 2x2 grid categorizing into four quadrants |
| Multi-criteria decision analysis (MCDA) | High-stakes decisions with statistical uncertainty | Incorporates sensitivity analysis and validation |
| Risk-reward decision grid | Balancing innovation potential against risk tolerance | Plots options by potential benefits versus risks |
Weighted scoring matrix
The weighted scoring matrix recognizes that criteria rarely matter equally. Stakeholders assign percentages or multipliers to each criterion. Raw scores get multiplied by criterion weights, then summed to produce final values.
This approach works when distinct priorities exist. When hiring executives, industry experience might carry 50% weight, technical skills 30%, and location only 20%. This ensures final rankings reflect reality: some factors are non-negotiable while others are nice to have.
Pugh matrix method
The Pugh matrix compares options against a baseline or reference solution, usually your current state. Instead of complex scoring, options are rated as better (+), worse (−), or the same (0) compared to the baseline for each criterion.
This method works best in engineering and process improvement when you’re upgrading existing solutions. When evaluating new software against legacy systems, the legacy system serves as baseline. The Pugh matrix quickly shows which options are real upgrades that won’t create new problems.
Eisenhower matrix for strategic decisions
The Eisenhower matrix is a 2×2 grid that evaluates options on urgency and importance. This categorizes initiatives into four quadrants:
- Do first: urgent and important.
- Schedule: important but not urgent.
- Delegate: urgent but not important.
- Delete: neither urgent nor important.
Leadership teams use this for quarterly planning to avoid the urgency trap. This framework helps them stop focusing entirely on immediate fires. As a result, they can dedicate attention to strategic work that drives long-term growth.
Multi-criteria decision analysis (MCDA)
MCDA uses complex weighting schemes, sensitivity analysis, and statistical validation. It works for decisions with many criteria, conflicting stakeholders, and lots of uncertainty.
This rigor is necessary for infrastructure investments, mergers and acquisitions, or major technology platform selections. While it requires specialized expertise, MCDA gives you the most defensible framework for decisions involving millions of dollars or heavy regulatory scrutiny.
Risk-reward decision grid
The risk-reward grid plots options on a 2×2 matrix based on potential benefits versus associated risks. Four quadrants help categorize initiatives:
- Quick wins: high reward/low risk.
- Strategic bets: high reward/high risk.
- Bread and butter: low reward/low risk.
- White elephants: low reward/high risk.
This approach suits investment decisions, market entry, or innovation projects. It helps teams balance portfolios, pursuing growth opportunities without exceeding risk tolerance or failure capacity.
How to build a decision matrix in seven steps?
Building an effective decision matrix follows a linear process that turns complex choices into manageable analysis. Skip steps, especially early definition phases, and you’ll hit analysis paralysis or get results stakeholders won’t accept. Each step builds on the last to create frameworks that drive confident decisions.
Step 1: define your decision goal
A specific decision statement prevents scope creep. Your goal must define exactly what you’re deciding, the constraints, and what success looks like. Vague goals produce vague criteria.
Examples of goal clarity:
- Weak goal: “choose a project management platform.”
- Strong goal: “select a project management platform supporting 50+ users, integrating with Salesforce, costing under $15,000 annually.”
Get stakeholders aligned on this goal before discussing criteria. If people don’t agree on objectives, your matrix will fail.
Step 2: list all decision options
Identify your comprehensive set of decision alternatives through brainstorming, market research, and stakeholder input. Include diverse alternatives, even ones that don’t seem great at first, to ensure fair comparison.
Three to seven options typically works best. Fewer limits choice. More creates cognitive overload and analysis paralysis. Options should be mutually exclusive (no overlap) and collectively exhaustive (cover all possibilities).
Step 3: establish evaluation criteria
Criteria are the standards for judging options. Make them specific, measurable, and directly related to your decision goal. Include both quantitative factors like cost and timeline, plus qualitative factors like user experience and vendor reputation.
Key guidelines for criteria selection:
- Use four to eight criteria: more creates complexity without adding value.
- Ensure independence: avoid double-counting similar factors.
- Make them measurable: each criterion needs scoring standards.
“Implementation speed” and “time to value” likely measure the same thing and should be combined.
Step 4: assign weight to each criterion
Weighting aligns your matrix with what actually matters to your organization. Percentage allocation works intuitively, with all weights totaling 100%. This forces trade-offs. If “cost” is 50%, then “quality” and “speed” must share the remaining 50%.
Assigning weights together reveals misaligned priorities you need to fix before scoring. These disagreements are actually useful, they surface problems early.
Step 5: score each option against criteria
Score each option against your criteria using a consistent scale, usually one to five or one to ten. Base scores on data whenever possible. Cost scores should reflect actual quotes, not estimates.
Standard scoring scale:
- 1: does not meet requirements.
- 3: meets basic requirements.
- 5: exceeds requirements significantly.
When you’re missing information, either pause to get data or agree on conservative estimates. Basing scores on objective data is essential for maintaining the integrity of the matrix.
Step 6: calculate weighted decision scores
Now convert your raw data into rankings. For each option, multiply the criterion score by that criterion’s weight. Sum these weighted values to create Total Weighted Scores.
The highest total score shows the best fit with your criteria. Accuracy matters here. Spreadsheet errors can lead to incorrect strategic choices.
Step 7: analyze results and document your decision
The highest score starts your final decision process, not ends it. Check whether results make sense. If the winner feels wrong, you probably missed a key criterion or got the weights wrong.
Final analysis steps:
- Sensitivity analysis: test “what if” scenarios with different weights.
- Sanity check: does the winner align with organizational intuition?
- Documentation: record rationale, assumptions, and methodology.
Document your rationale, assumptions, and the matrix itself, you’ll need them for future reference and team communication.
Say an operations team needs to pick two out of four improvement projects for next quarter because of budget and resource limits. Here’s how matrices turn strategic priorities into actual decisions.
The options:
- Customer portal upgrade: modernizing the client-facing interface.
- Inventory system: implementing new backend tracking solution.
- Training platform: launching new LMS for employees.
- Supply chain Ooptimization: consultant-led process review.
The criteria and weights:
- Strategic alignment (30%): supports annual growth goals.
- ROI potential (25%): financial return within 18 months.
- Implementation complexity (20%): technical difficulty (higher score = easier).
- Risk level (15%): probability of failure (higher score = lower risk).
- Stakeholder impact (10%): volume of people positively affected.
| Criteria (weight) | Portal upgrade | Inventory system | Training platform | Supply chain opt. |
|---|---|---|---|---|
| Strategy (30%) | 5 | 4 | 3 | 4 |
| ROI (25%) | 4 | 5 | 2 | 3 |
| Complexity (20%) | 2 | 3 | 5 | 3 |
| Risk (15%) | 3 | 3 | 5 | 2 |
| Impact (10%) | 5 | 3 | 4 | 2 |
| Total score | 3.85 | 3.80 | 3.55 | 3.25 |
The calculation (Portal Upgrade): (5×0.30) + (4×0.25) + (2×0.20) + (3×0.15) + (5×0.10) = 1.5 + 1.0 + 0.4 + 0.45 + 0.5 = 3.85
The team selects Customer Portal Upgrade and Inventory System. The Training Platform is low risk and easy to implement, but it doesn’t have enough strategic weight or ROI to beat the top two. This systematic approach gives you solid rationale that aligns with organizational priorities.
Three best practices for building a successful decision matrix
Even with solid frameworks, execution errors can kill your decision matrix. Knowing these traps helps you create analysis stakeholders trust and results that actually work. These pitfalls show up everywhere and can derail solid decision processes.
Over-engineering your criteria matrix
More criteria seems like it would help. But matrices with 15+ criteria, complex sub-weighting, and fractional scoring just create analysis paralysis. Over-engineering makes frameworks hard to use and hides what’s actually driving your decisions.
The solution: limit criteria to the “critical few,” typically four to eight factors truly differentiating options. If two criteria track similar attributes, combine them. The goal is precision, not mathematical perfection.
Missing key stakeholder perspectives
Build matrices in a silo and you’ll only get one viewpoint. If IT builds software selection matrices without end-user input from Sales or Marketing, criteria bias toward technical specs rather than usability. This ensures the final decision is practical and gains widespread adoption during implementation.
The solution: map affected stakeholder groups early. Involve representatives in criteria development and weighting phases. Decisions with diverse perspectives take longer to reach but implement way faster because you’ve already got buy-in.
Creating static instead of living decision frameworks
Teams often treat decision matrices as one-and-done documents. Once they save the spreadsheet, they rarely open it again. This static approach ignores changing business conditions, budgets get cut, strategy shifts, new information comes in.
The solution: treat matrices as living documents. Schedule regular reviews updating weights and scores as projects progress or market conditions change. Organizations using monday work management keep decision data dynamic by connecting matrices to project boards, so frameworks evolve with business needs.
Three powerful alternatives to traditional decision matrices
Decision matrices are versatile, but some situations need different approaches. These alternatives work well alongside matrices, especially when numerical scoring doesn’t cut it. Knowing when to use each method helps you pick the right approach.
SWOT analysis for strategic decisions
SWOT (Strengths, Weaknesses, Opportunities, Threats) examines internal capabilities against external market environments as part of strategic decision-making. Unlike quantitative decision matrices, SWOT provides qualitative strategic planning frameworks.
This method suits broad strategic planning or competitive analysis where variables resist easy quantification. Deciding whether to expand internationally requires holistic views of competitive landscapes (Threats) and internal readiness (Strengths) that numerical scores can’t fully capture.
Cost-benefit analysis for financial choices
Cost-benefit analysis (CBA) provides strictly financial evaluation. It sums total expected costs, subtracts them from total expected benefits, often adjusting for time value of money (Net Present Value).
CBA works for purely financial decisions like equipment purchases or real estate choices between leasing and buying. It provides precise financial models but struggles accounting for non-financial factors like employee morale or brand reputation.
Force field analysis for change management
Force field analysis evaluates “driving forces” supporting change against “restraining forces” resisting it. It assesses change feasibility rather than choosing between options.
This framework excels in change management contexts. If organizations consider restructuring, force field analysis identifies cultural resistance and implementation barriers that standard decision matrices might overlook. It highlights what needs managing for decisions to succeed.

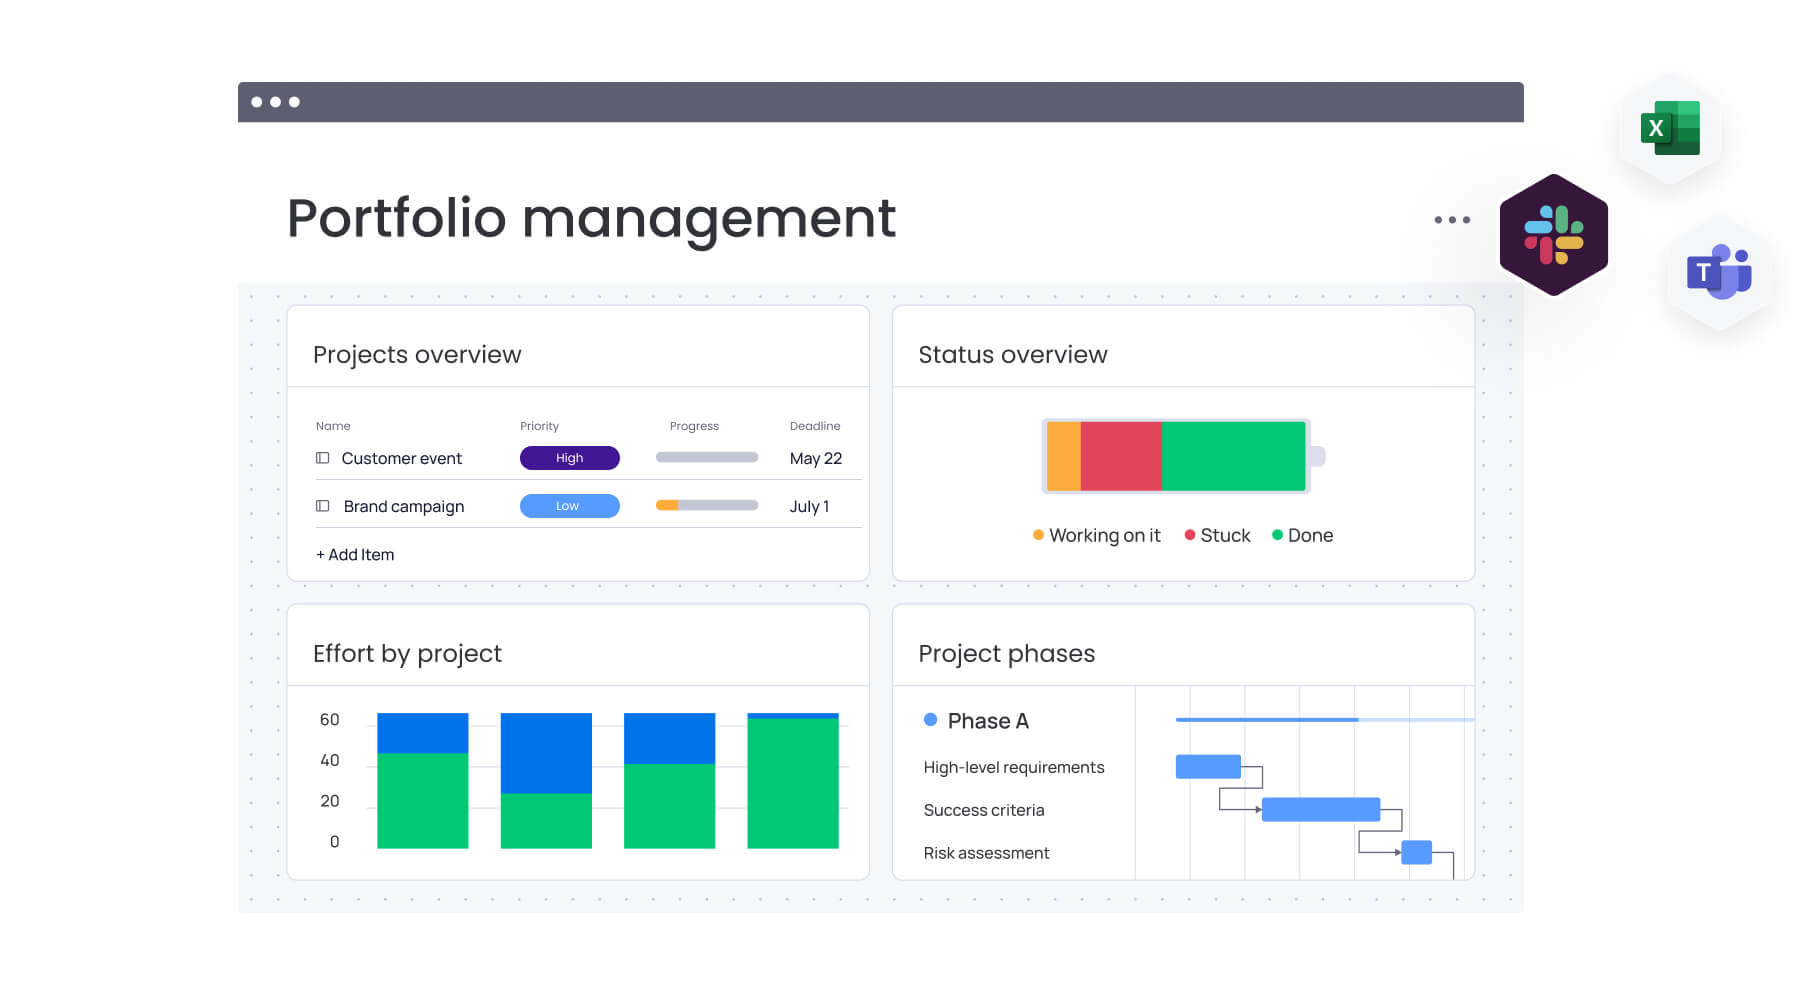
Traditional decision-making often stalls in static spreadsheets that become outdated the moment priorities shift. monday work management transforms decision matrices from one-time exercises into dynamic frameworks that adapt with your business, connecting strategic choices directly to operational execution.
The platform connects decision-making directly to execution. Once you select an option, monday work management automatically generates corresponding project boards, assigns teams, and populates task lists based on matrix data. This seamless continuity from decision to delivery eliminates the gap between choosing and doing.
Visual capabilities make complex trade-offs accessible to all stakeholders. Transform matrix data into dashboards showing weighted scoring visualizations, criteria comparison charts, and real-time sensitivity analysis. These visuals facilitate faster alignment during review meetings, helping diverse stakeholders understand implications quickly.
Key advantages of dynamic decision frameworks:
- Real-time collaboration: stakeholders score and weight criteria simultaneously.
- Automated workflows: route decisions for approval when thresholds are met.
- Outcome tracking: compare predicted scores against actual performance.
- Adaptive criteria: update weights as business priorities evolve.
Automation reduces administrative friction throughout the decision process. Workflows automatically notify stakeholders when input is needed, route decisions for executive approval once score thresholds are met, or trigger contract workflows when vendors are selected. Governance processes stay consistent without manual follow-up.
The true test of any decision is its outcome. Track actual performance of chosen options against original selection criteria. By comparing predicted ROI or timeline scores against actuals, teams create feedback loops that refine future evaluation criteria and improve organizational decision intelligence.
| Feature | Traditional spreadsheets | Other decision platforms | monday work management |
|---|---|---|---|
| Collaboration | Manual sharing, version conflicts | Limited real-time collaboration | Real-time collaborative scoring with stakeholder notifications |
| Implementation | No integration with execution | Separate from project management | Direct integration with project workflows and resource management |
| Automation | Manual calculations and updates | Basic automation features | Full workflow automation from scoring to implementation |
| Visualization | Basic charts and graphs | Static reporting | Dynamic dashboards with real-time decision insights |
| Adaptability | Static, requires manual updates | Limited flexibility | Dynamic matrices that adapt to new data automatically |
| Tracking | No outcome monitoring | Limited performance tracking | Complete decision lifecycle tracking with outcome validation |
“monday.com has been a life-changer. It gives us transparency, accountability, and a centralized place to manage projects across the globe".
Kendra Seier | Project Manager“monday.com is the link that holds our business together — connecting our support office and stores with the visibility to move fast, stay consistent, and understand the impact on revenue.”
Duncan McHugh | Chief Operations OfficerTransform decisions into strategic advantage
Leadership teams often struggle to move from evaluation to action. Decisions stall in spreadsheets, stakeholder alignment breaks down, and criteria lose relevance as priorities shift. Without a clear link between analysis and execution, even well-structured decision matrices fail to deliver impact.
Modern platforms like monday work management close this gap by connecting decision frameworks directly to daily workflows, ensuring that strategic choices translate into coordinated execution across teams.
- Centralized decision frameworks: evaluation criteria, weights, and scores stay visible and accessible in one shared workspace, reducing version conflicts and misalignment.
- Connected execution workflows: selected options automatically flow into project boards, timelines, and ownership structures, linking decisions to delivery.
- Real-time collaboration: stakeholders contribute scoring and feedback simultaneously, improving consensus and reducing approval delays.
- Dynamic visibility and tracking: dashboards surface trade-offs, progress, and outcomes, allowing teams to validate decisions against real results.
- Adaptive decision models: criteria and weights evolve as priorities change, keeping decisions aligned with business goals over time.
By embedding structured decision-making into everyday operations, teams gain faster alignment, clearer accountability, and stronger follow-through. The result is measurable efficiency, consistent execution, and strategic clarity, without adding complexity to how work gets done.
Frequently asked questions
What is the 10-10-10 rule for decisions?
The 10-10-10 rule for decisions is a framework that asks you to consider how you'll feel about a choice in 10 minutes, 10 months, and 10 years. This framework helps decision-makers gain perspective on long-term impact versus immediate emotional consequences.
What is another name for a decision matrix?
Decision matrices are frequently called weighted scoring models, grid analyses, selection matrices, or Pugh matrices when comparing options against a baseline.
How do you calculate scores in a weighted decision matrix?
To calculate scores in a weighted decision matrix, multiply each option's raw rating for a criterion by that criterion's weight, then sum these weighted values across all criteria for the Total Weighted Score.
Can decision matrices work for personal life decisions?
Decision matrices work effectively for significant personal choices like buying homes, choosing universities, or selecting career paths. They help articulate personal values and trade-offs systematically.
What is the difference between a decision matrix and a RACI matrix?
A decision matrix evaluates and selects options based on criteria, while a RACI matrix defines roles and responsibilities (responsible, accountable, consulted, informed) for project tasks.
How many criteria should a decision matrix include?
Most effective decision matrices use between four and eight criteria. Fewer than four may overlook critical factors, while more than eight adds unnecessary complexity.