
Your forecast shows $2.4M from existing customers this quarter, but what if you could spot the accounts at risk of churning before they disappear from your revenue projections? Customer attrition analysis identifies warning signs 60-90 days early, transforming forecasting from hopeful assumptions into risk-adjusted projections based on real account health.
You’ll learn which metrics drive forecast accuracy, how to recognize early warning signals, and how to turn scattered customer data into predictable revenue projections. This guide shows you how to calculate meaningful attrition rates, build automated monitoring systems, and create forecasts you can confidently present to leadership.
Key takeaways
- Identify at-risk customers 60-90 days before they churn instead of discovering losses after quarterly reviews when it’s too late to act.
- Apply historical attrition rates and current risk signals to present realistic revenue projections with best, likely, and worst-case scenarios.
- Monitor engagement declines, support interaction spikes, and sentiment shifts to spot customer drift before cancellation decisions happen.
- Allocate executive attention to enterprise customers with multiple warning signals while automating outreach for lower-value at-risk accounts.
- Automatically detect sentiment in communications, surface at-risk accounts in real-time dashboards, and trigger intervention workflows when warning signals emerge with monday CRM.
What is customer attrition analysis?

Customer attrition analysis shows you why customers leave and when they’re likely to churn. It turns scattered departure data into predictable patterns you can act on.
Think of it as the difference between discovering customers left last quarter versus knowing who’s drifting away right now. One tells you what happened. The other lets you intervene while relationships are still salvageable.
Revenue teams use attrition analysis to answer three critical questions:
- Who’s leaving? Identify specific accounts at risk.
- When do they start drifting? Spot early warning signals.
- Why does it happen? Understand root causes.
Without these answers, forecasts assume all current customers will stay forever. That assumption means missed targets and uncomfortable conversations with leadership.
Why customer attrition analysis transforms revenue predictability

Revenue predictability requires understanding both acquisition and retention. Most organizations track new pipeline obsessively while treating existing customers as a stable baseline. This creates consistent forecast errors.
Consider the math: If existing customers generate $2M monthly and you assume that continues unchanged, you’re ignoring the 5-8% who will leave each quarter. That’s $100K-$160K in phantom revenue that won’t materialize.
Attrition analysis gives you the loss rate that makes projections realistic. Instead of forecasting $6M quarterly from existing customers, you apply expected attrition: $6M minus 6% expected churn equals $5.64M. That $360K difference is the gap between wishful thinking and defensible forecasts.
How to shift from reactive tracking to predictive intelligence
Most revenue teams track churn after it happens — compiling quarterly reports that explain losses but offer no path to prevention. Predictive attrition analysis flips this approach. Instead of learning which customers left last quarter, you identify accounts at risk right now and intervene before cancellation decisions happen. This shift transforms churn tracking from a post-mortem exercise into a proactive revenue protection system.
Step 1: Identify real-time churn risk signals
Traditional churn tracking works like a rearview mirror. You compile quarterly reports showing which customers left, calculate lost revenue, and explain why projections missed the mark. By then, the damage is done and intervention windows have closed.
Predictive attrition analysis changes everything. Instead of learning 15 customers churned last quarter, you spot 12 of them showing risk 60 days early. The difference? Time to act.
Here’s what separates basic tracking from predictive intelligence:
| Aspect | Basic tracking | Predictive intelligence |
|---|---|---|
| Timing | 90-day delay | Real-time signals |
| Data type | Historical metrics | Forward-looking indicators |
| Action window | None (post-mortem) | 60-90 days before churn |
| Focus | What happened | What will happen |
Revenue teams using predictive analysis catch declining engagement, support ticket spikes, and payment issues the moment they happen.
Step 2: Calculate the compound cost of unexpected customer loss
When customers churn unexpectedly, these costs pile up:
| Cost category | Impact | Financial effect |
|---|---|---|
| Direct revenue loss | Immediate gap in monthly/annual revenue | -$50K per churned account |
| Replacement costs | 5–7x more expensive to acquire new customers (Source: Bain & Company) | $12K–$18K acquisition cost |
| Operational disruption | Teams redirect from planned activities | Lost productivity across departments |
A single $50K account churning unexpectedly means finding $50K in new business just to maintain status quo. Factor in acquisition costs, onboarding time, and ramp-up periods, and that replacement customer delivers only $27K-$35K in first-year value.
For leadership, unexpected churn makes it impossible to allocate resources. Hiring plans, marketing budgets, and product investments all depend on revenue projections. When projections miss because of unaccounted attrition, every decision that follows suffers.

Step 3: Build forecast confidence through risk adjustment
Accurate forecasting means ditching single-point estimates for risk-adjusted ranges. CROs need to report upward with confidence intervals, not just hopeful numbers.
Risk-adjusted forecasting follows this framework:
- Baseline forecast: Current customer revenue projected forward
- Risk tier analysis: Segment customers by churn probability
- Expected loss calculation: Apply historical save rates to at-risk segments
- Confidence range: Present best, likely, and worst-case scenarios
Accurate attrition analysis means tracking specific metrics that show current health and future risk. No single metric tells the whole story, but together they show you when to intervene and how to forecast realistically.
Customer attrition rate calculations
The basic attrition rate formula is straightforward:
(Customers Lost During Period ÷ Customers at Start of Period) × 100
If you started the month with 500 customers and lost 25, your monthly attrition rate is 5%.
This baseline metric is the foundation for revenue projections. A consistent 5% monthly attrition means forecasts should assume approximately 5% customer loss each month. For a customer base generating $1M monthly, that’s $50K in expected revenue erosion.
Common calculation mistakes kill accuracy:
- Using end-of-period counts: Dividing by period-end customers inflates the rate
- Mixing time periods: Comparing monthly to annual rates without conversion
- Ignoring segmentation: Blending enterprise and SMB rates obscures insights
Revenue churn vs. logo churn
These metrics measure different parts of customer loss — both matter for forecasting:
- Logo churn: Measuring percentage of customers leaving, logo churn is used as a relationship health indicator.
- Revenue churn: Measuring percentage of revenue lost, revenue churn is used for direct forecast adjustment.
Consider this scenario: You lose 10 customers from 100 total (10% logo churn), but those customers represent only $100K of $2M total revenue (5% revenue churn). This pattern indicates small customers are leaving while large accounts remain stable.
The opposite pattern is a red flag. If 3% logo churn accompanies 12% revenue churn, your largest customers are departing. The customer count looks healthy, but revenue erodes rapidly.
Net revenue retention forecasting
Net Revenue Retention (NRR) tracks all revenue changes in existing customers — losses from churn, gains from expansions, and reductions from downgrades.
The formula:
((Starting MRR + Expansion MRR – Churned MRR – Contraction MRR) ÷ Starting MRR) × 100
An NRR above 100% means your existing customer base grows in value without new acquisitions. Below 100% signals erosion requiring new customer acquisition to maintain revenue levels.
NRR directly impacts forecast assumptions:
- 120%+ NRR: Existing customers drive significant growth
- 100-120% NRR: Stable base with modest expansion
- 90-100% NRR: Churn exceeds expansion
- Below 90% NRR: Urgent retention focus required
5 early warning signals that predict revenue changes
Predictive attrition analysis identifies specific behaviors that signal churn risk before customers leave. These signals give revenue teams time to intervene and adjust forecasts based on current risk. Understanding these patterns turns reactive reporting into proactive revenue protection.
1. Engagement pattern shifts
Measurable changes in product interaction usually happen 60-90 days before churn. Watch for these specific indicators:
- Login frequency decline: Daily users becoming weekly visitors
- Feature usage reduction: Active features dropping from 8 to 3
- Session duration decrease: Time in product falling from 45 to 10 minutes
- Email engagement drop: Open rates declining from 45% to 15%
When 20% of your customer base shows engagement decline, and historical data shows 40% of disengaged customers churn within 90 days, forecast an additional 8% of customers at elevated risk.
2. Support interaction frequency changes
Support patterns show customer frustration or disengagement before they complain:
| Pattern | Signal strength | Churn probability |
|---|---|---|
| Support spike (3x average) | High urgency | 50% within 60 days |
| Support silence after regular contact | Medium concern | 35% within 90 days |
| Repeated unresolved tickets | Critical | 60% within 45 days |
3. Product usage decline indicators
Beyond general engagement, specific usage patterns predict churn:
- Core feature abandonment: Customers stop using primary value drivers
- Workflow incompletion: Starting but not finishing key processes
- Integration disconnection: Removing connections to other tools
- Data export increases: Preparing to migrate elsewhere
These objective signals remove guesswork from forecasting — they’re concrete evidence that account health is declining.
4. Contract and commercial signals
Certain commercial behaviors signal churn risk even without customers mentioning cancellation:
- Downgrade requests: Revenue reduction often precedes full churn
- Payment method changes: Switching from annual to monthly billing
- Renewal inquiry timing: Questions arriving earlier than normal
- Stakeholder changes: New decision-makers reviewing contracts
Each signal means different risk levels and timelines for your forecast.
5. Communication sentiment changes
The tone and frequency of customer communications show dissatisfaction before they complain. Monitor these indicators:
- Response delays: Increasing time between interactions
- Shorter messages: Communications becoming terse or formal
- Negative language patterns: Frustration creeping into emails
- Escalation requests: Asking to speak with management
Calculate customer attrition rate for predictive power
Basic attrition calculations give you snapshots, but real predictive power comes from analyzing patterns across time periods, customer segments, and value tiers. This deeper analysis shows seasonal trends, cohort behaviors, and segment-specific risks that single metrics miss.
Monthly versus annual formulas
Monthly and annual attrition rates serve different forecasting purposes:
Monthly attrition rate= (Customers Lost in Month ÷ Customers at Month Start) × 100
This metric spots immediate trends and lets you intervene quickly. Use it for operational decisions and short-term forecasts.
Annual attrition rate= (Customers Lost in Year ÷ Customers at Year Start) × 100
This gives you strategic planning baselines and year-over-year comparisons.
Critical conversion note: Annual rate doesn’t equal monthly rate times 12. The relationship is exponential because churned customers exit the calculation base. With 3% monthly attrition, the correct annual rate is 30.6%, not 36%. That 5.4 percentage point difference represents significant forecast error.
Cohort analysis for seasonal patterns
Grouping customers by acquisition date shows retention patterns that affect forecasting:
| Acquisition cohort | Month 1 retention | Month 6 retention | Month 12 retention |
|---|---|---|---|
| Q1 2026 | 95% | 78% | 65% |
| Q2 2026 | 92% | 70% | 58% |
| Q3 2026 | 94% | 75% | 62% |
| Q4 2026 | 96% | 82% | 72% |
This data shows Q4 customers stick around way better than Q2 acquisitions. Year-end budget decisions might drive more strategic purchases, while mid-year buyers could be experimenting. Apply different attrition assumptions to each cohort for accurate projections.
Value-based segmentation methods
Not all attrition affects forecasts equally. Segment by customer value to see your real revenue risk:
- Enterprise (>$100K): 3% attrition but 60% of revenue
- Mid-market ($10K-$100K): 7% attrition and 30% of revenue
- SMB (<$10K): 15% attrition but only 10% of revenue
Using a blended 8% rate hides how stable enterprise accounts are and how vulnerable SMB customers are. Segment-specific rates produce more accurate forecasts and highlight where to focus retention efforts.
Understanding voluntary vs. involuntary churn impact
Voluntary churn is when customers decide to leave. Involuntary churn happens through payment failures or administrative issues — not because customers want to leave. This distinction matters because each type has different predictability and prevention strategies that affect forecast accuracy.
Controllable factors in forecasting
Voluntary churn comes from controllable factors you can influence:
- Product satisfaction: Usage patterns predict satisfaction-based departures.
- Customer success engagement: Regular touchpoints reduce voluntary exits.
- Market competition: Changes influence switching decisions.
- Value realization: Achieving outcomes encourages longer retention.
When building projections, voluntary churn rates can improve with retention investments. If historical voluntary churn runs 6% monthly but you’re implementing new success programs, forecasting 5% reflects expected improvement.
Payment failures and technical churn
Involuntary churn follows predictable patterns:
| Business type | Typical involuntary rate | Primary causes |
|---|---|---|
| B2B SaaS | 1–2% monthly | Card expiration, corporate changes |
| B2C subscription | 2–4% monthly | Insufficient funds, expired cards |
| High-ticket B2B | <1% monthly | Invoice payment, stable methods |
To reduce involuntary churn: Automate payment retry logic, send proactive expiration notifications, and offer multiple payment methods. Since involuntary churn is predictable, forecast it separately with tighter confidence intervals. This often represents 20-40% of total churn but requires different intervention strategies than voluntary departures.
7 steps to build predictive attrition analysis
This roadmap takes revenue teams from basic tracking to predictive analysis that creates accurate forecasts. Each step builds on the last, creating an approach that turns scattered data into insights you can act on.
Step 1: Unify customer data sources
Predictive analysis means bringing data from multiple systems into one place. Start by identifying your data sources:
- CRM activity: Emails, calls, meetings, notes
- Product usage: Login frequency, feature adoption
- Support interactions: Ticket volume, resolution time
- Financial data: Payment status, invoice history
- Contract information: Renewal dates, terms
Step 2: Define churn definitions precisely
“Churn” needs clear, consistent definition across your organization. Document these criteria:
- Churned customer: Contract expired without renewal AND no activity for 30+ days
- Voluntary churn: Cancellation initiated by customer request
- Involuntary churn: Cancellation from payment failure after 3 attempts
- At-risk customer: Showing 2+ warning signals from your indicator list
Consistent definitions mean everyone reads the data the same way and forecasts align across teams.
Step 3: Map historical patterns
Understanding your historical churn patterns gives you forecast baselines. Analyze:
- Time patterns: Monthly rates, seasonal variations, cohort differences
- Segment patterns: Attrition by value tier, industry, use case
- Behavioral patterns: Common actions preceding churn
If historical data shows 5% baseline monthly attrition with Q1 running 7% and Q3 at 4%, apply these seasonal adjustments to projections.
Step 4: Establish risk scoring criteria
Risk scoring turns multiple signals into metrics you can act on. Create your scoring framework:
| Signal | Weight | Trigger condition |
|---|---|---|
| Login decline >40% | 25 points | Month-over-month |
| Support tickets >2x average | 20 points | 30-day rolling average |
| Feature usage drop >30% | 25 points | Month-over-month |
| Contract inquiry | 15 points | Past 90 days |
| Negative sentiment | 15 points | AI detection flag |
Step 5: Build automated monitoring
Manual monitoring doesn’t scale. Automate these components:
- Data collection: Sync usage data to customer records automatically
- Alert generation: Trigger notifications when scores cross thresholds
- Task creation: Assign follow-ups based on risk level
- Dashboard updates: Refresh risk views in real-time
Automation means no at-risk account slips through and intervention happens consistently.
Step 6: Create intervention playbooks
Detection only matters if teams know how to respond. Track save rates by intervention type to refine playbooks over time. Build playbooks by risk level:
| Risk level | Response time | Owner | Actions |
|---|---|---|---|
| Critical | 24 hours | Sales director | Executive call, retention offer |
| High | 48 hours | Senior AM | Discovery call, success plan |
| Medium | 5 days | Account manager | Check-in, usage review |
Step 7: Integrate predictions into forecasts
Connect attrition predictions to revenue forecasting:
- Start with baseline customer revenue.
- Apply historical attrition rates.
- Adjust for seasonal patterns.
- Layer current at-risk account data.
- Calculate confidence ranges.
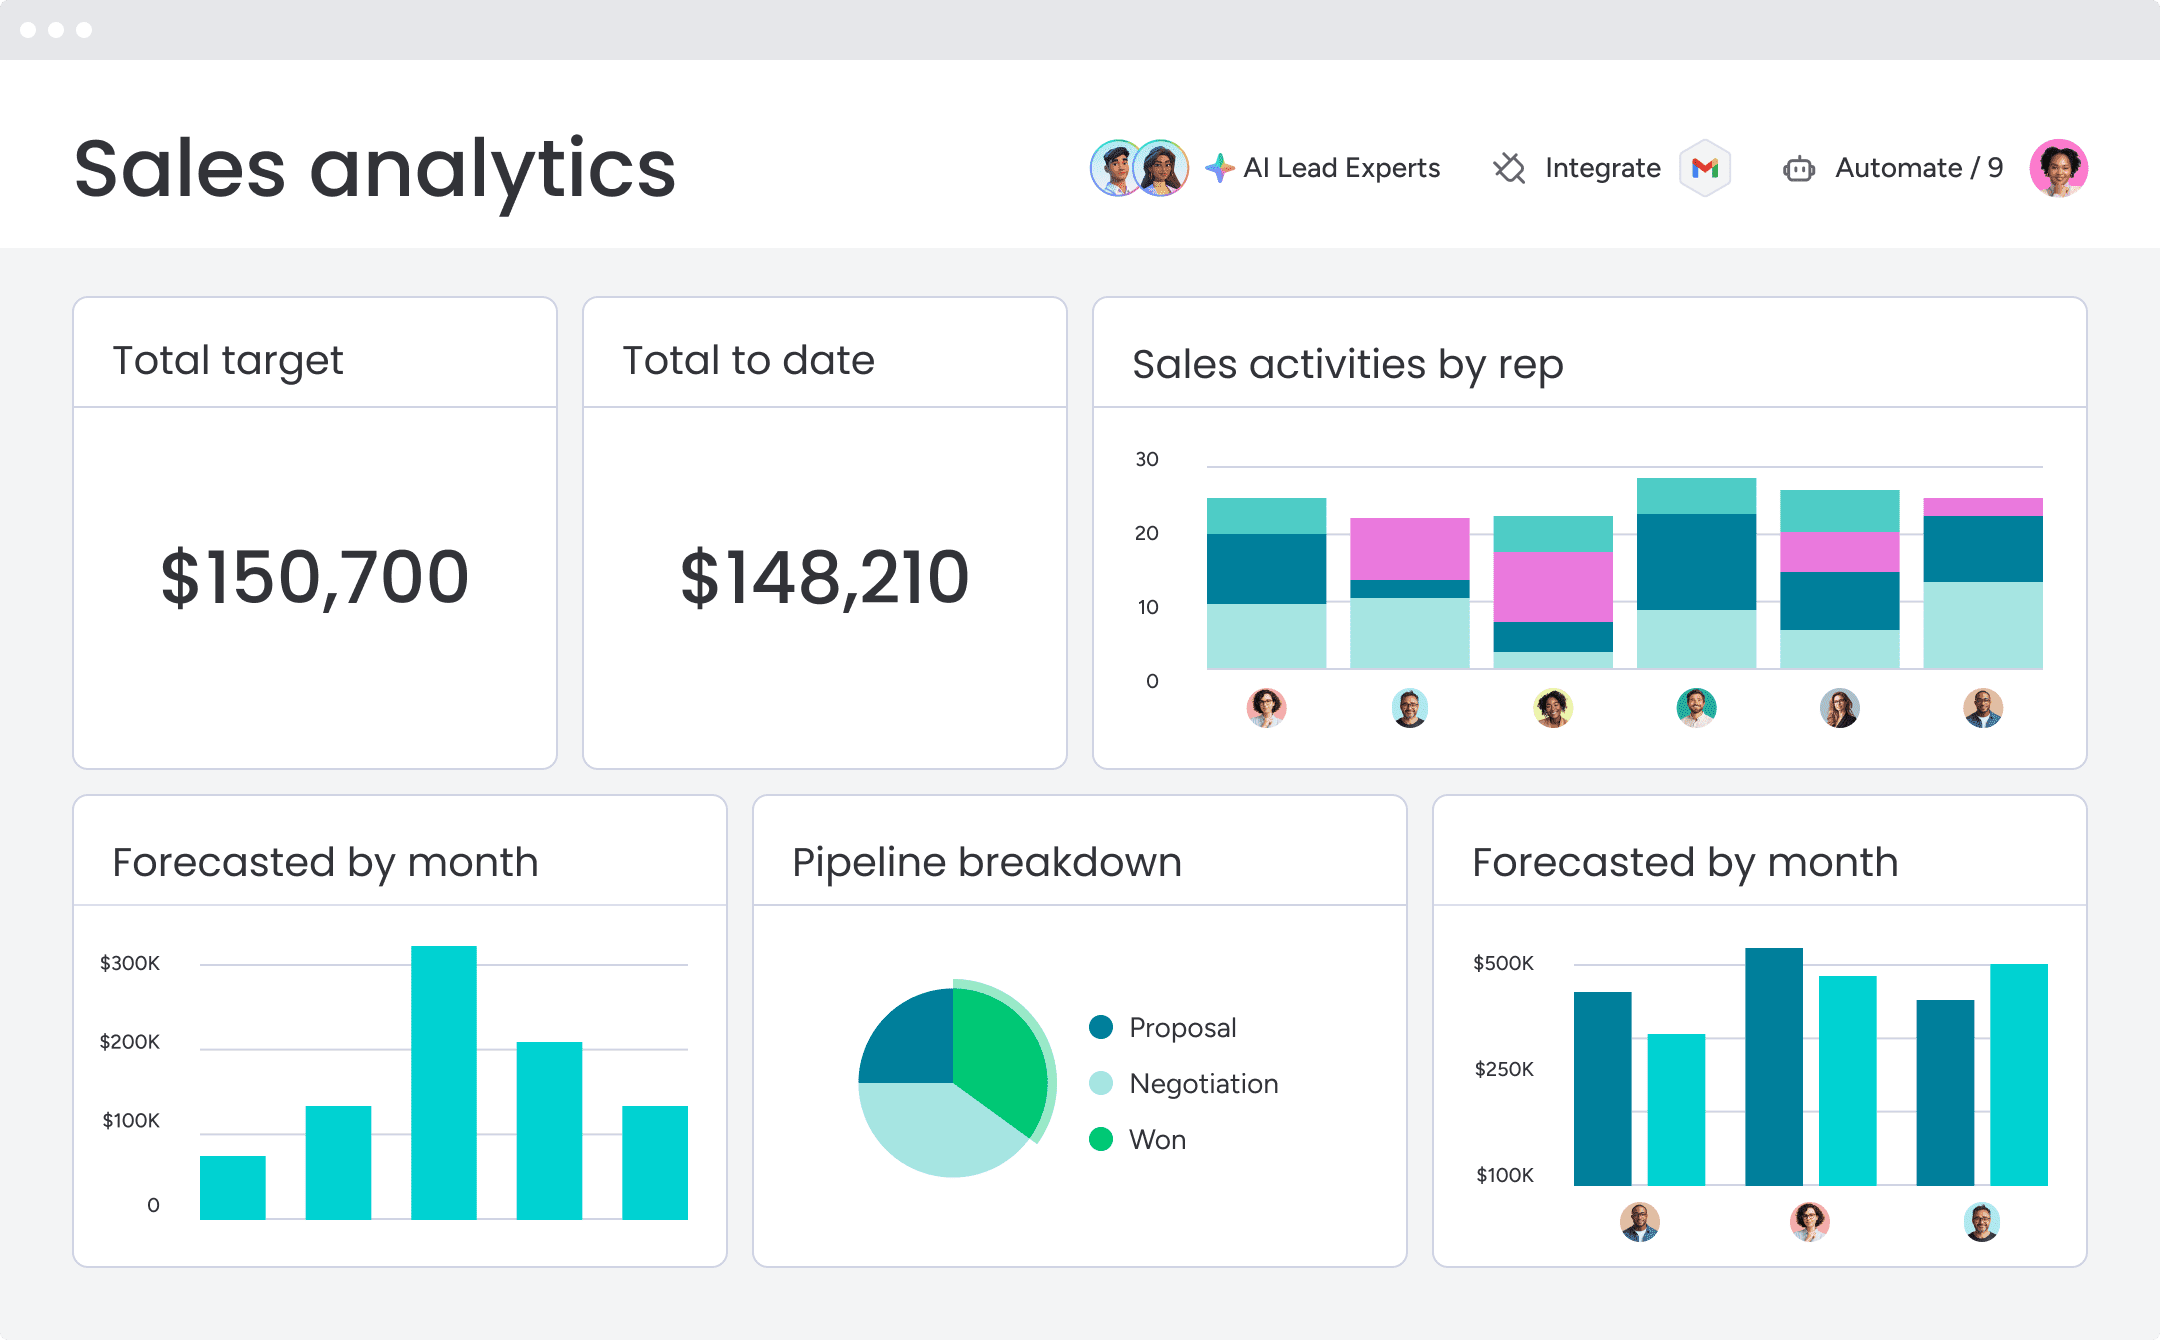
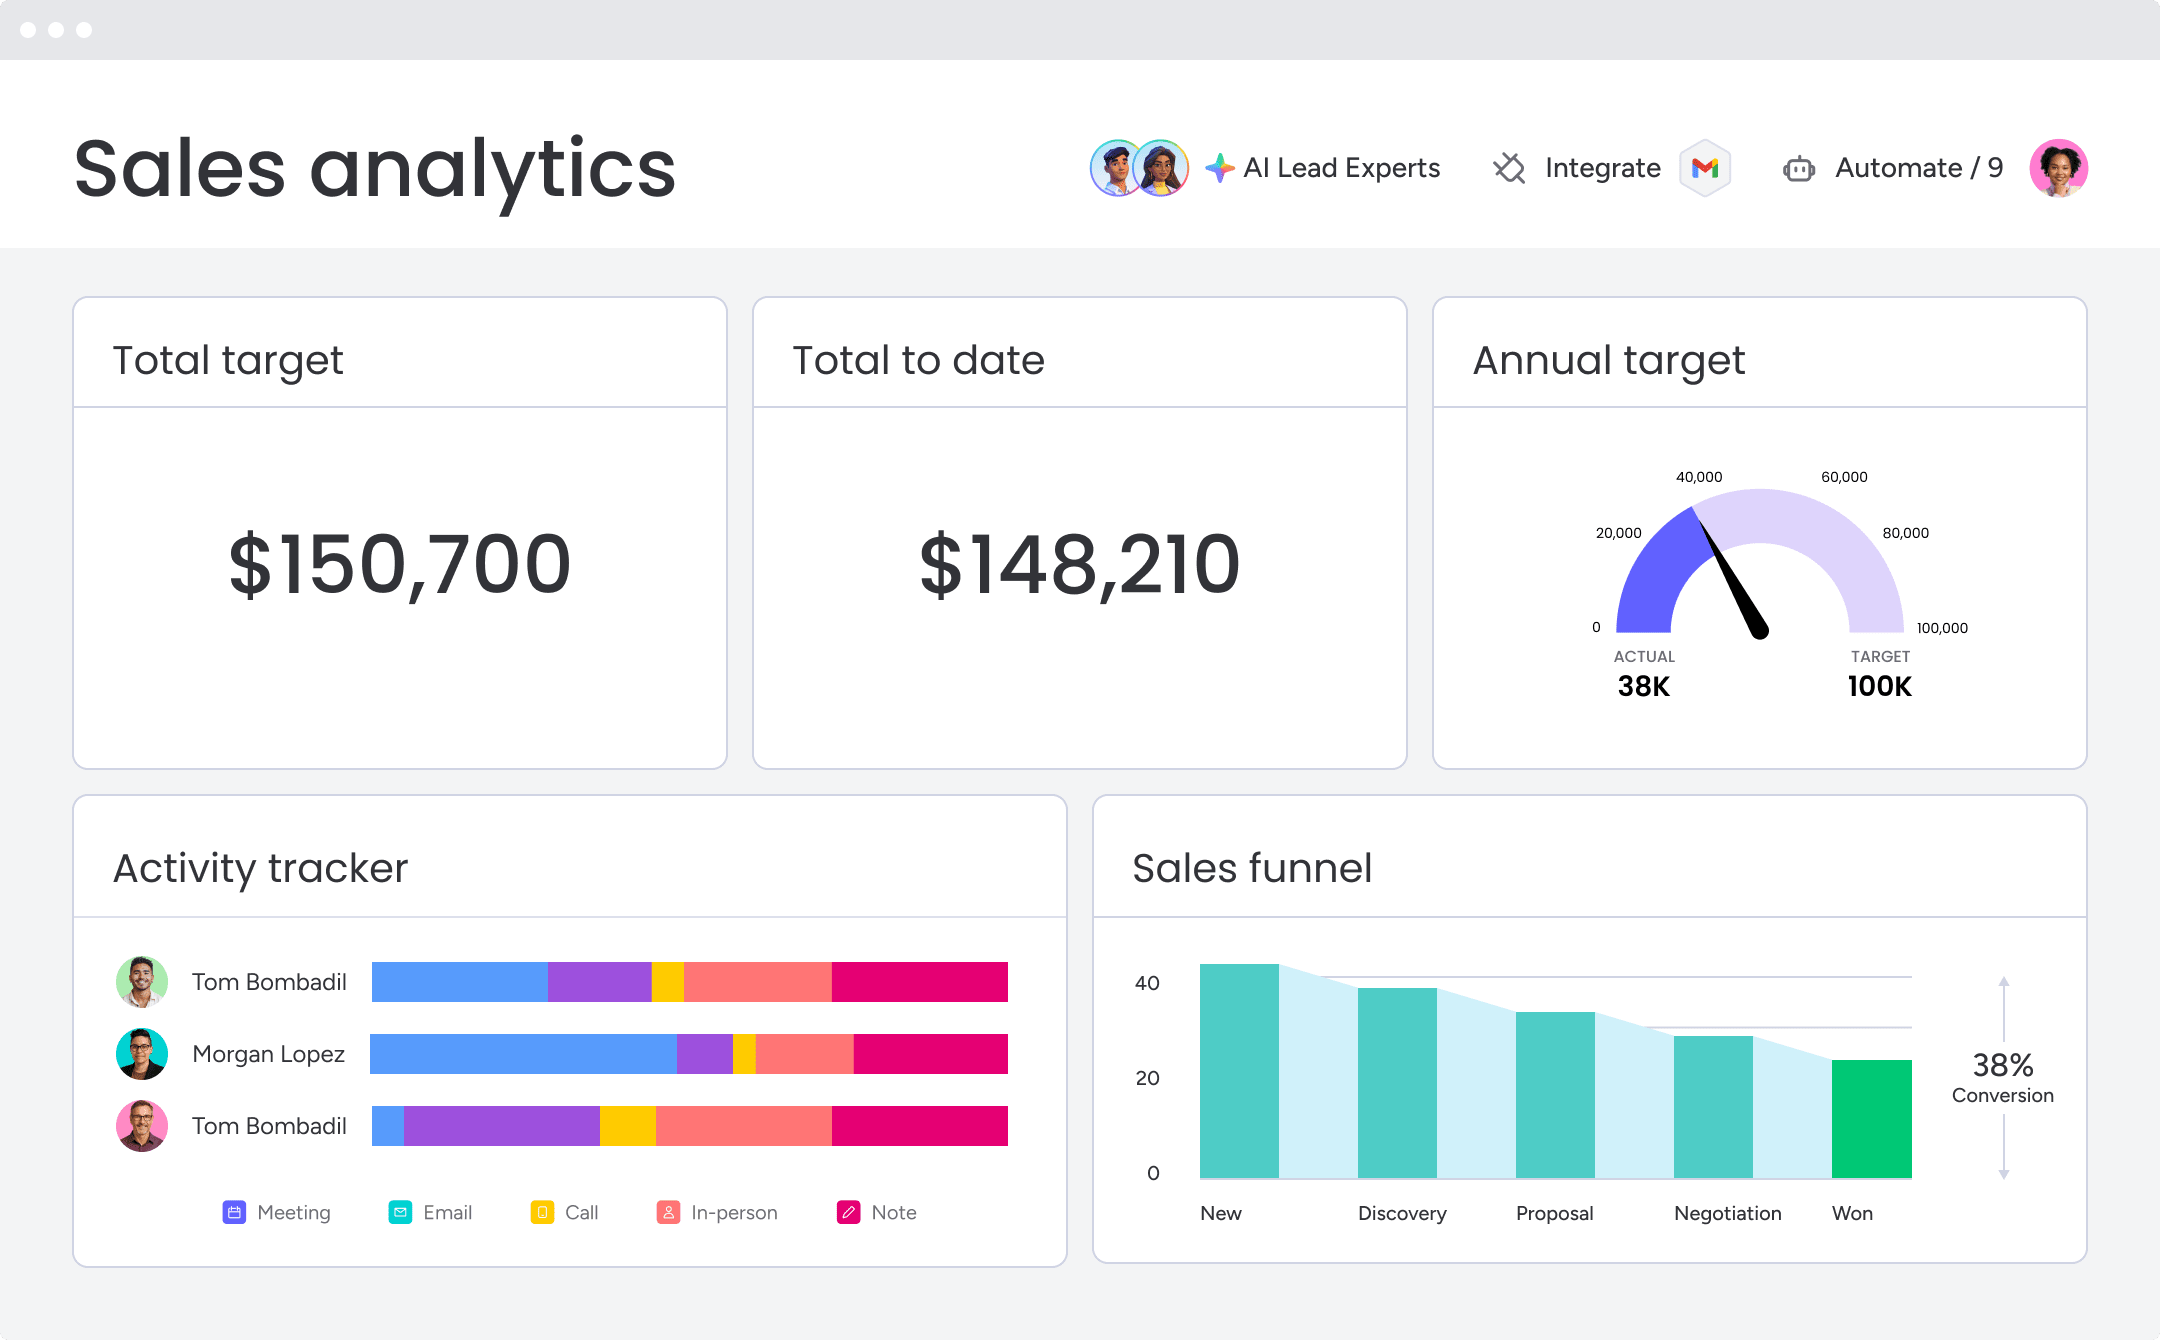
monday CRM’s reporting capabilities display these components together, showing at-risk accounts alongside revenue projections for complete forecast visibility.
Turn attrition insights into revenue confidence with monday CRM
Customer attrition analysis gets powerful when it moves from spreadsheets to execution. monday CRM turns scattered customer signals into actionable insights with features built specifically for revenue teams who need to identify risk early and protect existing revenue.

Here’s how monday CRM helps you build predictive attrition analysis:
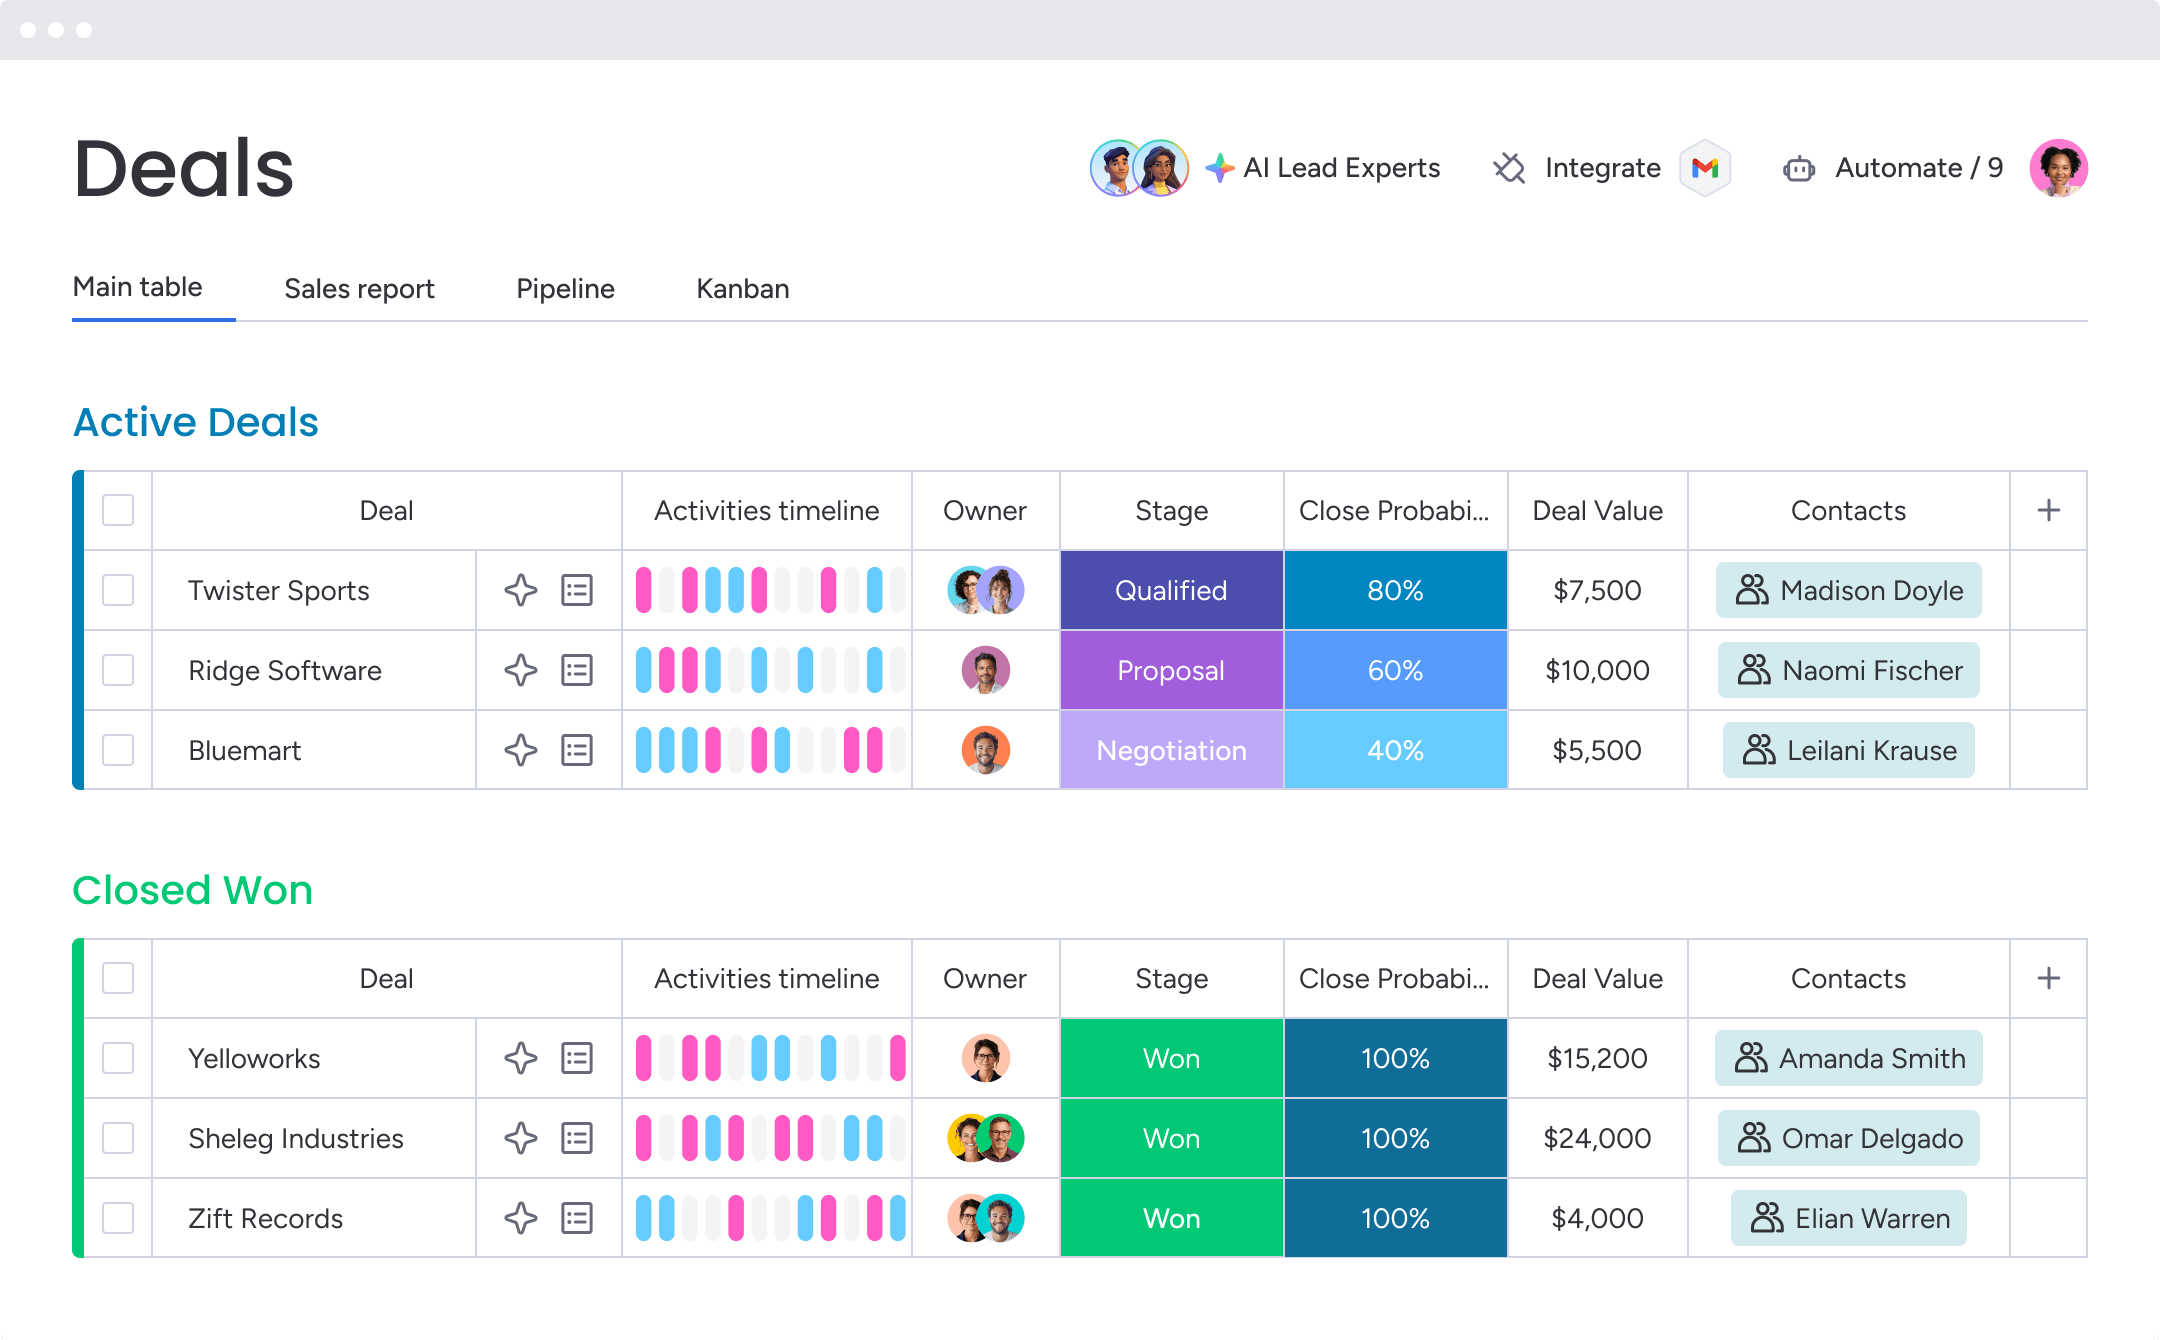
- Centralized account management: Brings emails, support tickets, usage data, and billing information into one place so insights stay current instead of outdated by the time you compile them
- Emails & Activities timeline: Automatically captures every customer interaction without manual data entry
- AI-powered Extract information: Pulls key details from contracts and documents directly into board columns
- Detect sentiment: Automatically analyzes communications to assign sentiment scores, turning subjective observations into reportable metrics
- Assign labels and summarizes: Categorizes churn reasons consistently using AI-powered classifications, condenses long threads into actionable summaries, and creates instant overviews of account history
- Real-time alerts: Triggers notifications when engagement drops, support escalates, payments fail, or sentiment shifts negative
- Custom dashboards: Shows at-risk accounts by value tier, renewal date, and owner so teams focus on the right accounts at the right time
- Sales forecasting features: Combines pipeline data, churn risk indicators, and revenue projections in one view for risk-adjusted forecasting with confidence ranges
The teams that master the shift from reactive reporting to predictive intelligence gain real competitive advantages. monday CRM connects risk identification directly to action — so you can predict who will leave, adjust forecasts accordingly, and intervene while relationships remain salvageable.
“With monday CRM, we’re finally able to adapt the platform to our needs — not the other way around. It gives us the flexibility to work smarter, cut costs, save time, and scale with confidence.”
Samuel Lobao | Contract Administrator & Special Projects, Strategix“Now we have a lot less data, but it’s quality data. That change allows us to use AI confidently, without second-guessing the outputs.”
Elizabeth Gerbel | CEO“Without monday CRM, we’d be chasing updates and fixing errors. Now we’re focused on growing the program — not just keeping up with it."
Quentin Williams | Head of Dropship, Freedom Furniture“There’s probably about a 70% increase in efficiency in regards to the admin tasks that were removed and automated, which is a huge win for us.“
Kyle Dorman | Department Manager - Operations, Ray White"monday CRM helps us make sure the right people have immediate visibility into the information they need so we're not wasting time."
Luca Pope | Global Client Solutions Manager at Black Mountain“In a couple of weeks, all of the team members were using monday CRM fully. The automations and the many integrations, make monday CRM the best CRM in the market right now.”
Nuno Godinho | CIO at VelvTurn attrition insights into forecast confidence
Customer attrition analysis transforms how revenue teams forecast and protect existing revenue. By identifying at-risk accounts 60-90 days early, monitoring engagement patterns and support signals, and applying risk-adjusted projections, you shift from reactive reporting to proactive revenue protection. The difference between missing targets and delivering predictable results comes down to spotting customer drift before cancellation decisions happen.
With monday CRM you can centralize customer signals, automate risk detection, and connects attrition insights directly to revenue forecasts. Stop compiling quarterly churn reports that explain what already happened — start building real-time dashboards that show which accounts need attention right now.
Try monday CRMFAQs
What is the difference between customer attrition and customer churn?
Customer attrition and customer churn are often used interchangeably to describe customers leaving. Some organizations distinguish attrition as gradual decline versus churn as sudden departure, but for practical forecasting, both terms measure the same outcome: lost customers and revenue.
How do you calculate customer attrition rate?
Calculate customer attrition rate by dividing customers lost during a period by customers at the start of that period, then multiply by 100. For example: (25 lost customers ÷ 500 starting customers) × 100 = 5% attrition rate.
What is a good customer attrition rate for SaaS companies?
A good attrition rate varies by business model and customer segment. B2B SaaS companies with annual contracts typically see monthly logo churn below 1% (10-12% annually) as healthy, while SMB-focused companies often experience higher rates.
How far in advance can you predict customer churn?
Predictive attrition analysis typically identifies at-risk customers 60-90 days before actual churn. Engagement declines, usage pattern changes, and support interactions often surface 2-3 months before cancellation decisions.
What data do you need for customer attrition analysis?
Effective attrition analysis requires CRM activity data, product usage metrics, support interaction history, billing and payment data, and contract information. The most predictive models combine behavioral, relationship, and financial data sources.
How do you reduce customer attrition rate?
Reduce attrition by addressing both voluntary and involuntary churn. For voluntary churn, improve onboarding, implement proactive success programs, and monitor usage patterns. For involuntary churn, automate payment retry logic and send proactive card expiration notifications.