
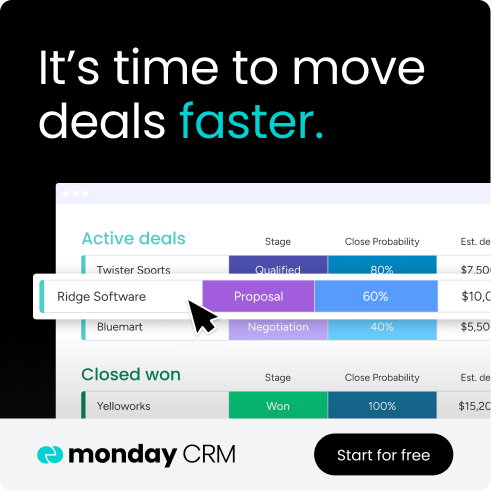
What if you could transform your CRM data into clear, actionable insights that predict revenue outcomes with confidence? CRM reporting turns scattered customer and sales data into visual dashboards that show exactly where deals stand, which reps need support, and whether you’re on track to hit your numbers.
This guide covers the essential CRM reports every revenue team needs, how to implement reporting without technical headaches, and how AI-powered platforms make reporting smarter in 2026. You’ll discover practical strategies to launch CRM reporting that delivers real business impact and drives consistent pipeline growth.
Try monday CRMKey takeaways
- Real-time pipeline visibility lets you track deal progression, spot bottlenecks early, and make adjustments while there’s still time to hit your targets.
- Seven essential reports drive consistent revenue growth: pipeline health, sales forecasting, conversion tracking, activity monitoring, win-loss analysis, revenue attribution, and team performance scorecards.
- AI transforms reporting from backward-looking to predictive with deal probability scores, natural language queries, and automated insights that spot patterns humans miss in your sales data.
- Clean data foundation makes or breaks reporting accuracy, so standardize naming conventions, eliminate duplicates, and automate data collection to ensure reports reflect reality, not garbage data.
- Build custom reports with drag-and-drop tools, get AI-powered insights automatically, and scale reporting as your team grows without IT support using monday CRM.
What is CRM reporting?
CRM reporting transforms raw customer and sales data into visual reports and actionable insights. It takes scattered information about deals, contacts, and activities and turns them into charts, dashboards, and metrics that show what’s happening in your sales org.
Think about it: Without CRM reporting, you’re flying blind. You don’t know if you’ll hit targets until the quarter ends. Your team operates on gut feelings instead of data. CRM reporting replaces that chaos with real-time visibility into pipeline health, sales performance, conversion rates, and revenue forecasts.
CRM reporting has 4 core components that turn information overload into decisions:
- Data aggregation: Pulls information from emails, calls, meetings, and deal updates into one unified view, eliminating manual compilation from different sources
- Visualization: Transforms numbers into charts and graphs that communicate instantly, like pipeline funnels showing deal progression at a glance
- Analysis: Surfaces patterns and correlations that would take hours to discover manually, such as which lead sources produce the highest-value deals
- Distribution: Delivers insights automatically through scheduled reports and proactive alerts, so stakeholders get information when they need it
CRM reports vs. CRM dashboards
The terms “CRM reports” and “CRM dashboards” get used interchangeably, but they serve different purposes. Although the best teams use both reports and dashboards, knowing the difference helps you pick the right format:
| Aspect | CRM reports | CRM dashboards |
|---|---|---|
| Purpose | Detailed analysis of specific metrics or time periods | Real-time overview of key performance indicators |
| Format | Static documents with detailed data tables and charts | Interactive visual displays with live data |
| Best for | Historical analysis, compliance documentation, and detailed performance reviews | Monitoring current state, identifying immediate issues, and providing at-a-glance status updates |
| Customization | Highly customizable with filters and date ranges | Pre-configured with key metrics |
| Distribution | Scheduled delivery via email or generated on-demand | Always accessible via shared screens |
| Data freshness | Point-in-time snapshot when generated | Continuously updated as data changes |
Why your pipeline depends on CRM reporting
Your pipeline depends on CRM reporting because visibility determines whether you hit your numbers or miss them. Organizations without real-time pipeline insight make decisions based on incomplete information, miss warning signs until deals are lost, and struggle to explain performance to leadership.
In contrast, organizations leveraging AI-powered reporting capabilities are seeing measurable results, with 66% of organizations using generative AI in marketing and sales reporting revenue increases.
Accurate sales forecasting becomes predictable
Sales forecasting without CRM reporting relies on rep estimates and manager intuition. When forecasts miss the mark, finance can’t plan budgets. Leadership can’t set realistic expectations.
CRM reporting fixes this by analyzing win rates by deal stage, average sales cycle length, and seasonal trends to project future revenue. If deals in the proposal stage historically close at 45% and your current pipeline shows $2M in proposals, the weighted forecast reflects that reality.
CRM reporting enables critical business impacts:
- Budget planning: Finance teams allocate resources based on reliable revenue projections
- Hiring decisions: Leadership knows when to expand teams based on projected capacity needs
- Investor confidence: Board presentations include data-backed forecasts with historical accuracy
- Resource allocation: Marketing spend aligns with realistic revenue expectations
Real-time pipeline visibility eliminates surprises

Discovering pipeline problems weeks after they started limits recovery options. CRM reporting provides continuous monitoring that surfaces issues while there’s still time to act.
Real-time visibility covers your entire revenue team:
- Deal stage analysis: Identifying where prospects consistently drop off reveals process problems that need fixing
- Rep activity tracking: Seeing who’s engaging prospects actively enables targeted coaching before performance gaps widen
- Pipeline coverage: Knowing whether there’s enough pipeline to hit quarterly targets prevents end-of-quarter scrambles
- Velocity monitoring: Tracking how quickly deals move through stages highlights whether the current pipeline will close in time
Data-driven decisions replace guesswork
Without CRM reporting, teams make decisions based on anecdotal evidence and whoever speaks loudest in meetings. The rep who closed a big deal last month gets outsized influence on strategy.
CRM reporting enables critical decisions across your revenue organization:
- Territory optimization: Reassigning accounts based on win rate data by region
- Product positioning: Focusing on offerings with highest conversion rates
- Sales process refinement: Adjusting stages based on where deals typically stall
- Coaching focus: Targeting training based on activity and outcome correlations
Team performance becomes measurable and improvable
When you manage sales teams without objective performance data, reviews become subjective conversations. CRM reporting transforms performance assessment into a metric-based process that identifies both top performers worth emulating and those needing support.
The platform tracks specific metrics that reveal not just outcomes, but the behaviors driving success:
- Activity levels: Call volume, email outreach, and meeting frequency
- Conversion rates: Success at each stage of the sales process
- Deal characteristics: Average deal size and sales cycle length
- Quota attainment: Progress toward individual and team targets
Here’s how performance data drives action:
- Identifying best practices: Analyzing what top performers do differently creates a playbook for the entire team
- Targeted coaching: Focusing development efforts where data shows gaps ensures coaching addresses actual problems
- Fair compensation: Basing commissions on objective metrics removes favoritism and builds trust
- Capacity planning: Understanding realistic quotas based on historical performance prevents demoralization
7 essential CRM reports that drive revenue growth
Your CRM holds the potential for hundreds of reports, but only a handful truly move the revenue needle. These 7 essential reports form the foundation of data-driven sales management — each one addresses a critical question that directly impacts your ability to forecast accurately, coach effectively, and close consistently.
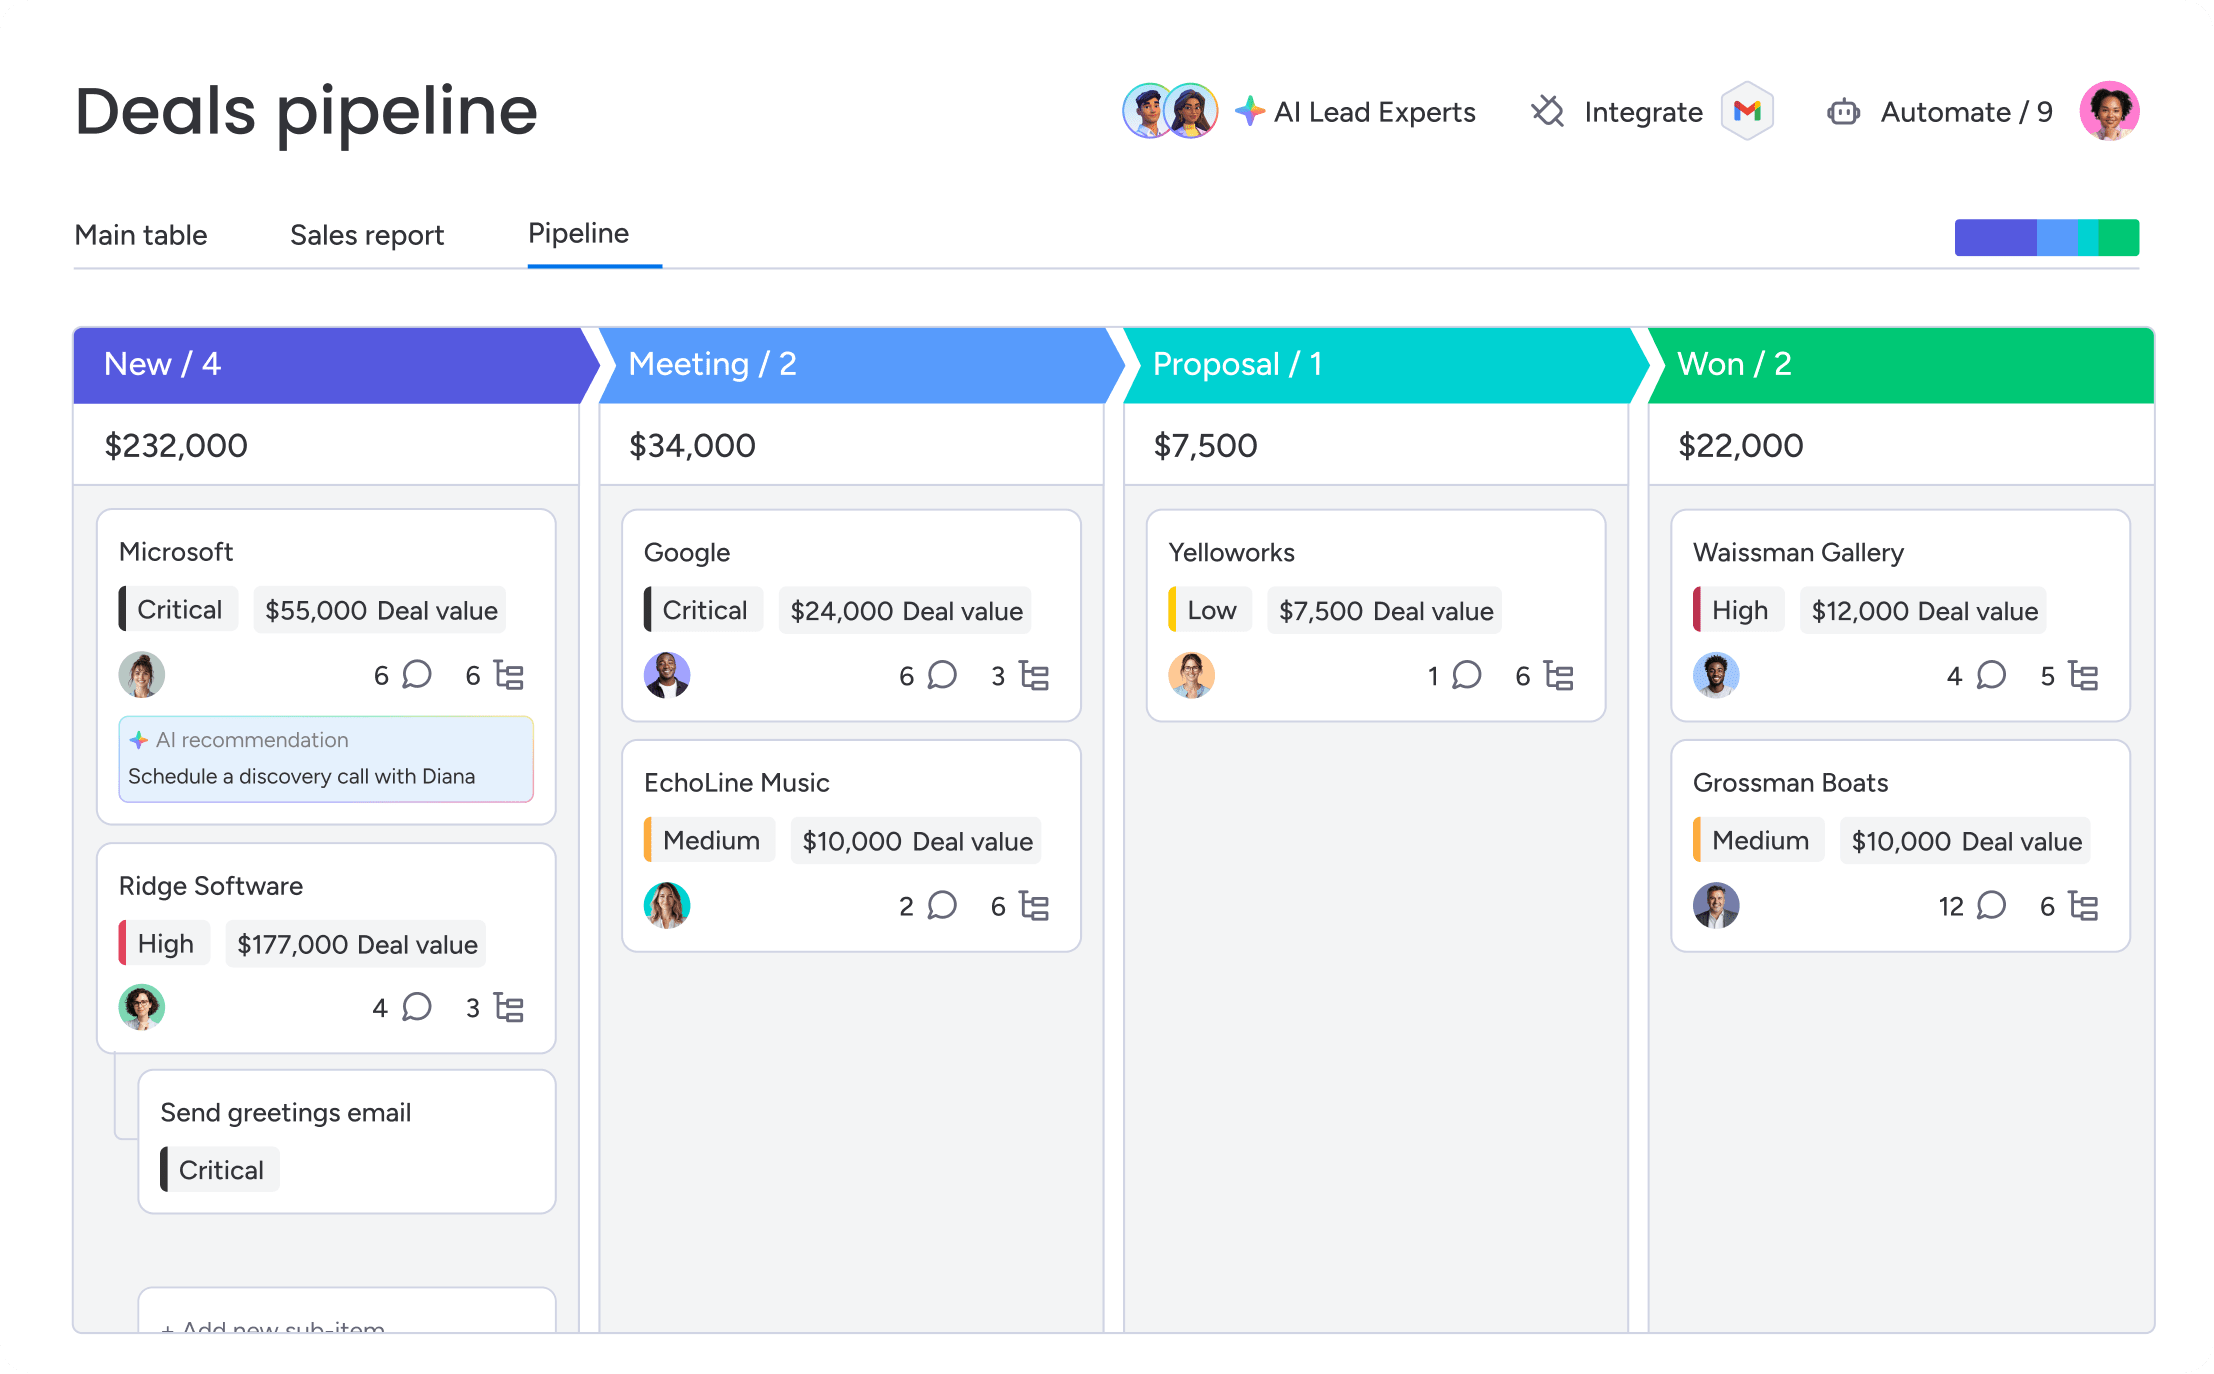
1. Pipeline health report
The pipeline health report provides a comprehensive view of all active opportunities, their stages, values, and probability of closing. It answers the question every revenue leader asks: “Are we going to hit our number?”
Key metrics this report tracks include:
- Total pipeline value: The sum of all active opportunities, which should typically be 3-4x your target for predictable results
- Pipeline by stage: Distribution of deals across the sales process reveals whether pipeline is front-loaded or back-loaded
- Weighted pipeline: Realistic revenue projection based on stage probabilities
- Pipeline coverage ratio: The relationship between pipeline value and target
2. Sales forecast report
The sales forecast report projects expected revenue based on current pipeline and historical close rates. It combines pipeline data with probability calculations to predict future outcomes.
Key forecast components include:
- Commit forecast: Deals reps are confident will close this period
- Best case scenario: All probable deals plus potential upside
- Most likely outcome: Weighted projection based on historical patterns
- Historical accuracy: How past forecasts compared to actual results
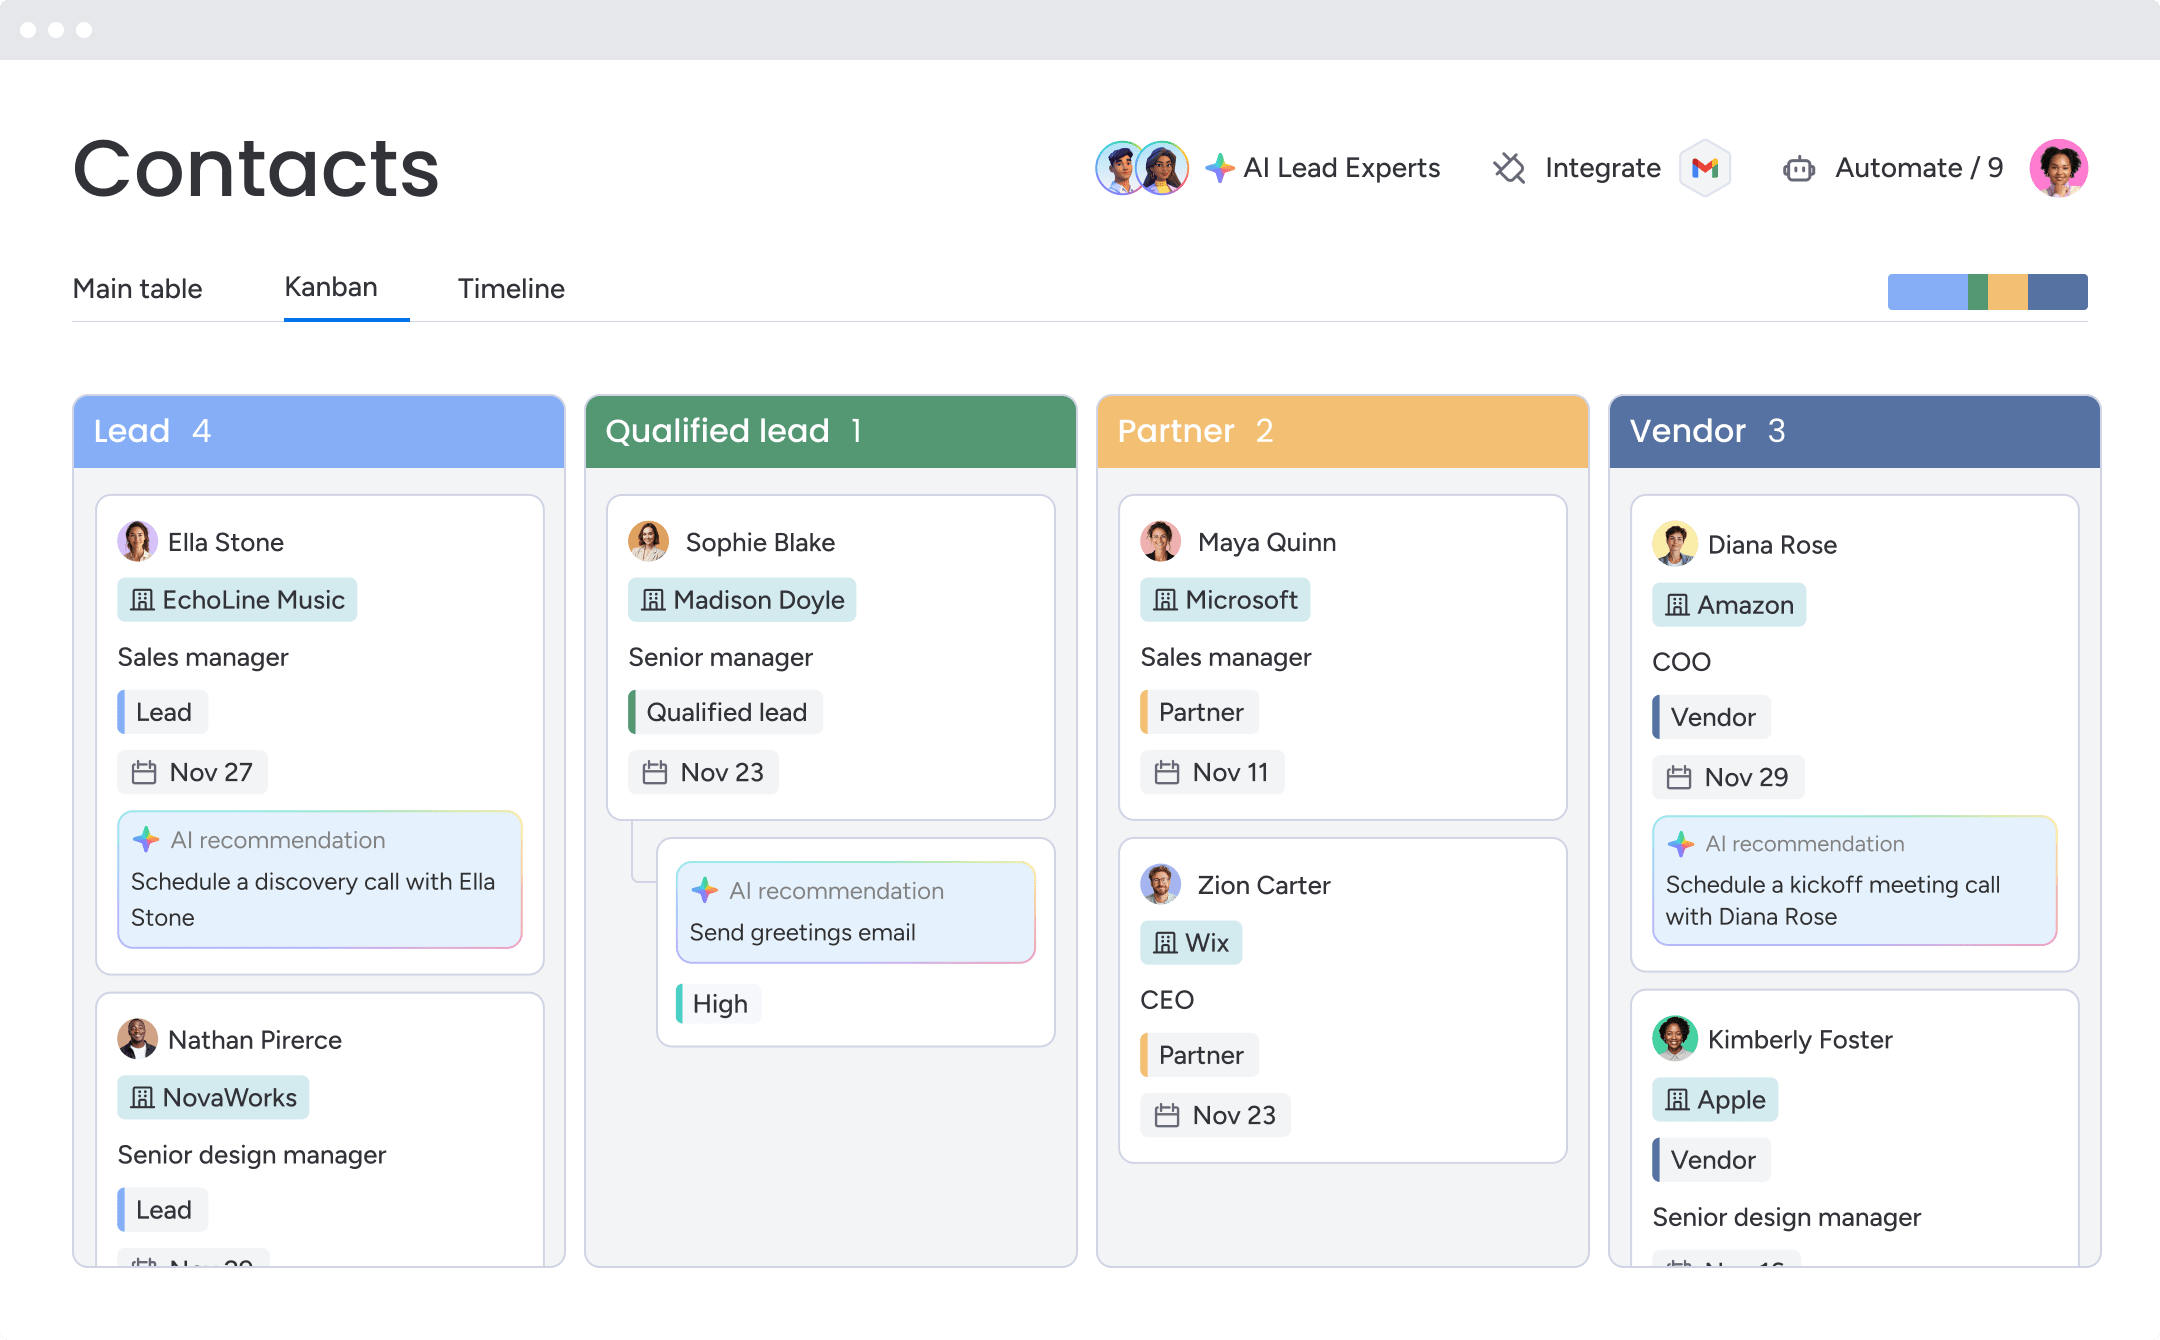
3. Lead-to-customer conversion report
This report tracks leads from first touch to closed deal, showing conversion rates at each stage. It reveals where prospects drop off and which sources produce the best results.
Conversion metrics to monitor include:
- Lead to qualified opportunity: Shows marketing effectiveness
- Opportunity to proposal: Reveals qualification quality
- Proposal to closed-won: Indicates closing effectiveness
- Conversion by source: Identifies highest-performing channels
4. Sales activity tracking report
The sales activity tracking report monitors the quantity and quality of sales activities performed by each rep. It shows which activities actually close deals.
Key activity types to track include:
- Outbound calls and emails: Prospecting effort levels and consistency
- Meetings scheduled and completed: Engagement success and calendar management
- Proposals sent: Deal advancement actions and pipeline progression
- Follow-up cadence: Persistence and consistency in nurturing deals
5. Win-loss analysis report
The win-loss analysis report examines closed opportunities to understand why deals succeed or fail. It captures why deals win or lose, turning individual outcomes into lessons for the whole team.
Critical insights include:
- Loss reasons: Common factors leading to deal failure
- Win factors: Characteristics of successful opportunities
- Competitor analysis: Who you’re losing to and why
- Deal patterns: Traits that predict success or failure
6. Revenue attribution report
The revenue attribution report tracks which marketing channels, campaigns, and touchpoints contribute to closed revenue. It shows which marketing dollars actually drive revenue.
Attribution models vary based on what you’re trying to understand:
- First-touch attribution: Shows awareness channels
- Last-touch attribution: Reveals closing channels
- Multi-touch attribution: Provides comprehensive view of influence across the customer journey
7. Team performance scorecard
The team performance scorecard provides a comprehensive view of individual and team performance against quotas, activities, and key metrics.
Here are some team performance indicators:
- Quota attainment percentage: Progress toward revenue targets
- Activity metrics: Comparison to expected levels
- Pipeline generation: Future business creation
- Conversion rates: Success at each stage
How CRM reporting transforms raw data into insights
CRM reporting isn’t just about displaying data. It turns raw numbers into strategic intelligence through a process that separates signal from noise. Here’s what that looks like:
Automatically collect data from multiple sources
Sales data lives everywhere: emails in Gmail or Outlook, meetings in calendars, calls in phone systems, marketing engagement in automation platforms, and deal updates entered manually into the CRM Manually aggregating this data takes forever, and by the time you’re done, it’s already outdated.
Modern CRM systems automatically pull data from these key sources:
- Email platforms: Interaction history, response rates, communication frequency
- Calendar systems: Meeting frequency, attendance, scheduling patterns
- Communication tools: Call logs, duration, outcomes
- Marketing automation: Lead source, campaign engagement, content interaction
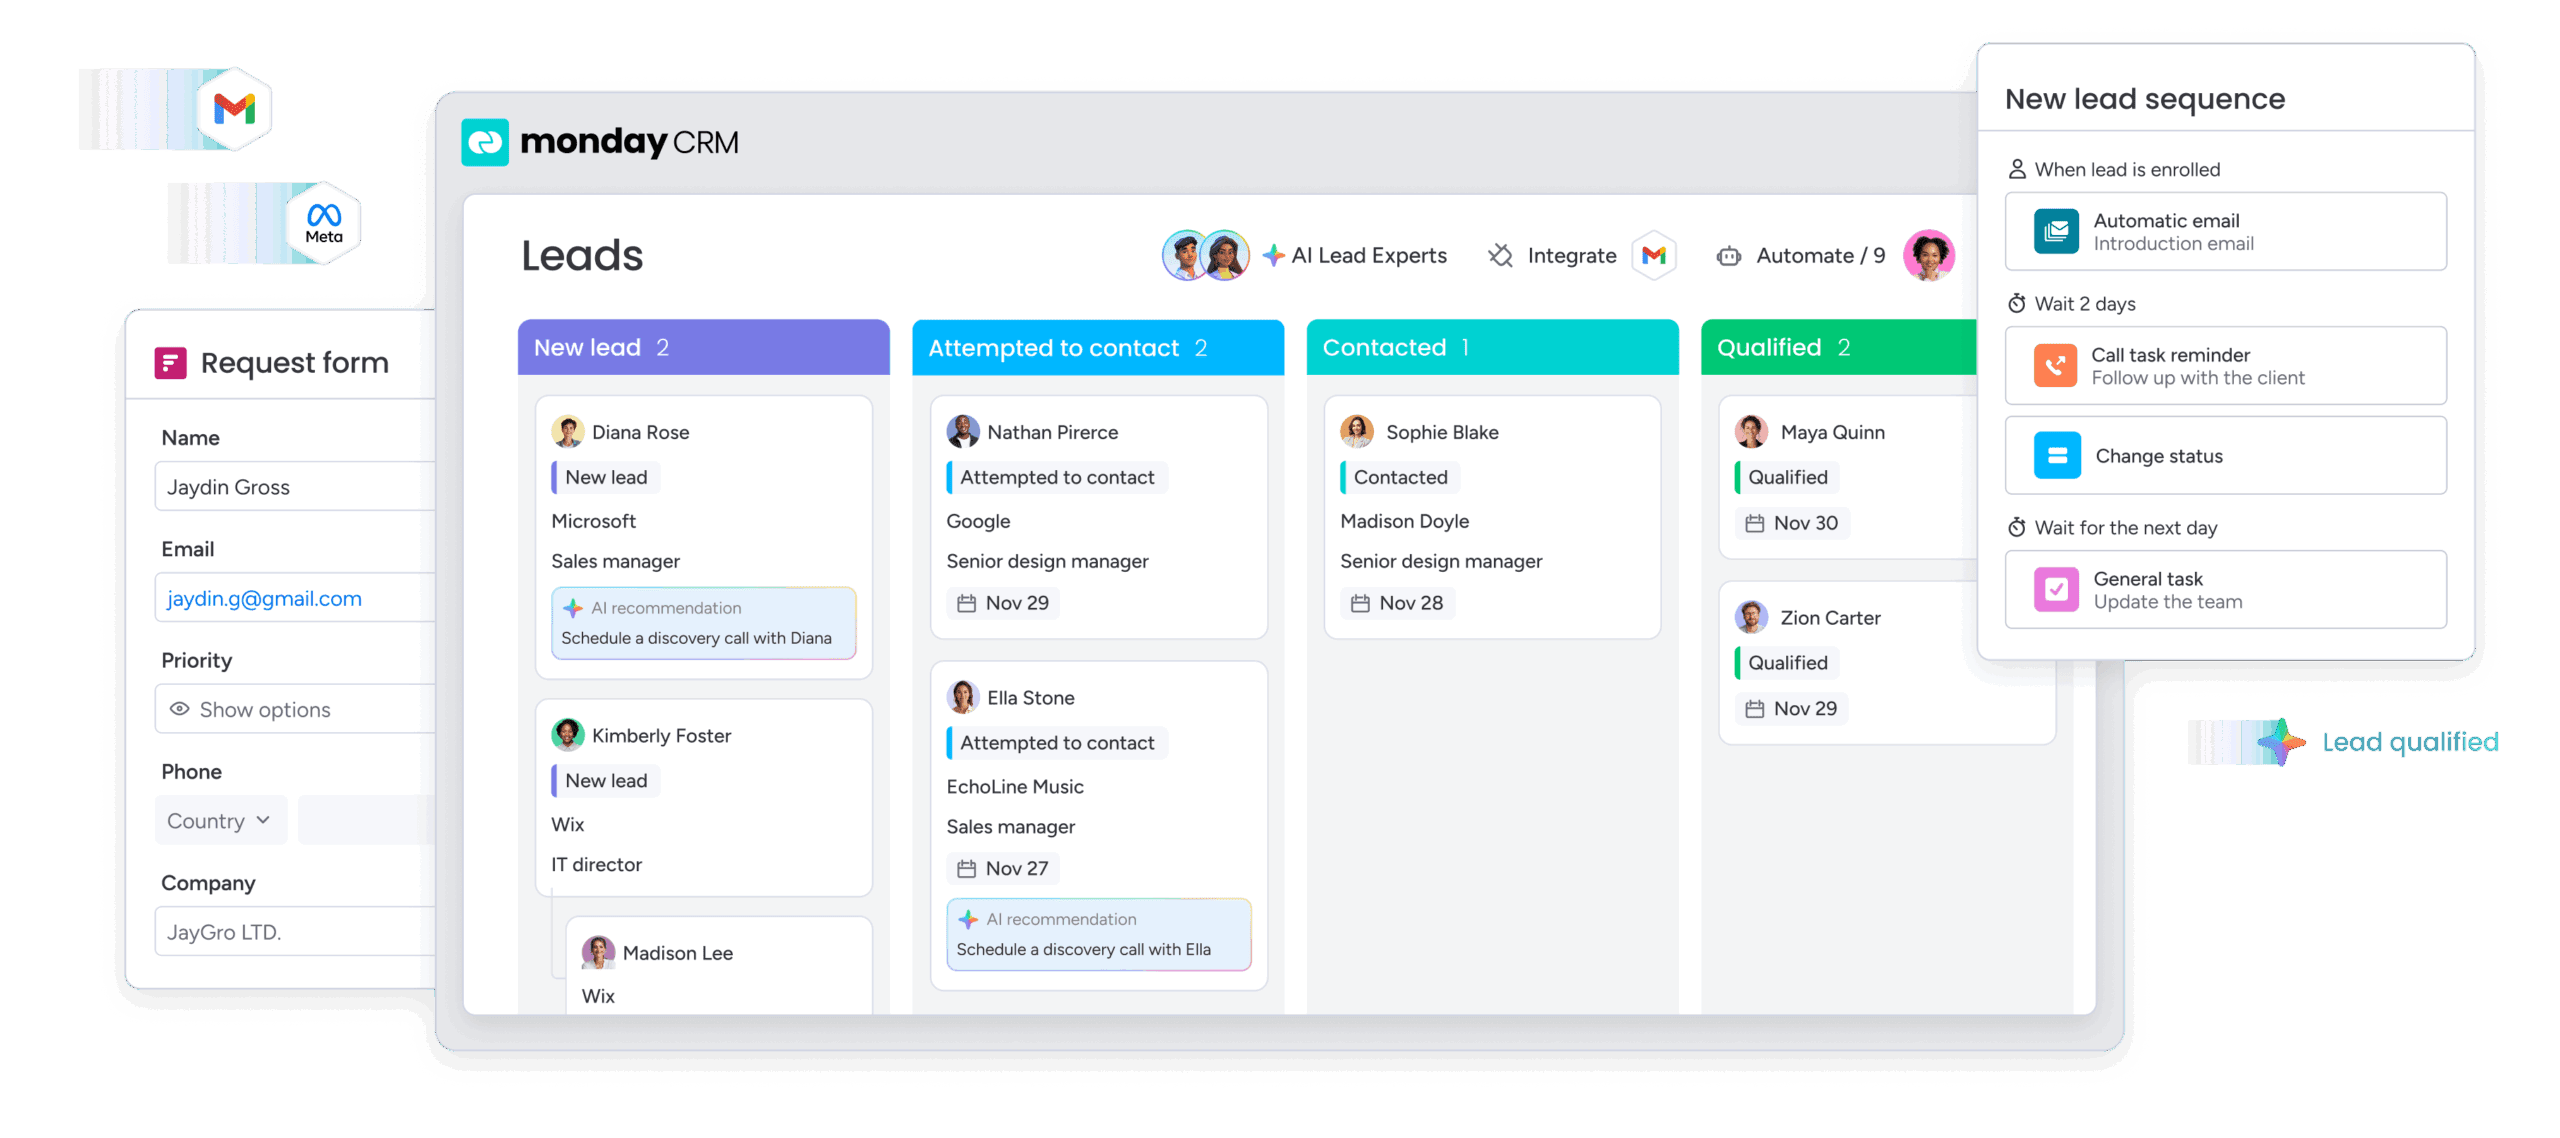
Automated collection ensures data completeness, reduces manual entry burden, and provides real-time accuracy. Revenue teams using monday CRM find this automation solves a real problem: reps spending time updating systems instead of selling.
Uncover actionable patterns through advanced analytics
CRM reporting does more than crunch numbers. It spots patterns humans miss. Advanced CRM analytics reveal correlations and trends that would take analysts weeks to find on their own.
Pattern recognition capabilities include:
- Trend analysis: How metrics change over time and seasonal patterns affecting planning
- Cohort analysis: Performance differences across customer segments
- Correlation identification: Which activities most strongly predict success
- Anomaly detection: Unusual patterns requiring attention
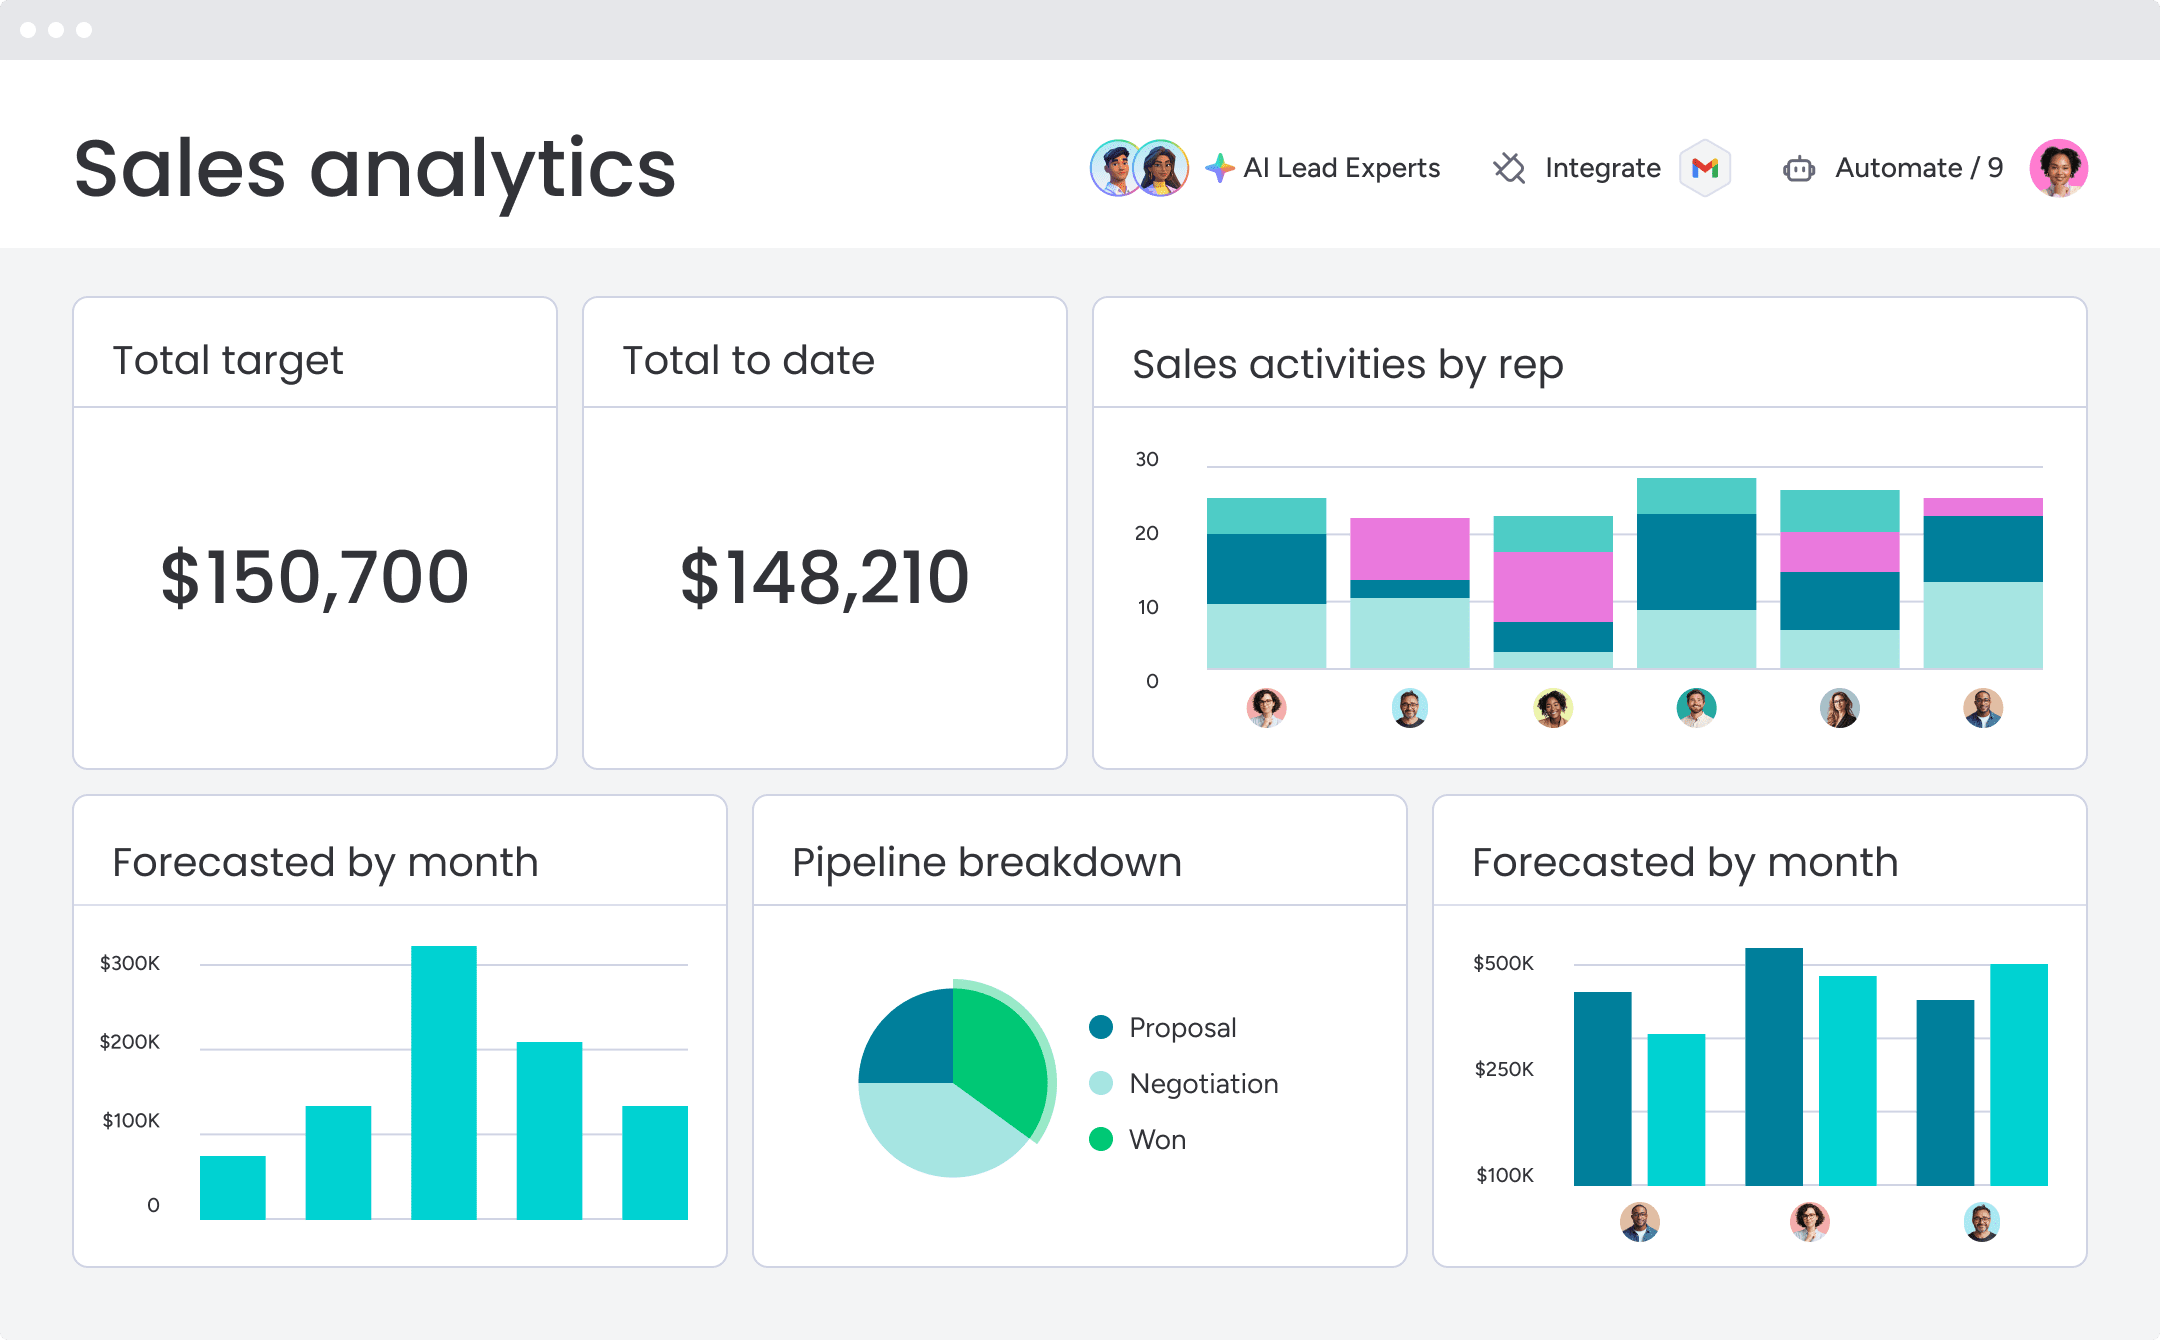
Generate and customize visual reports

While data tables are useful for detailed analysis, visual representations make insights easier to act on quickly.
Effective visualization types include:
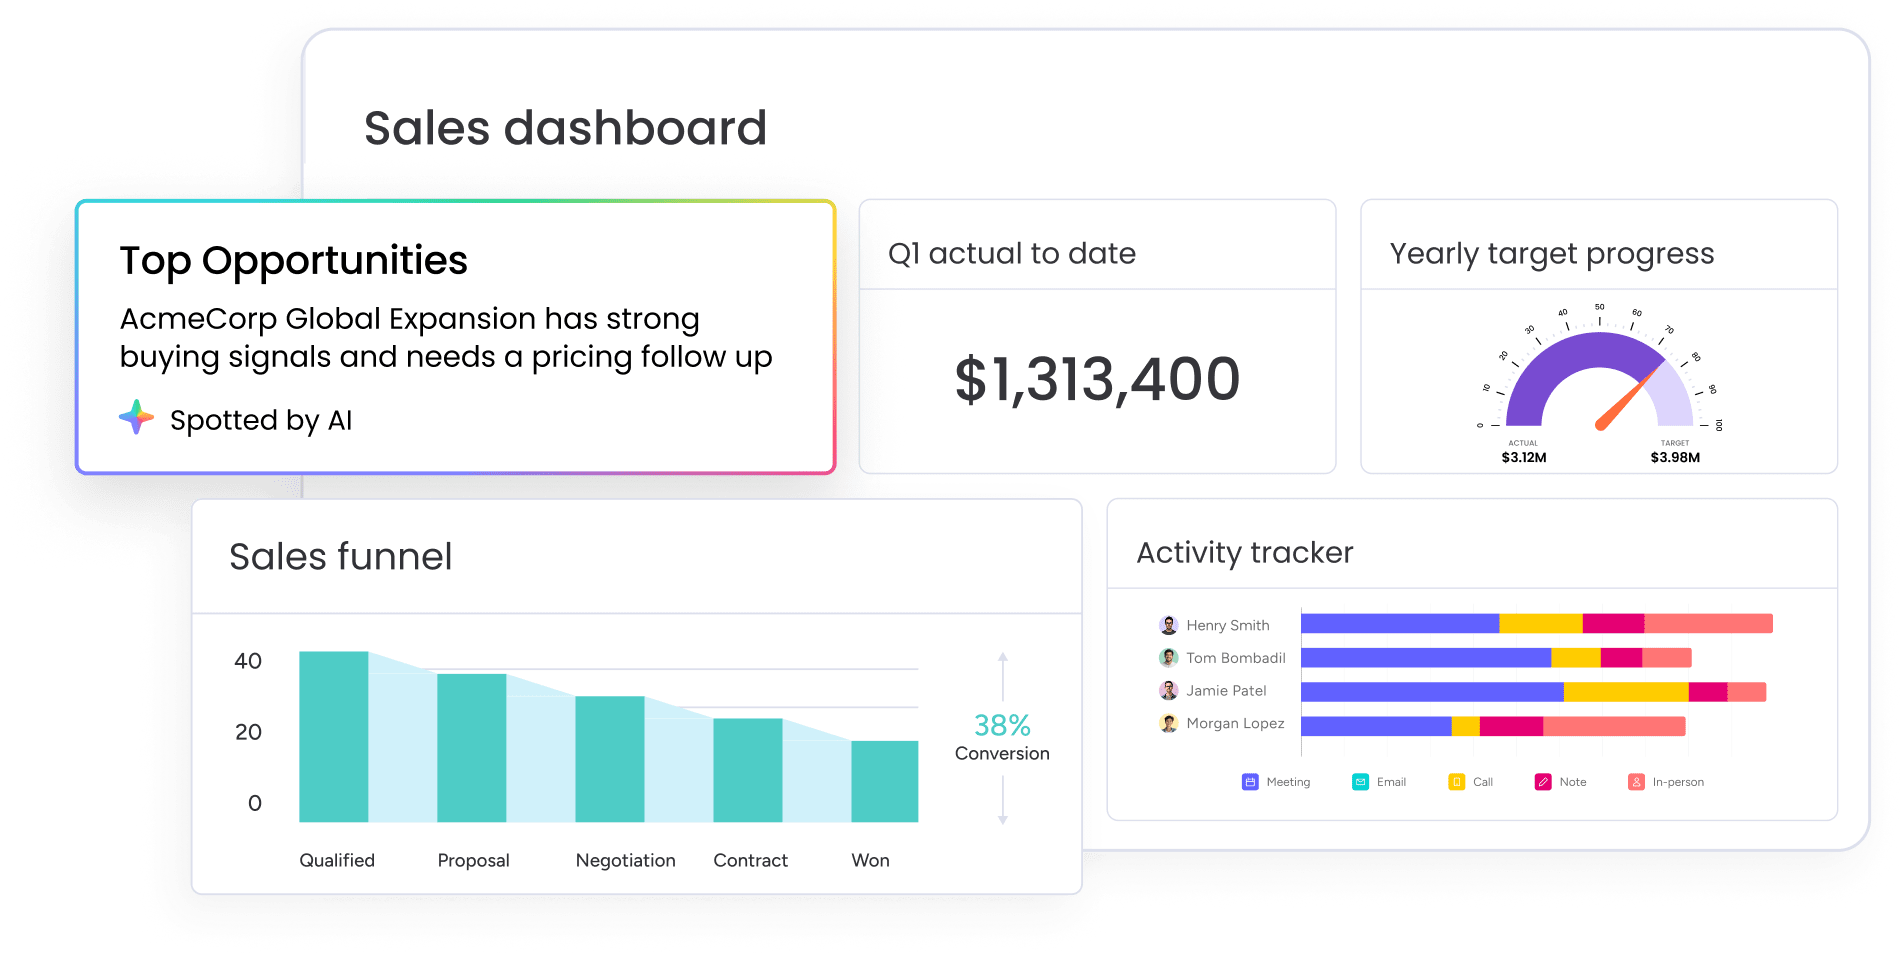
- Pipeline funnels: Deal progression and stage distribution
- Trend lines: Performance over time and trajectory
- Heat maps: Activity intensity or performance by territory
- Gauge charts: Progress toward goals and quota attainment
View real-time distribution and alerts
Insights lose value fast. A deal that closed this morning changes everything. CRM reporting includes automated distribution and proactive alerts that keep everyone current.
Here’s how to keep teams informed:
- Scheduled delivery: Reports via email at defined intervals
- Shared dashboards: Always accessible to stakeholders
- Mobile access: Decision-making capability anywhere
- Embedded reports: Integrated into team communication tools
5 steps to launch CRM reporting with ease
CRM reporting doesn’t need technical expertise or lengthy implementation. A well-defined process makes implementation straightforward, even without dedicated data analysts. Here’s how to get started:
Step 1: Map your revenue goals to specific KPIs
Starting without clear objectives leads to busywork, not insights. Start by defining what success looks like and which metrics actually measure progress.
| Revenue goal | Primary KPI | Supporting metrics |
|---|---|---|
| Hit quarterly revenue targets | Pipeline coverage ratio | New opportunities created, average deal size |
| Improve forecast accuracy | Forecast-to-actual variance | Win rate by stage, sales cycle length |
| Increase sales efficiency | Revenue per rep | Activities per closed deal, time in each stage |
Step 2: Clean and standardize your data foundation
Your reports are only as good as your data. Clean data prevents misleading reports and saves time.
Fix these common data issues:
- Duplicate records: Where “ABC Corp” and “ABC Corporation” appear as separate accounts
- Incomplete fields: Missing information that prevents proper segmentation
- Inconsistent naming: Variations that create fragmented data
- Outdated information: Historical data that skews current-state reports
Step 3: Select reports based on team roles
Different roles need different information. Flooding everyone with every report creates noise, not insight.
| Role | Essential reports | Frequency |
|---|---|---|
| Sales reps | Individual performance scorecard, personal pipeline health | Daily/weekly |
| Sales managers | Team performance, pipeline health, activity tracking | Daily/weekly |
| Sales leadership | Sales forecast, win-loss analysis, revenue attribution | Weekly/monthly |
| RevOps | Data quality metrics, system adoption, process efficiency | Weekly/monthly |
Step 4: Automate report generation and distribution
Creating reports manually eats up time and delays decisions. Automation delivers reports on time and frees teams to act on what they learn.
Key automation features:
- Scheduled generation: Reports created at defined intervals
- Automatic distribution: Delivered to specified recipients
- Conditional alerts: Triggered by performance thresholds
- Self-service access: On-demand reports for stakeholders
Step 5: Create a feedback loop for continuous improvement
Business priorities shift. New questions come up. Your first reports rarely survive real-world use. Good CRM reporting evolves based on feedback.
Feedback mechanisms include:
- Regular review meetings: Assess report usefulness with stakeholders
- Usage analytics: Track which reports get viewed and acted upon
- Stakeholder surveys: Measure customer satisfaction with current reporting
- Ad-hoc request tracking: Identify gaps in current reporting coverage
How AI makes CRM reporting smarter in 2026
AI changes CRM reporting completely. Instead of just describing what happened, it predicts what will happen and tells you what to do about it. This trend reflects broader adoption patterns, as 42% of organizations use generative AI in marketing and sales functions — the most common business application across industries.
- Predictive forecasting that actually works: AI-powered forecasting analyzes thousands of historical deals to identify patterns predicting outcomes, including deal scoring that assigns probability scores based on deal characteristics, risk identification that flags deals likely to slip, and opportunity prioritization that recommends which deals deserve immediate attention.
- Natural language questions get instant reports: Natural language interfaces let anyone ask questions in plain English. Users can ask “Which deals are at risk this quarter?” and AI understands what you’re asking, pulls the right data, and builds the visualization instantly.
- AI spots trends humans miss: AI analyzes your CRM data continuously, surfacing insights you’d never spot manually — hidden correlations, seasonal patterns, warning signals, and success factors that would take analysts weeks to find.
- Automated data quality without manual cleanup: AI-powered data maintenance helps identify duplicates, standardize fields, and flag inconsistencies.
Transform your CRM reporting with monday CRM
Revenue teams using monday CRM discover that sophisticated reporting doesn’t need technical resources or lengthy implementations. The platform gives mid-market teams advanced reporting capabilities without needing data analysts or IT support — just intuitive tools that turn CRM data into actionable insights from day one.
Here’s how the AI-first monday CRM solves your biggest reporting challenges:
- Build custom reports without code: The visual report builder includes drag-and-drop functionality, pre-built templates, flexible filtering, and custom calculations. Most teams create their first custom reports within hours, not the weeks or months legacy platforms demand.
- Get AI-powered insights automatically: AI is built into the reporting experience with predictive deal scoring, natural language queries, automated insight generation, and smart recommendations that suggest which reports to view based on your role.
- Monitor performance in real time: Live dashboards show what’s happening now with real-time pipeline views, activity feeds, goal tracking, and mobile optimization so you can make decisions wherever you are.
- Connect your entire revenue stack: Integrating seamlessly with email platforms like Gmail and Outlook, calendar systems, communication tools like Slack and Teams, and marketing automation platforms like HubSpot and Marketo, monday CRM gives you complete visibility across your tools.
- Scale reporting as you grow: The reporting system scales from small teams to enterprise organizations without platform changes, with flexible permissions, multi-team views, customer hierarchies, and performance optimization so reports stay fast as data volume grows.
The result? Your team spends less time compiling reports and more time acting on insights that drive revenue growth.
Turn CRM reporting into your competitive advantage
CRM reporting transforms scattered sales data into the strategic intelligence you need to forecast accurately, coach effectively, and close consistently. The seven essential reports covered in this guide — from pipeline health to team performance scorecards — give you real-time visibility into what’s working, what’s at risk, and where to focus your efforts. When you combine clean data, automated workflows, and AI-powered insights, reporting becomes your competitive advantage rather than a time-consuming chore.
Ready to turn your CRM data into revenue growth? Get sophisticated reporting without the complexity with monday CRM and build custom reports in hours with drag-and-drop tools, get AI-powered insights automatically, and scale seamlessly as your team grows. Start transforming your sales data into actionable intelligence today.
Try monday CRMFAQs
What is CRM reporting and why is it important?
CRM reporting transforms raw customer and sales data stored in a CRM system into visual reports and actionable insights that track metrics like pipeline health, sales performance, and revenue forecasts. It's important because it replaces guesswork with data-driven decision-making and provides real-time pipeline visibility.
What is the difference between CRM reports and CRM dashboards?
CRM reports are detailed, static documents designed for in-depth analysis of specific metrics or time periods, while CRM dashboards are interactive, real-time visual displays providing at-a-glance status updates. Reports offer deep customization with filters while dashboards show pre-configured key metrics that update continuously.
What are the most important CRM reports for sales teams?
The 7 most important CRM reports are pipeline health, sales forecasting, lead-to-customer conversion tracking, sales activity monitoring, win-loss analysis, revenue attribution, and team performance scorecards. Each addresses specific aspects of sales performance that directly impact revenue outcomes.
How does AI improve CRM reporting?
AI improves CRM reporting through predictive forecasting that analyzes historical deals to calculate accurate close probabilities, natural language queries letting users ask questions in plain English, automated pattern recognition spotting trends humans would miss, and automated data quality maintenance handling deduplication and enrichment.
How long does it take to implement CRM reporting?
Implementation time varies based on data quality and organizational complexity, but teams using platforms with visual builders typically create their first custom reports within hours of setup. The 5-step implementation process can be completed in weeks when starting with core reports and expanding based on demonstrated value.
What data sources should be integrated with CRM reporting?
Effective CRM reporting integrates data from email platforms for interaction history, calendar systems for meeting frequency, communication tools for call logs, and marketing automation platforms for lead source and campaign engagement. Automated integration ensures data completeness without requiring manual entry.