When work slows down, it’s rarely because people aren’t working hard. It’s because work is bouncing between teams with unclear handoffs, invisible dependencies, and too many “I thought they had it” moments. Deadlines slip, rework piles up, and leadership loses confidence—not due to effort, but due to broken flow.
That’s where workflow charts change everything. They make work visible. A workflow chart shows how tasks move from idea to completion, who owns each step, where decisions happen, and where work tends to stall. Instead of guessing why projects slow down, teams can see the entire path, spot friction instantly, and fix it with intention.
This easy-to-follow guide breaks down what workflow charts actually are, how they differ from flowcharts, and when each makes sense. It walks through the core symbols every team reveals on day one, a practical creation process, and also shines a light on how modern work platforms turn diagrams into living workflows teams can execute in real time.
Key takeaways
- Make work visible across teams: workflow charts expose every step, decision, and handoff so nothing gets stuck in hidden queues or assumptions.
- Clarify ownership at every stage: assigning responsibility to each step eliminates finger-pointing and speeds up execution when work moves between teams.
- Choose the right workflow type for the job: project, approval, swimlane, automation, and client workflows solve very different operational problems.
- Turn diagrams into execution engines with monday work management: connect workflow charts directly to live boards, automations, and dashboards so work moves forward without manual follow-ups.
- Use workflows as improvement tools, not documentation: track real performance, identify bottlenecks early, and refine processes based on data — not guesses.
A workflow chart is a visual map that shows how work moves through your organization — from the first action to final delivery. It captures every step, decision, handoff, and owner, turning vague operations into clear sequences teams can follow and improve.
While documentation often sits unread in knowledge bases, a workflow chart actively guides how value flows through your organization. It shows exactly who does what, when handoffs happen, and where decisions get made.
To be effective, a workflow chart must provide a comprehensive view of the operation and establish accountability. An operational blueprint needs these four components to turn a vague process into a sequence your teams can follow and improve.
- Process steps: the specific actions that move work forward, like “Review contract” or “Submit for approval”.
- Decision points: logic gates where the process branches based on criteria, such as “Approved” versus “Rejected”.
- Ownership assignments: clear designation of which role, department, or individual handles each step.
- Dependency mapping: visual lines showing which actions must complete before others can begin.
Map it out, and the waste jumps off the page. You spot redundant approvals, unclear handoffs, and bottlenecks that slow delivery. The workflow chart becomes your interface for getting work done, not just a reference document.
Workflow chart vs flowchart: establishing the difference
Knowing the difference between these chart types helps you pick the right solution for the job. People use these terms interchangeably, but they solve different problems.
A flowchart focuses on logic and sequence. It maps algorithms or decision trees without assigning who does what. A workflow chart maps how work moves between people and teams, showing who owns what and when handoffs happen.
| Feature | Workflow chart | Flowchart |
|---|---|---|
| Primary focus | People, roles, ownership, deliverable movement | Logic, sequence, algorithms, decision trees |
| Business goal | Operational accountability and resource allocation | Process logic troubleshooting and technical documentation |
| Complexity | High (cross-functional handoffs and time variables) | Variable (simple linear steps to complex loops) |
| Best application | Managing team operations, onboarding, project delivery | Coding logic, troubleshooting guides, instruction manuals |
Not sure which one you need? Ask yourself this: If you need to understand who does what and when, choose a workflow chart. If you need to document how a system makes decisions, choose a flowchart.
When to use a workflow chart:
- Cross-functional processes where work moves between marketing, sales, and legal.
- Resource planning to identify workloads and balance capacity.
- Process optimization to reduce cycle time or improve team efficiency.
When to use a flowchart:
- Technical documentation for software logic or data flows.
- Decision trees that guide users through troubleshooting scripts.
- Simple sequences outlining linear instructions with no handoffs.
How workflow charts drive operational excellence
Running a tight operation means seeing what’s happening and building solid processes. Workflow charts give high-performing teams a solid foundation by solving three problems that hit your bottom line.
Transparency creates alignment
Workflow charts show you what’s actually happening behind the scenes. Map every step and handoff, and leadership can finally see how work moves across teams. This visibility eliminates the “black box” effect where requests enter a department and disappear, reducing miscommunication and enabling data-backed resource allocation.
Proactive bottleneck identification
Visualizing workflows shows you where work piles up before it becomes a real problem. Managers can instantly see where work stacks up or where someone’s drowning. You can step in before deadlines slip or customers get disappointed.
Foundation for continuous improvement
If you can’t measure it, you can’t improve it. A workflow chart establishes your baseline for current performance. Once you nail down the standard process, teams can test changes, track results, and make improvements that actually scale. Recent NIST case studies demonstrate that process mapping can deliver a 15% increase in operational efficiency, while value stream mapping has reduced lead times by 33% in manufacturing environments.
Strong processes empower talented people to do their best work. A well-defined workflow chart provides the structure and direction teams need to focus on execution, not on figuring out what comes next.
5 essential workflow chart symbols every team needs
Think of standardized symbols as the alphabet of process mapping. Use the right symbols, and anyone can read your chart — from executives to contractors. These five symbols are all you need to build solid workflow charts:
- Oval (Terminator): represents absolute start and end points. Clear boundaries stop scope creep and show exactly what kicks off the workflow and what marks it done.
- Rectangle (Process): indicates specific actions or operations that must be performed. This is where time and resources get spent.
- Diamond (Decision): marks points where workflows branch based on specific criteria (Yes/No, Pass/Fail). These show where someone needs to approve something or where the process branches.
- Arrow (Flow Line): connects symbols to show sequence and direction. These lines show what needs to happen first and what comes next.
- Document/Data: represents inputs or outputs like reports generated, files uploaded, or emails sent. Tracking and managing these is key for compliance and making sure you actually deliver what you promised.
How to build your first workflow chart
Building a strong workflow chart starts with strategy and ends with execution. Follow these steps, and your chart will actually solve problems instead of gathering dust.
Step 1: define measurable objectives
Start by nailing down exactly what you’re trying to fix. Whether you want to cut onboarding time by 20% or hit 100% compliance in procurement, set clear KPIs so your chart tackles real problems.
Step 2: document the current state
Before you fix anything, figure out what’s actually happening now. Interview stakeholders and observe actual work to capture the “as-is” process, including informal workarounds teams use.
Step 3: assign ownership
Every step needs someone who owns it. Frameworks like RACI (Responsible, Accountable, Consulted, Informed) make it crystal clear who does what.
Step 4: select the right workflow software
The platform you pick determines whether this scales or breaks. Whiteboards are fine for brainstorming, but real operations need software that handles collaboration, integrations, and version control. The best platforms link your charts directly to live boards, automations, and dashboards so teams can actually execute.
Step 5: draft the initial diagram
Map the “happy path” first — the ideal flow of work — before adding exceptions and error loops. Use the right symbols, and your diagrams stay clean and easy to read.
Step 6: collaborate and validate
Build a chart alone, and you’ll miss what’s really happening. Show your draft to the people doing the work. They’ll tell you what’s wrong and where you can improve.
Step 7: Test and refine
Workflow charts aren’t set in stone. Once it’s live, track how it performs against your goals and adjust based on what the data shows.
Pick something that’s driving your team crazy right now. Fix a real pain point, and people will actually want to use workflow charts.
Try monday work management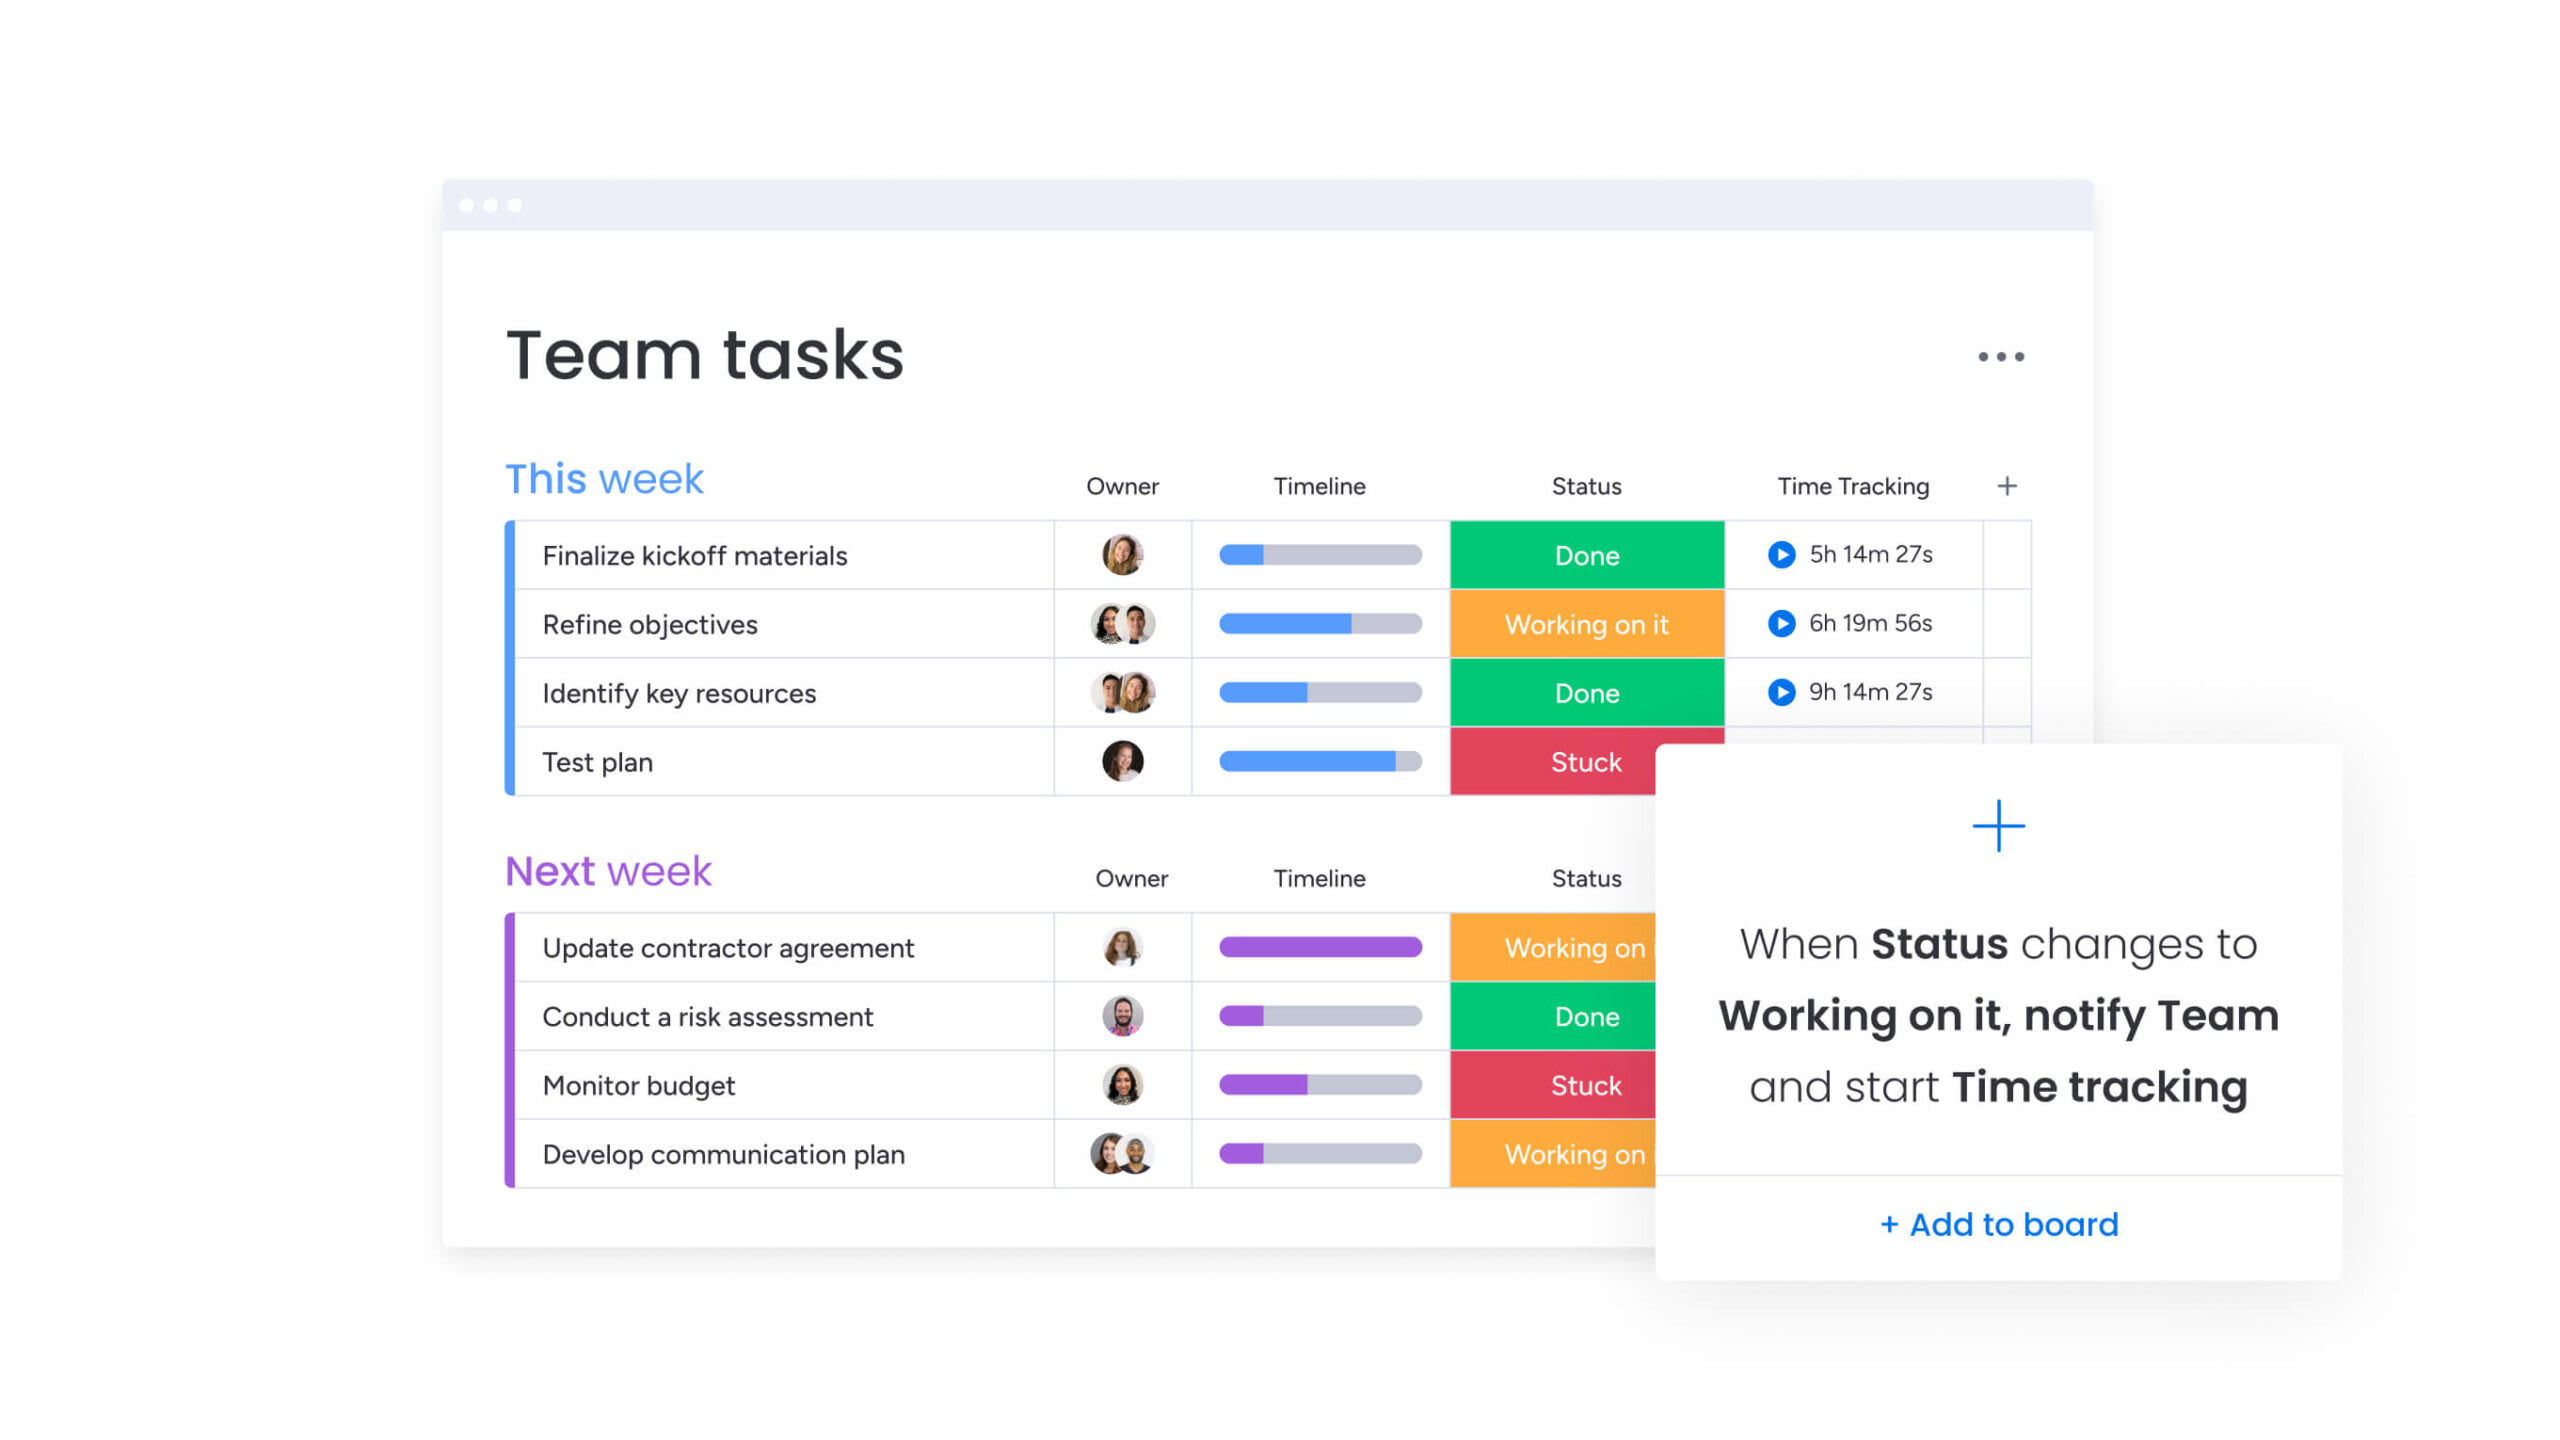
6 types of workflow charts that transform operations
Different problems need different types of charts. Know these six types (listed in the table below), and you’ll pick the right chart for your situation and audience.
| Workflow type | Complexity | Primary audience | Key benefit |
|---|---|---|---|
| Project management | Medium | Project managers, teams | Aligns timelines and deliverables |
| Business process (BPMN) | High | Operations managers, auditors | Ensures consistency and compliance |
| Swimlane (cross-functional) | High | Department heads | Specifies cross-team handoffs |
| Approval request | Low | Leadership, finance | Accelerates decision velocity |
| Client project | Medium | Account managers, clients | Ensures consistent customer experience |
| Automation | Very high | IT, developers | Enables digital transformation |
Understanding when to use each type also helps you match the visualization to your specific needs:
- Project management workflow: tracks milestones and deliverables for one-time projects, keeping cross-functional teams aligned on timelines and resources.
- Business process diagram (BPMN): standardizes repetitive work like payroll or procurement, cutting training time and keeping things consistent.
- Approval request workflow: speeds up approvals by clarifying who signs off and cutting delays from unclear procedures.
- Swimlane map: shows handoffs between departments by putting each team’s steps in separate lanes, breaking down silos.
- Client project workflow: maps how you deliver to clients, focusing on customer interactions and keeping the experience consistent.
- Automation workflow diagram: gets manual processes ready for automation by mapping triggers and logic rules.
Workflow charts aren’t limited to operations or process teams. Every department uses them differently to clarify ownership, streamline handoffs, and keep work moving. When tailored to specific functions, workflow charts turn everyday tasks into repeatable, accountable processes that scale across teams.
Marketing campaign execution
Marketing workflows keep creative, strategy, and operations in sync. A typical chart maps the journey from:
- Concept Brief → Copywriting → Design → Stakeholder Approval → Launch → Analytics
This keeps you from missing deadlines and keeps your brand consistent everywhere.
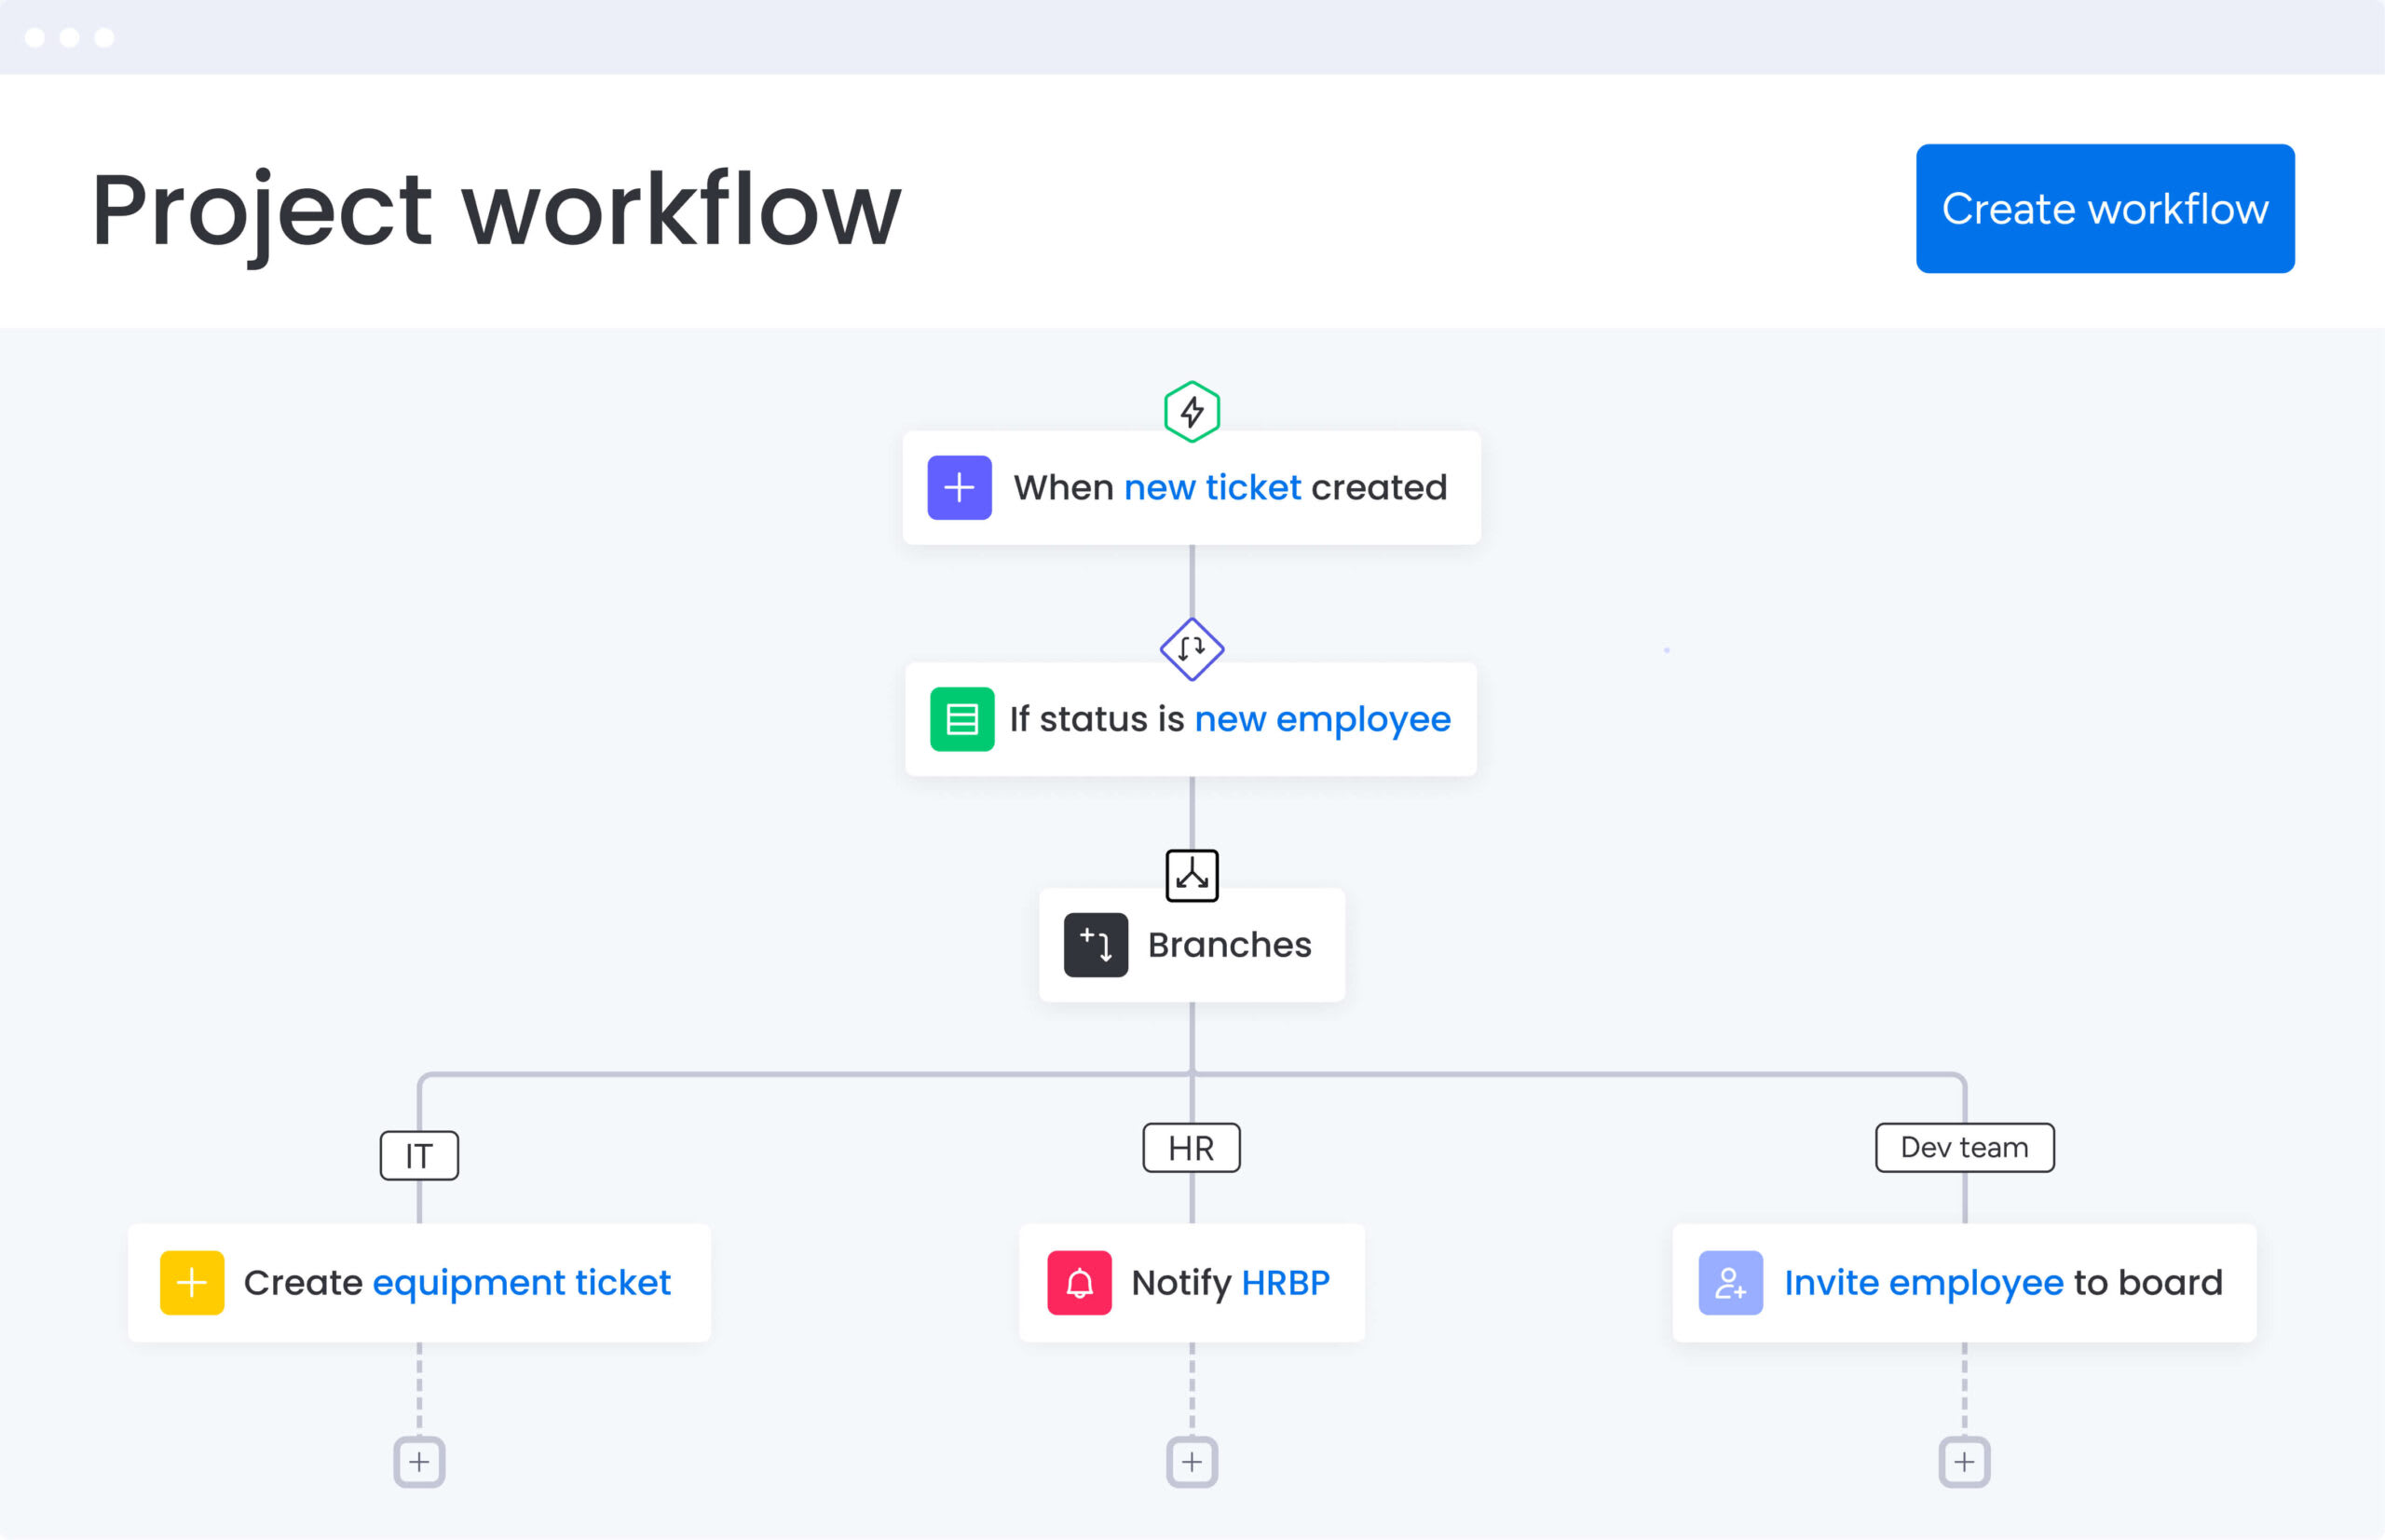
Employee onboarding (HR)
Onboarding workflows make sure every new hire gets the same solid first day. Charts track steps like:
- Contract Signed → IT Equipment Provisioning → System Access Grant → Orientation Scheduling → 30-Day Review
This keeps you compliant and takes work off HR’s plate.
IT service management
IT workflows speed up how you handle issues and keep systems running. The process flows from:
- Ticket Creation → Triage/Prioritization → Assignment → Resolution → User Verification
Clear escalation paths make sure urgent issues get the attention they need.
Financial approval chains
Finance workflows keep a paper trail and control costs. Purchase request charts move from:
- Request Submission → Budget Check → Manager Approval → PO Generation
This speeds up buying while keeping tight controls in place.
Supply chain operations
Supply chain workflows keep vendors and inventory in sync. Charts map:
- Vendor Selection → Order Placement → Quality Inspection → Inventory Stocking
Map it out, and you can proactively identify risks and shorten lead times.
When mapping cross-departmental workflows, always define the “definition of done” for each handoff to prevent friction between teams.
Optimize workflows with AI-powered intelligence
AI turns workflow charts from static maps into smart systems that predict problems. With AI, you stop just managing what should happen and start predicting what will happen.
AI can flag bottlenecks before they slow you down by spotting patterns in past and current performance.
AI capabilities that enhance workflow management include:
- Predictive bottleneck detection: AI spots patterns in past performance that lead to delays, flagging bottlenecks before they happen so you can step in early.
- Smart resource allocation: AI checks team availability, skills, and workload to suggest the best assignments, balancing work and speeding up delivery
- Automated insights and analytics: real-time analysis spots quality issues or timeline slips early without you having to build reports manually.
Teams using monday work management build these AI capabilities right into their workflows. Portfolio Risk Insights scans project boards to flag potential risks by severity, while AI Blocks automate routine steps like categorizing requests or extracting key data from documents.
This aligns with broader industry trends, as 67% of investors say generative AI will be transformational for their business within five years, underscoring the need to hardwire AI into decision workflows.
“monday.com has been a life-changer. It gives us transparency, accountability, and a centralized place to manage projects across the globe".
Kendra Seier | Project Manager“monday.com is the link that holds our business together — connecting our support office and stores with the visibility to move fast, stay consistent, and understand the impact on revenue.”
Duncan McHugh | Chief Operations OfficerStatic diagrams just document. Living workflows actually get work done. Intelligent solutions like monday work management turns diagrams into workflows teams actually use every day.
Charts become interactive boards where you track progress in real-time, statuses update automatically, and teams collaborate without friction. Here’s how the platform makes this happen:
- AI Blocks: modular components automate routine steps like categorizing requests, pulling data from documents, or drafting responses so teams can focus on work that matters.
- Product Power-ups: advanced AI scans hundreds of projects to spot risks, working like an automated auditor that flags issues based on past data and current progress.
- Digital Workforce: always-on assistants monitor workflow health continuously, providing proactive optimization recommendations without constant manual review.
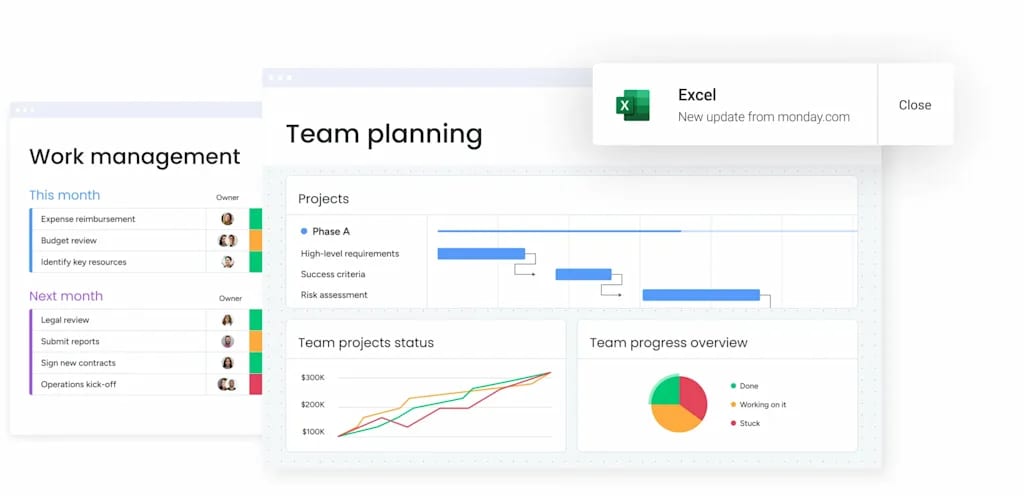
- Real-time dashboards: leaders gain immediate visibility into workflow efficiency and team productivity through customizable dashboards aggregating data from every active board.
- Enterprise scalability: the platform supports complex, cross-departmental workflows with robust governance, ensuring processes remain controlled and secure as organizations grow.
| Capability | Static diagrams | Basic workflow software | monday work management |
|---|---|---|---|
| Execution | Reference only | Manual tracking | Active, automated execution |
| Intelligence | None | Basic reporting | Predictive AI and risk analysis |
| Adaptability | Requires redrawing | Rigid structures | Flexible, low-code customization |
| Collaboration | Disconnected | Comments on items | In-context, real-time collaboration |
| Scalability | Low | Medium | Enterprise-grade scale and governance |
Build workflow charts that drive real results today
Workflow charts are strategic assets that define how organizations deliver value. The difference between charts that gather dust and those driving real value comes down to execution — static diagrams describe processes while living workflows enable them.
When weighing up workflow chart creation and management, consider how diagrams connect to daily work. Effective workflow solutions bridge visualization and execution gaps, turning process maps into actionable workspaces where collaboration, automation, and intelligence converge.
The future of workflow management is intelligent, unified, and real-time. Organizations embracing AI-powered insights, eliminating tool sprawl, and building adaptive workflows will move faster and more efficiently than those stuck with static documentation. Start by mapping one critical process, involve the people doing the work, and choose tools that grow with you.
Remember: the best workflow chart is one your team actually uses.
Frequently asked questions
Can I create workflow diagrams in Microsoft Word?
Yes, you can create basic workflow diagrams in Microsoft Word using shapes or SmartArt. It works well for simple, static visuals or one-off documentation. However, Word diagrams are disconnected from execution — they don’t support real-time collaboration, automation, version control, or live tracking. As workflows grow more complex or cross-functional, teams quickly outgrow static documents and move to dedicated workflow platforms that connect diagrams directly to the work itself.
How do workflow charts boost team productivity?
Workflow charts boost productivity by eliminating ambiguity regarding roles and next steps. They reduce time spent on coordination, allowing team members to focus entirely on execution rather than figuring out what comes next.
Which platforms are best for team workflow collaboration?
The best platforms combine visual charting with active management. Solutions like monday work management allow teams to plan, execute, and collaborate on workflows within a single unified system, rather than using separate tools for documentation and execution.
How frequently should workflow charts be updated?
Workflow charts should undergo review and updates at least quarterly. Additionally, update them whenever significant changes occur in team structure, technology, or business strategy to ensure they reflect current operational realities.
Can AI optimize my workflow chart design?
Yes, AI analyzes historical process data to suggest more efficient paths and identify redundant steps. It can automatically structure workflows based on industry best practices while detecting bottlenecks and recommending optimizations.
How does monday work management handle complex workflow charts?
monday work management handles complexity by breaking large workflows into connected boards. It uses automations to manage handoffs and provides high-level dashboards that aggregate data across the entire portfolio for unified visibility and control.