You’re planning a product launch when your manager asks for a visual timeline to share with stakeholders. You open Google Docs, but instead of a ready-made template, you find a blank page. You are left wondering whether to wrestle with drawing tools, build a table from scratch, or hunt for a third-party add-on.
Creating a timeline in Google Docs often takes more manual effort than expected. Because the platform lacks native timeline components, teams rely on workarounds like embedded drawings or structured tables. While these methods serve their purpose, they result in static documents that require constant, manual updates whenever project details shift.
The following sections provide five practical methods for building timelines in Google Docs, from basic layouts to automated integrations. You will learn step-by-step how to set up each approach and discover which one best fits your specific project type. Below, we’ll show you how to transform a basic document into a clear, visual roadmap that saves your team hours of maintenance.
Key takeaways
- Move beyond static documents to dynamic project execution: monday work management turns timelines into live workflows that update automatically when project data changes, cutting out hours of manual maintenance.
- Google Docs lacks native timeline templates, requiring workarounds: Use Google Drawing for visual roadmaps, tables for detailed schedules, or Sheets integration for data-driven timelines depending on your specific project needs.
- Choose your timeline method based on audience and complexity: Project managers need Sheets integration for frequent updates, marketing teams benefit from table formats for content details, and executives prefer polished drawings for strategic presentations.
- Automation reduces timeline maintenance overhead significantly: Connect Google Sheets to Docs for auto-updating charts, use Gemini AI for initial timeline generation, and leverage Smart Canvas features to create interactive project hubs.
- Document-based timelines break down at organizational scale: Multiple disconnected timelines create version control issues, prevent cross-project visibility, and require manual effort to track real progress against original plans.
What timeline templates does Google Docs offer?
Google Docs doesn’t include native, pre-built timeline templates in its standard gallery. When you search for a one-click timeline solution, you’ll find yourself navigating workarounds and manual formatting instead. The platform treats timelines as either drawing objects or structured tables rather than active project management components.
Knowing what’s available helps you pick the right method for your project. Each option within the Google ecosystem suits different project requirements and team workflows.
| Feature | Google drawing | Native table | Sheets integration |
|---|---|---|---|
| Primary use | Visual roadmaps | Detailed itineraries | Data-driven schedules |
| Flexibility | High (freeform) | Medium (row/column) | Low (chart constraints) |
| Data connection | None (static) | None (static) | Dynamic (linked) |
| Setup time | 10-15 minutes | 5-10 minutes | 15-20 minutes |
| Mobile edit | Limited | Full | Limited |
Each of these three approaches works for different situations:
- Insert > Drawing feature: Offers canvas-based freedom to drag and drop shapes and lines. Use this for high-level roadmaps where the general sequence matters more than exact dates.
- Native tables: Provide rigid structure, making them ideal for detailed itineraries or logs where text descriptions carry as much weight as the dates themselves.
- Google Sheets integration: For timelines requiring date precision, integrating a chart from Google Sheets offers a bridge between calculation and presentation. Your data stays accurate, but you’re juggling two separate files.
How often do your project dates shift, and how much time do you spend updating documents to reflect those changes? Research shows that about 50% of projects experience schedule delays, underscoring the importance of choosing timeline tools that can adapt to changing requirements.
5 ways to make a timeline in Google Docs
The way you build a timeline in Google Docs depends on what you want it to look like. These five methods range from manual design to automated integrations, giving you options whether you’re working solo or managing enterprise-level projects. Each approach is more effective for certain teams and project types.
1. Create a visual timeline using Google Drawing
The Google Drawing canvas embedded within Docs allows you to create custom, shape-based timelines directly on the page. This method provides the most control over visual styling and branding, making it suitable for presentations and stakeholder communications.
Build it in six steps:
- Access the canvas: Navigate to Insert > Drawing > New to open the drawing modal.
- Establish the baseline: Select the Line option (Arrow) to draw the horizontal axis of your timeline.
- Add milestones: Use the Shape option to place circles or diamonds along the axis to represent key dates.
- Label events: Use the Text Box option to add dates and descriptions above or below each milestone marker.
- Format and align: Use the Distribute option to ensure even spacing between events and apply brand colors to shapes.
- Insert: Click Save and Close to place the image into your document.
Key considerations are:
- Grid background: Use it in the drawing canvas to ensure chronological accuracy visually.
- Future edits: Double-clicking the image later allows you to make changes.
- Manual adjustments: Moving one element doesn’t automatically shift others, requiring you to reposition items individually.
2. Build a timeline table in your document
Tables offer a text-first approach to timelines, prioritizing readability and detail over graphical representation. Use this format when you need room for detailed descriptions and context alongside your dates.
Setup process includes steps listed below:
- Insert a table: Through Insert > Table and select a 3×10 grid, adjusting rows based on your project length.
- Label headers: As “Date,” “Milestone,” and “Description” to establish a consistent framework.
- Merge cells: In the first column if grouping by month or quarter to reduce repetition.
Apply these formatting tips to your table:
- Use background colors: Through cell shading to differentiate between phases or status.
- Set the table border width: To 0pt while keeping only the bottom border of rows visible.
- Create a timeline appearance: Rather than a spreadsheet look.
3. Design an interactive timeline with Google Sheets
When you need accurate dates that might change, build your timeline in Google Sheets and embed it in Docs. This connects live data to a visual chart, so your deadlines stay accurate in one place.
Follow this integration workflow:
- Prepare the data: Start in a new Google Sheet with “Task Name” and “Date” columns.
- Generate the visual: Highlight your data, click Insert > Chart, and Select Timeline Chart.
- Personalize the design: Customize colors and date ranges within the Sheets editor.
- Embed into Docs: Return to your document and navigate to Insert > Chart > From Sheets.
- Synchronize the files: Select your spreadsheet and Ensure the “Link to spreadsheet” box is checked.
This allows the chart in the Doc to update with a single click whenever the source data in Sheets changes.
4. Download free timeline templates from Google Gallery
Google Workspace has third-party templates that skip the manual setup. These templates come with pre-set formatting and placeholder text, so you can start faster.
The access process includes those steps:
- Browse the store: Navigate to Extensions > Add-ons > Get add-ons.
- Find relevant tools: Search for “Timeline” or “Project Management Templates” in the bar.
- Enable the extension: Select a highly-rated provider and Install the add-on.
- Choose a style: Open the menu from Extensions and Select a timeline to insert.
- Finalize the content: Replace the placeholder text with Actual project data.
An important limitation is that these templates are often image-based or complex tables, making structural changes difficult after insertion.
5. Generate smart timelines using Workspace add-ons
Dedicated diagramming tools do more than Google’s native drawing features, especially for complex flows with dependencies. Apps like Lucidchart or Draw.io integrate directly with Google Docs.
Implementation steps are:
- Build the timeline within the third-party application: Utilize their advanced drag-and-drop features and smart alignment capabilities.
- Use the sidebar add-on in Google Docs: Insert the finished diagram.
- Unlike static images: These add-ons often allow you to click “Update Images” in the sidebar to reflect changes made in the source diagram without re-inserting the file.
When you need accurate dates that might change, build your timeline in Google Sheets and embed it in Docs. This connects live data to a visual chart, so your deadlines stay accurate in one place.
Select the perfect timeline template for your needs
The best timeline method depends on who’s reading it and how complex your information is. Different teams need different levels of detail and update schedules. Knowing these differences helps you pick the approach that gives you the most value with the least upkeep.
Project management timeline templates
Project managers need timelines that show what happens when, how long it takes, and what depends on what. Managing multiple overlapping projects requires more than a simple list of dates to be effective.
- Recommended approach: The Google Sheets integration (Method three) is the most efficient approach here. Project dates shift frequently, and updating a spreadsheet then clicking “Update” in the Doc is far more efficient than manually dragging shapes in a drawing. It keeps all your deadlines accurate in one place.
Marketing and campaign timeline templates
Marketing teams often need to visualize content drops, channel distribution, and launch phases. The goal is coordination and visibility, not tracking complex dependencies.
- Recommended approach: The Timeline Table (Method two) works Use case content calendars. It allows for ample text space to include copy snippets, links to assets, and owner names alongside the dates. Color-coding rows by channel provides instant visual distinction.
Event and strategic planning timeline templates
Strategic roadmaps and event run-of-shows go to stakeholders who want the big picture without drowning in details. What impression do you want to leave with your audience?
- Recommended approach: The Google Drawing (Method one) or Workspace Add-ons (Method five) are ideal for these scenarios. These allow for polished, branded visuals that look professional in a presentation or proposal. You’re telling a strategic story, which works better with freeform design tools.
Automate timeline creation with Google tools

Power users can cut down on manual updates by using Google Workspace’s automation features. These methods keep your timelines up to date without endless editing. However, the trick is connecting your timeline to the data that drives your project decisions.
Set up auto-updating timeline data
Connect your Google Doc to a master Google Sheet, and your timeline updates automatically without manual intervention. The automation works like this:
- Data validation: Use dropdown menus in the source Sheet for status updates (e.g., “On Track,” “Delayed”).
- Conditional formatting: Configure the Sheet to automatically change row colors based on dates passing.
- Linked objects: When the chart in the Doc is linked, an “Update” button appears on the image whenever the underlying Sheet data changes.
Use Gemini AI to generate timeline foundations
Google’s Gemini AI speeds up timeline setup, so you’re not staring at a blank page. Users can type prompts such as “Draft a 4-week product launch timeline in a table format with columns for Date, Milestone, and Owner.”
This approach delivers three key advantages:
- Suggests standard milestones: Gemini can suggest standard milestones for specific project types.
- Ensures no critical steps are missed: This helps ensure no critical steps are missed during the initial planning phase.
- Reduces setup time: This AI-assisted workflow reduces setup time while providing a foundation you can customize.
Connect timelines across Google Workspace
Smart Canvas features turn timelines into interactive tools instead of static text. These integration points create connections between your timeline and other Google services:
- Smart Chips: Typing “@” followed by a date, person, or file name creates an interactive chip.
- Calendar integration: Hovering over a date chip allows users to book a meeting or add the event to their Google Calendar directly from the timeline.
- Checklist assignment: Assigning checklist items within the timeline table sends notifications to the tagged team members via Google Tasks.
Connect your Google Doc to a master Google Sheet, and your timeline updates automatically without manual intervention.
Understanding the limitations of Google timeline templates
Google Docs is accessible, but it’s a word processor, not a project management tool. As organizations grow, static documents create problems that get worse over time. Knowing these limits helps teams spot when they’ve outgrown document-based timelines.
Managing multiple connected timelines
Organizations running complex portfolios hit major roadblocks when they rely on individual documents. A timeline in one Google Doc doesn’t communicate with a timeline in another. This isolation keeps leaders from spotting resource conflicts or dependencies across projects.
Key challenges are:
- Manual aggregation effort: The manual effort required to aggregate data from ten different documents into a single executive summary is high and prone to human error.
- No automatic detection: No automatic detection of resource conflicts across projects.
- Version control complexity: Version control becomes complex when multiple teams edit separate timeline documents.
Tracking real progress against plans
A template captures your plan at one moment. It doesn’t track what’s actually happening. In Google Docs, timelines don’t update themselves when you finish tasks. You must manually enter and calculate any variance between the “Planned Date” and the “Actual Date.”
Common issues include:
- Document management over project management: Teams often find themselves managing the document rather than the project.
- Delayed status updates: Hours spent updating colors and text boxes to reflect status changes that happened days ago.
- No automated alerts: No automated alerts when deadlines are at risk.
Scaling timeline management across teams
As teams grow, keeping everyone on the same page gets harder. Without standards, one department might use tables while another uses drawings, making collaboration messy.
Scaling challenges include:
- Version control issues: Version control issues arise when multiple stakeholders edit the timeline simultaneously.
- Potential for overwriting: Potential for overwriting critical constraints.
- Binary security permissions: Security permissions are binary — users usually have access to the whole document or nothing.
- Lack of granular sharing: Lack of ability to hide sensitive strategic dates while sharing the rest of the timeline.
Master dynamic timelines with monday work management

Organizations see more and control better when timelines connect to actual work. You can move from documenting timelines to executing them with monday work management. This provides one workspace where timelines are live, interactive, and tied to real project data. This closes the gap between planning and execution that static documents create.
Move from templates to living project timelines
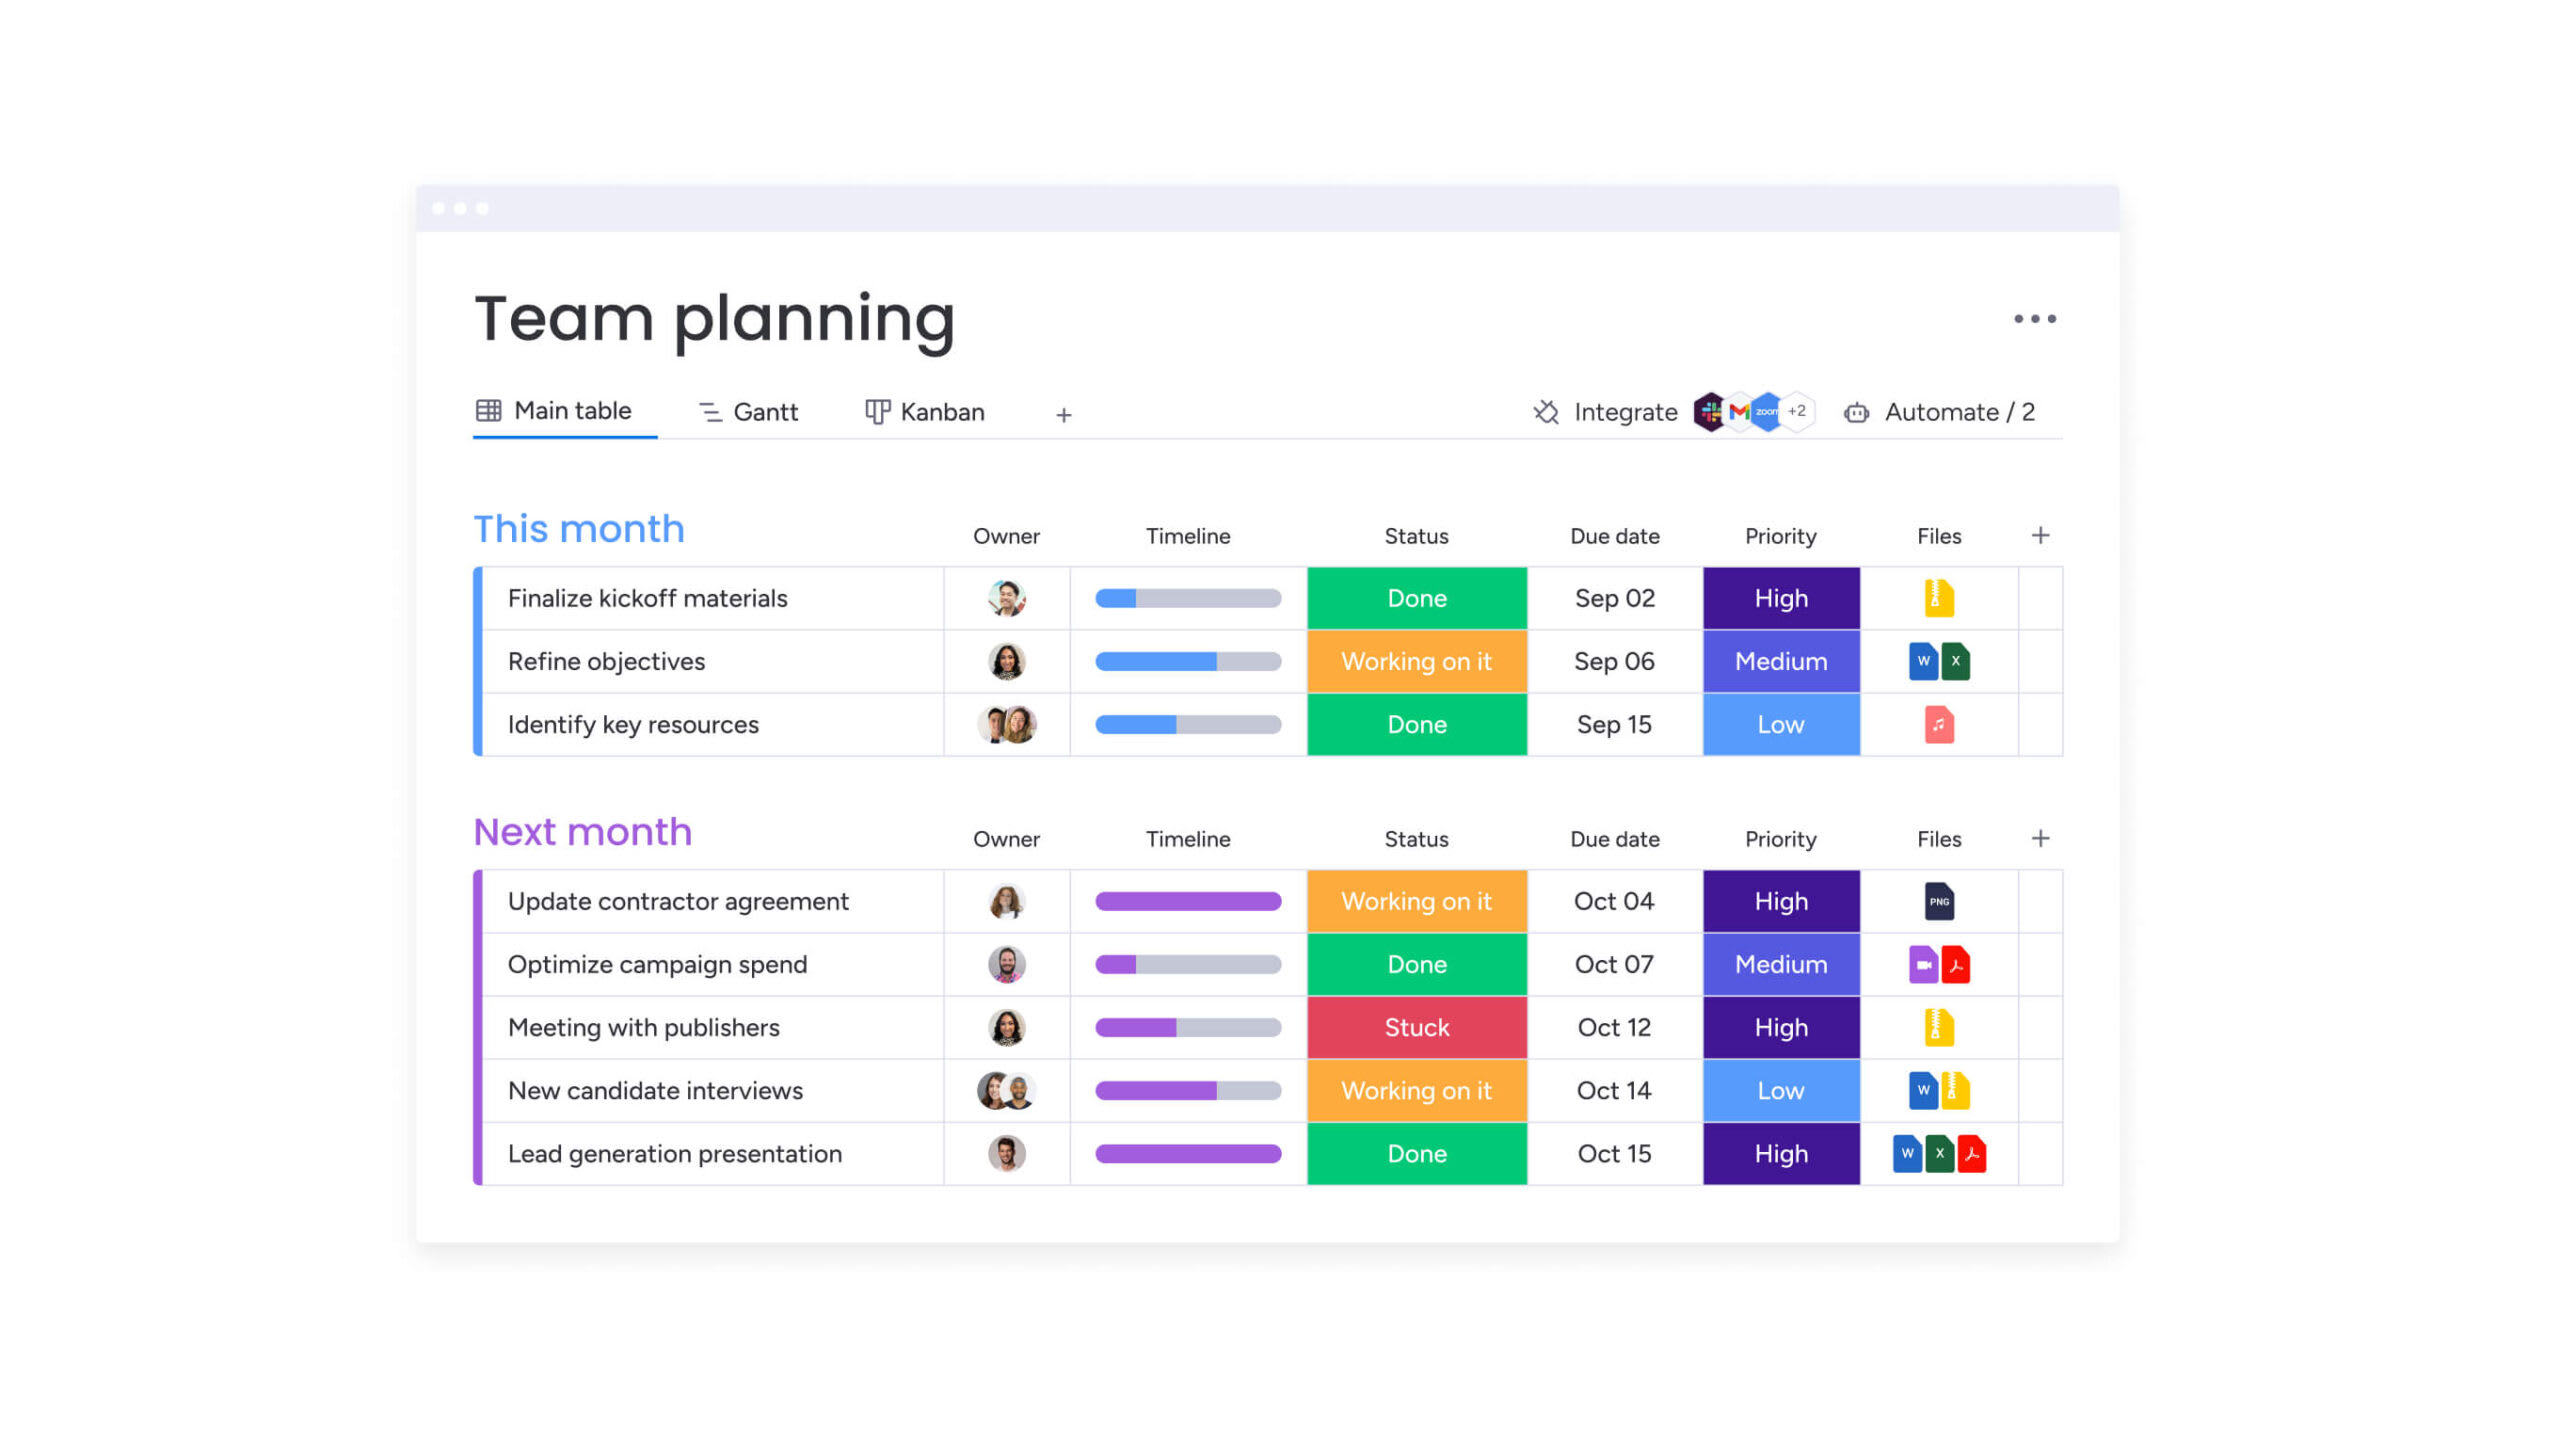
Unlike static documents that need manual updates, monday work management uses dynamic views that show real-time data. The Gantt View and Timeline View are interactive interfaces where dragging an item to a new date automatically adjusts dependent items, notifies assigned owners, and updates the project status.
| Feature | Google docs template | monday work management |
|---|---|---|
| Update mechanism | Manual text/shape entry | Real-time, automated |
| Dependencies | None (visual only) | Intelligent, auto-adjusting |
| Capacity planning | Impossible | Integrated workload view |
| Risk detection | Manual review required | AI-powered insights |
| Scalability | Single document limits | Enterprise-wide hierarchy |
Teams can view the same data as a Gantt chart (for managers), a Kanban board (for execution teams), or a calendar (for executives). Everyone works from the same information, just in the format that works best for them.
AI-powered timeline risk detection and updates
You can shift from passive tracking to proactive management by using monday work management and its integrated AI. The Portfolio Risk Insights tool scans all project boards to flag risks by severity, allowing teams to spot critical issues instantly. These intelligent automation features ensure you never have to dig through data to find hidden bottlenecks.
- Historical analysis: The platform analyzes historical performance and current workload to identify potential bottlenecks before they impact the deadline.
- Status-triggered alerts: When a status changes to “Stuck,” automation rules can instantly notify the project owner and adjust the timeline color to red, ensuring immediate visibility.
- Predictive analytics: Help teams anticipate delays before they occur.
Enterprise features for timeline collaboration
For large organizations, security and scalability matter most. The platform offers enterprise-level security and controls that simple documents can’t match.
Key enterprise capabilities include:
- Multi-level permissions: Control who can edit dates, who can view sensitive milestones, and who can only update status.
- Cross-departmental dashboards: Aggregate timelines from marketing, IT, and sales into a single high-level view for executive review.
- Integrations with platforms: Like Jira, Salesforce, and GitHub ensure that work happening in other systems automatically updates the master timeline.
If you’re spending more time formatting timelines than managing work, you need a dedicated platform. While 88% of organizations now use AI in at least one business function, most still rely on manual document updates rather than automated, data-driven timeline management. Moving to a Work OS gives you simple visual timelines backed by powerful, connected workflows.
“monday.com has been a life-changer. It gives us transparency, accountability, and a centralized place to manage projects across the globe".
Kendra Seier | Project Manager“monday.com is the link that holds our business together — connecting our support office and stores with the visibility to move fast, stay consistent, and understand the impact on revenue.”
Duncan McHugh | Chief Operations OfficerBuild timelines that drive execution, not just documentation
Google Docs templates provide a functional starting point, but their manual nature eventually becomes a bottleneck. As complexity increases, the time spent adjusting static drawings often distracts from actual project management. Transitioning to a dynamic system represents a strategic shift from simply documenting a plan to actively executing it.
By connecting your timeline to live project data, you eliminate the gap between planning and reality. This integration ensures every deadline shift is reflected across your entire organization instantly. The use of monday work management transforms isolated documents into interactive, automated workflows that grow alongside your business ambitions.
Ultimately, the right infrastructure ensures your team spends less time on administrative updates and more on high-value decision-making. This shift is particularly relevant as two-thirds of organizations have undergone operating model redesigns recently, requiring tools that can keep pace with change. Adopting monday work management ensures your timelines remain as robust and agile as your broader organizational goals.
The content in this article is provided for informational purposes only and, to the best of monday‘s knowledge, the information provided in this article is accurate and up-to-date at the time of publication. That said, monday encourages readers to verify all information directly.
Frequently asked questions
How do I create a timeline in Google Docs without a template?
You can create a timeline manually by navigating to Insert > Drawing > New to draw shapes and lines, or by using Insert > Table to build a structured list of dates and milestones.
Can Google Sheets timeline view update automatically?
Google Sheets timelines update when cell data changes, but they won't adjust dates based on dependencies or completion unless you build complex formulas yourself.
What's the fastest way to make a timeline on Google Docs?
The fastest method is using Insert > Table to create a simple three-column list (Date, Milestone, Owner), as it requires no graphical formatting or external integration.
How do I customize a Google Docs timeline template?
You can customize downloaded templates by right-clicking images to replace them or clicking table cells to change the placeholder text. Changing the structure of a third-party template usually breaks the formatting.
Can I convert Excel timelines to Google format?
You can upload Excel files to Google Drive and convert them to Sheets, but complex timeline charts and macros usually break and need manual fixes.
Does Google have Gantt chart timeline templates?
Google doesn't have native Gantt chart templates in Docs. Users must create them manually in Sheets using a Stacked Bar Chart workaround or use a third-party add-on.