
Every business invests money, time, and people into projects they believe will drive value. But here’s the uncomfortable truth: most organizations can’t prove which investments paid off and which drained resources. They track budgets, monitor timelines, and measure activity. What they don’t measure is whether all that work was worth it.
Return on investment (ROI) separates real business impact from impressive-looking numbers that don’t move the needle. It’s how you translate ‘we did great work’ into ‘here’s exactly what that work was worth.’ This guide explores how to use ROI to make smarter resource decisions. You’ll see practical calculation methods, real examples from different departments, and how centralizing your project data turns ROI from a quarterly chore into ongoing strategic insight.
Try monday.comKey takeaways
- Calculate ROI using the simple formula (Net Profit / Investment Cost) × 100: capture all costs including hidden expenses like training time and coordination overhead to get accurate returns.
- Track ROI continuously instead of quarterly or annually: real-time visibility into project performance lets you spot problems early and optimize before budgets are exhausted.
- Focus on both sides of the ROI equation: reduce costs through automation and process optimization while increasing returns through faster delivery and resource allocation.
- Use monday.com’s dashboards and time tracking to measure true ROI: connect daily work to financial outcomes and capture distributed returns across departments automatically.
- Compare ROI results against industry benchmarks and risk levels: a 30% return might be excellent for low-risk projects but insufficient for high-risk initiatives requiring 200%+ returns.
What is ROI?
Return on investment (ROI) measures how much profit you made compared to what you spent. You’re comparing what you gained against what you spent to understand whether the investment was worthwhile.
ROI gives every department a shared way to talk about value, whether you’re in finance, operations, or marketing. While historically calculated quarterly or annually, ROI now functions as a continuous pulse check on business performance. Tracking ROI in real time instead of after the fact changes how companies understand what’s working.
Key characteristics of ROI include:
- Positive ROI: You gained more than you spent
- Negative ROI: The investment resulted in a loss
- Higher percentage: More efficient your investment
With platforms like monday.com, ROI becomes something you track continuously, not just calculate once. Real-time dashboards and automated tracking show you what those percentages mean for your business right now, not 3 months from now.

How to calculate return on investment
To get ROI right, you need to track every cost and collect data consistently. The math is easy, but getting accurate numbers is much harder. Here’s how to calculate ROI without falling into the traps that make your numbers meaningless.
Basic ROI calculation formula
Use the following formula to calculate return on investment.
(Net Profit / Cost of Investment) × 100
The calculation works best for single-period investments with defined start and end dates. It gives you a fast read on whether something paid off.
For most projects, this one works best, but for longer projects, you’ll need different formulas.
Step 1: Identify total investment costs
To calculate accurate ROI, you need to track every cost. Successful ROI calculations account for the hidden costs that often impact returns.
Direct costs represent the obvious expenses:
- Software licenses and subscriptions
- Equipment purchases and upgrades
- Contractor and consultant fees
Indirect costs often exceed direct expenses:
- Implementation and training time
- Productivity dips during transition
- Ongoing maintenance and support
Hidden costs frequently go untracked:
- Coordination overhead between teams
- Context switching between platforms
- Manual reporting and data entry
Teams using monday.com capture these costs automatically through time tracking and budget columns, eliminating the guesswork that undermines ROI accuracy.
Step 2: Calculate net profit returns
Quantifying returns requires translating all value creation into measurable numbers. Revenue-generating projects offer straightforward calculations, but internal improvements need proxy metrics to capture their impact.
Tangible gains provide direct financial impact:
- Increased sales revenue
- Reduced operational costs
- Eliminated software subscriptions
Quantifiable soft benefits require translation into numbers:
- Time savings: Hours saved × hourly rate × team size
- Faster delivery: Reduced cycle time × project value
- Improved quality: Decreased rework × cost per incident
Organizations gain visibility into these returns through unified dashboards that connect operational metrics to financial outcomes, making the “R” in ROI measurable and trackable.
Step 3: Apply the ROI equation
With accurate costs and returns identified, the calculation becomes straightforward. Here’s how it works in practice:
Marketing campaign example:
- Total Investment: $15,000 (ads) + $5,000 (agency) + $5,000 (internal labor) = $25,000
- Revenue Generated: $60,000 in new sales
- Net Profit: $60,000 – $25,000 = $35,000
- ROI Calculation: ($35,000 / $25,000) × 100 = 140%
This 140% ROI means the campaign generated $1.40 for every dollar invested.
How to calculate annualized ROI
Multi-year investments require annualized calculations to enable fair comparisons. The basic formula can make long-term projects appear deceptively attractive compared to short-term initiatives.
Annualized ROI Formula: [(1 + Total ROI) ^ (1 / Number of Years) – 1] × 100
For a project delivering 50% total ROI over 3 years, the annualized return equals approximately 14.5%. This normalized figure enables accurate comparison against annual benchmarks and alternative investments.
Why ROI measurement drives business success
ROI measurement separates organizations that guess from those that know. Here’s why it adds value to your business.
- Strategic planning becomes evidence-based: Leaders build roadmaps using historical returns to predict future performance. They populate plans with proven initiatives rather than hopeful experiments, reducing waste and accelerating growth.
- Performance accountability shifts from activity to outcomes: Instead of measuring hours worked or tasks completed, teams focus on value delivered. This drives ownership and engagement while eliminating low-value busywork.
- Decision-making speeds up across the organization: ROI data removes guesswork and endless debate. It gives leaders the clarity needed to commit resources confidently and adjust quickly when results don’t match expectations.
- Resource optimization happens naturally: When teams see which projects generate strong returns and which drain resources, reallocation becomes obvious. Budget flows toward high-performing areas while underperforming initiatives get restructured or eliminated.
How to interpret ROI results
Raw percentages mean nothing without context. A 10% ROI might represent failure for a risky venture but exceptional success for a stable infrastructure upgrade. Understanding whether your ROI is “good” requires you to consider multiple factors and industry benchmarks.
What is a good ROI?
Good ROI depends on three key factors: risk level, time horizon, and strategic importance. Organizations typically establish a “hurdle rate,” which is the minimum return required to justify investment risk.
Risk-based expectations:
- Low-risk operational improvements: 15-20% ROI often exceeds expectations
- High-risk initiatives: New product launches might target 200% or higher to offset potential failures
- Strategic investments: Long-term capability building might accept lower returns for competitive advantage
Context always trumps universal benchmarks. A 30% ROI on a two-week project differs vastly from 30% over three years. Similarly, returns that seem modest in isolation might be exceptional compared to industry averages or alternative investments.
Industry ROI benchmarks
Different sectors maintain distinct ROI expectations based on their operating models and risk profiles. Understanding these variations helps set realistic targets and evaluate performance accurately.
| Industry | Typical ROI range | Key considerations |
|---|---|---|
| Technology & SaaS | 30%+ | High scalability with significant upfront development costs |
| Manufacturing | 5–10% | Capital-intensive operations with depreciation impacting margins |
| Retail | 10–15% | Focus on inventory turnover and sales volume over margins |
| Marketing campaigns | 300–500% | Complex attribution and measurement challenges |
| Enterprise software | 150–250% | Longer implementation cycles but substantial efficiency gains |
Trends are more important than static benchmarks. Declining ROI over consecutive quarters signals market saturation or operational issues, prompting strategic adjustment.
Compare investment returns
Direct ROI comparison requires aligned risk profiles and time horizons. A 3-month marketing campaign cannot be meaningfully compared to a 2-year infrastructure project using ROI alone.
Consider these factors when comparing returns:
- Time to value: How quickly returns materialize
- Risk profile: Probability of achieving projected returns
- Strategic alignment: Contribution to long-term objectives
- Scalability: Potential for expanded returns over time
monday.com enables these comparisons through portfolio-level dashboards that normalize returns across different investment types, providing the context needed for informed decisions.
Try monday.comROI examples across business functions
ROI application varies significantly across departments, with each function defining “gain” and “cost” differently. These real-world examples demonstrate practical calculation approaches and show how different teams measure value creation within their specific contexts.
Marketing campaign returns
Marketing ROI focuses on attribution — connecting specific campaigns to revenue outcomes while accounting for multi-touch customer journeys.
Email automation platform example:
- Investment: $10,000 platform cost + $2,000 setup
- Direct sales generated: $50,000
- Time saved: 20 hours/month × $50/hour × 12 months = $12,000
- Total Return: $62,000
- Net Profit: $62,000 – $12,000 = $50,000
- ROI: ($50,000 / $12,000) × 100 = 417%
Technology investment ROI
Technology ROI balances efficiency gains against implementation costs, often requiring longer measurement periods to capture full value.
CRM implementation example:
- Annual cost: $50,000 (licenses + support)
- Sales cycle reduction: 20% faster closes
- Additional revenue from faster closes: $100,000/year
- ROI: ($100,000 – $50,000) / $50,000 × 100 = 100%
Employee development returns
Training ROI measures human capital improvement through retention, productivity, and performance gains.
Leadership workshop example:
- Workshop cost: $20,000
- Retention improvement: 2 fewer departures
- Replacement cost savings: $40,000
- ROI: ($40,000 – $20,000) / $20,000 × 100 = 100%
Process automation ROI
Automation ROI compounds over time as volume increases and manual effort decreases.
Invoice processing automation:
- Setup cost: $5,000
- Monthly time savings: 40 hours × $25/hour = $1,000
- Annual savings: $12,000
- First-year ROI: ($12,000 – $5,000) / $5,000 × 100 = 140%
Advanced ROI tracking methods
Static, quarterly ROI reports no longer meet the pace of modern business. Organizations need continuous visibility into returns as work happens, not months after projects conclude. The following advanced tracking methods provide real-time insights that enable proactive optimization and faster decision-making.
Real-time ROI dashboards
Live dashboards transform ROI from historical record to operational intelligence. Budget spend, project progress, and outcome metrics update continuously, revealing whether initiatives trend toward positive or negative returns.
This real-time visibility enables mid-project corrections. Instead of discovering problems in quarterly reviews, teams spot negative trends early and adjust before budgets are exhausted.
Cross-functional return measurement
Value creation rarely stays within departmental boundaries. A product update might reduce support tickets while increasing renewal rates — benefits that span engineering, support, and sales.
Unified platforms capture these distributed returns by connecting data across functions. When marketing, operations, and IT work in one system, ROI calculations draw from complete information rather than departmental fragments. This comprehensive view reveals true initiative value and prevents local optimization at organizational expense.
AI-powered ROI analysis
Artificial intelligence automates the heavy lifting of ROI measurement. Instead of manually gathering data and calculating returns, AI continuously analyzes performance and identifies insights. AI capabilities that enhance ROI tracking include:
- Predictive modeling: Forecast likely returns based on historical patterns
- Anomaly detection: Flag initiatives deviating from expected ROI
- Automated categorization: Classify costs and returns without manual tagging
- Insight generation: Find optimization opportunities from ROI trends
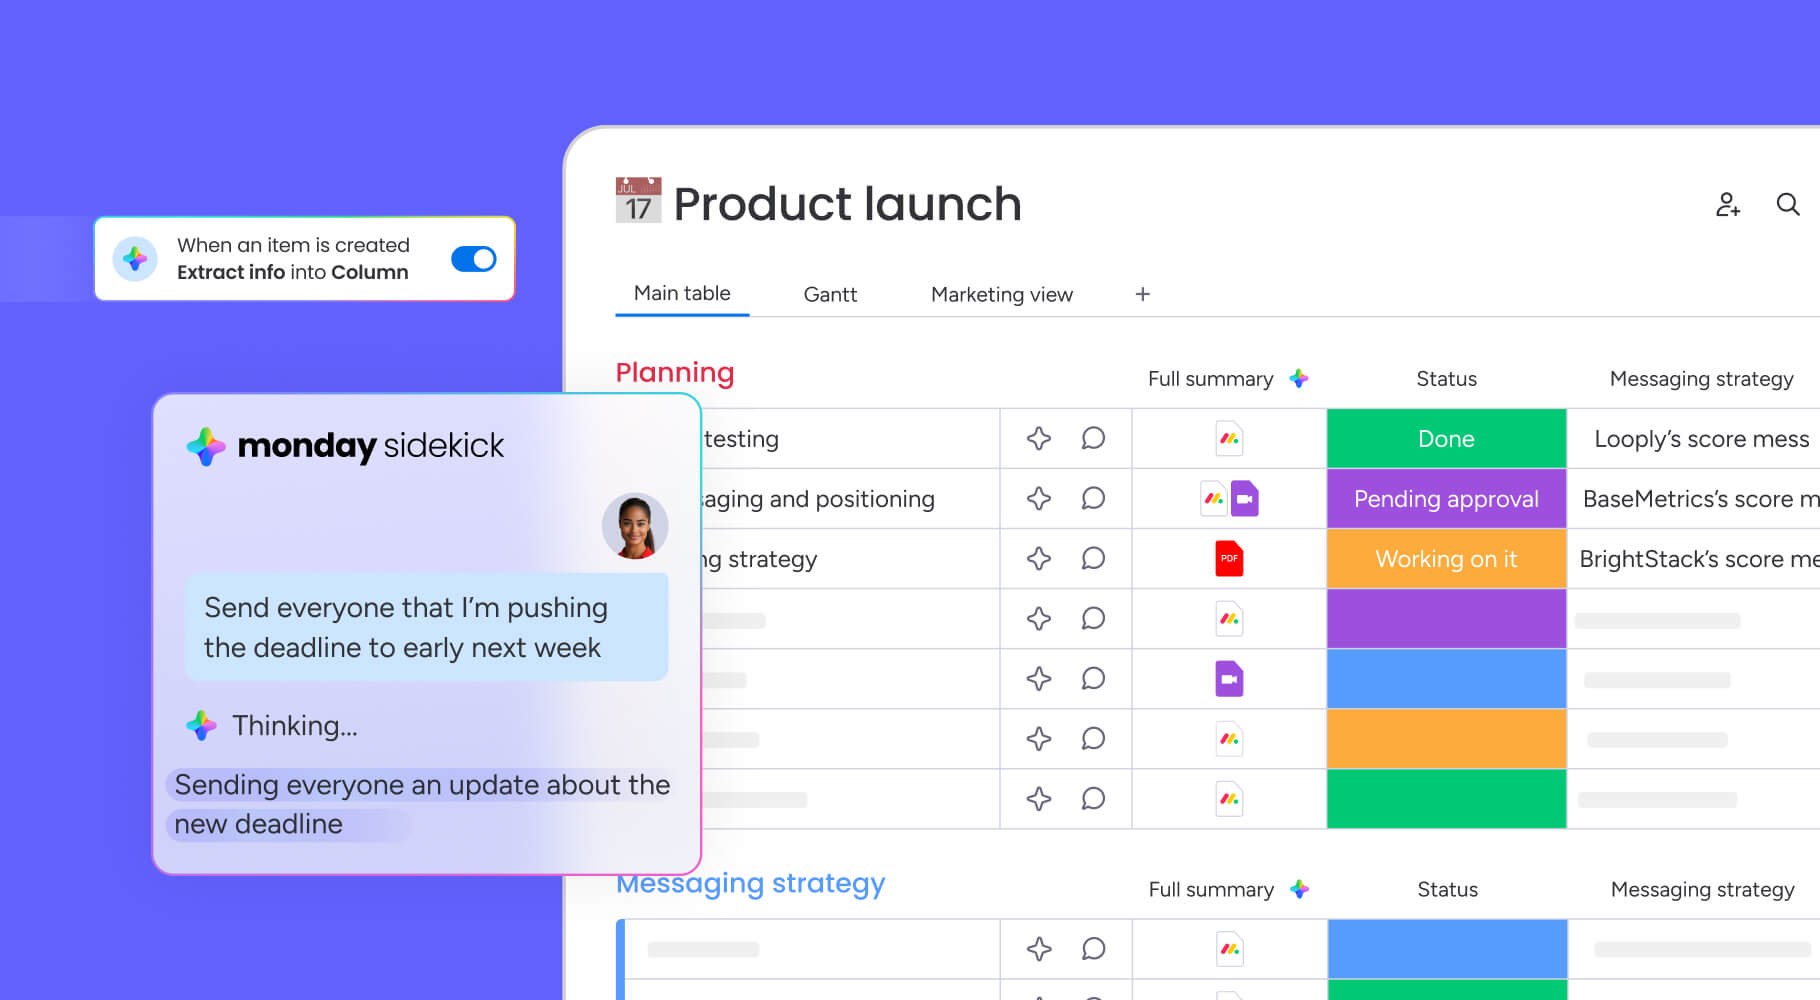
Teams using monday.com use AI Blocks to extract insights from project data, categorize expenses automatically, and summarize ROI trends for leadership review.
Portfolio-level performance tracking
Portfolio management features pull ROI data from hundreds of concurrent projects into unified views. Leaders compare returns across departments, identify underperformers, and reallocate resources toward higher-yield initiatives. This macro perspective keeps capital deployment in line with strategic priorities rather than departmental preferences.

7 proven strategies to maximize ROI
You can improve ROI in two ways: spend less or earn more. The best approach? Do both. Here are 7 strategies that deliver real results by making small improvements that add up over time.
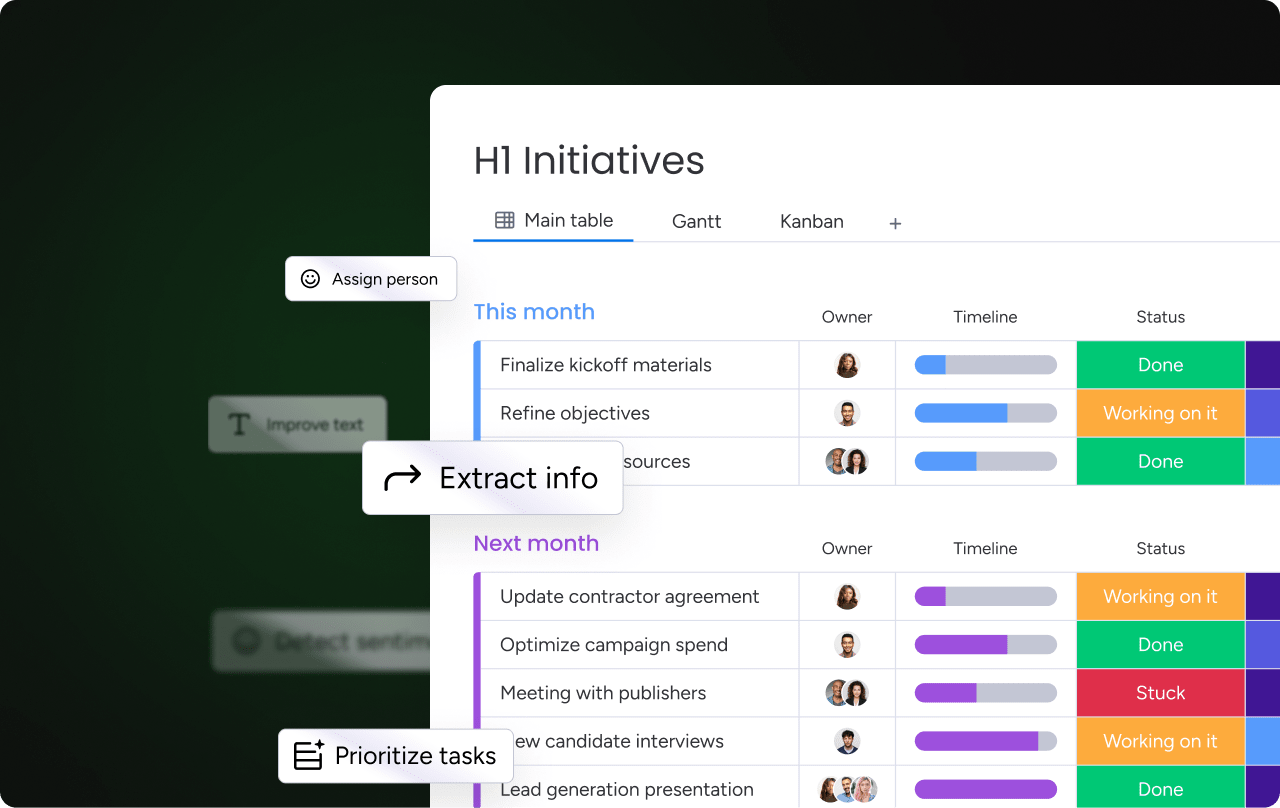
1. Optimize resource allocation
Misallocated talent destroys ROI when high-value employees spend time on low-impact work. Strategic resource optimization lets your best people focus on your most important initiatives.
Effective allocation requires understanding 3 elements:
- Current utilization: Who’s overloaded versus underutilized
- Skill alignment: Matching expertise to project needs
- Value contribution: Focusing talent on high-ROI work
2. Automate manual processes
Automation permanently reduces the investment side of ROI calculations. Every manual task automated is cost removed forever, improving returns on all related initiatives.
High-impact automation targets include:
- Status updates and reporting
- Approval workflows and handoffs
- Data entry and synchronization
- Meeting scheduling and follow-ups
Organizations using automated workflows report dramatic time savings that compound across teams and projects.
3. Enhance team collaboration
Collaboration friction creates hidden costs that erode ROI. When teams work in silos, duplicate effort and miscommunication waste resources that could generate value.
Centralized platforms reduce coordination overhead by keeping all work visible and connected. Information flows freely and decisions happen faster because teams spend less time searching for context. This efficiency improvement shows up as higher ROI across all collaborative projects.
4. Implement data-driven decisions
Intuition-based decisions carry higher failure risk than data-backed choices. Organizations that validate initiatives with historical performance data see higher average ROI and fewer write-offs.
Data-driven planning involves:
- Baseline measurement before changes
- Continuous tracking during execution
- Post-project analysis for learning
This systematic approach reduces project failure rates and improves resource allocation accuracy.
5. Reduce operational inefficiencies
Process inefficiencies accumulate into significant ROI drags. Regular optimization audits identify and eliminate waste that inflates costs without adding value.
Common efficiency improvements:
- Eliminating redundant approvals
- Standardizing repetitive workflows
- Consolidating overlapping platforms
- Streamlining communication channels
Each improvement might seem small, but the collective impact on ROI can be substantial.
6. Accelerate value delivery
Time affects ROI more than most teams realize. Projects delivering value in 3 months generate higher annualized returns than identical projects taking 12 months.
Acceleration strategies focus on:
- Parallel workstreams versus sequential phases
- Iterative delivery versus waterfall completion
- Automated handoffs versus manual transitions
Faster delivery means earlier returns and improved capital efficiency.
7. Scale high-return initiatives
Success should be replicated systematically. When specific project types demonstrate superior ROI, organizations should template and scale those approaches across teams.
Scaling requires:
- Documenting successful workflows
- Creating reusable templates
- Training teams on proven methods
- Monitoring scaled ROI performance
This systematic replication transforms one-time wins into sustainable competitive advantages.
ROI limitations
ROI provides powerful insights but has inherent limitations. Recognizing these constraints helps organizations use ROI appropriately alongside complementary metrics to make well-rounded business decisions.
Time value considerations
Basic ROI calculations treat all dollars equally, ignoring that money today is worth more than money tomorrow. This oversimplification can make long-term projects appear more attractive than they really are.
For multi-year investments, Net Present Value (NPV) provides more accurate assessment by discounting future cash flows. Organizations evaluating infrastructure projects or long-term initiatives should supplement ROI with NPV analysis to account for time value.
Intangible benefit challenges
Not everything valuable translates easily into numbers. Brand reputation, employee morale, and customer loyalty drive long-term success but resist simple quantification.
Organizations must balance ROI focus with qualitative assessment. Ignoring intangibles in favor of pure ROI optimization can lead to decisions that boost short-term returns while damaging long-term health. The key is using ROI as one input among several, not the sole decision criterion.
Risk assessment gaps
ROI assumes success without accounting for failure probability. A project promising 500% ROI sounds attractive until you consider its 90% failure rate, making expected return negative.
Risk-adjusted ROI calculations provide more realistic assessment by incorporating success probability. This approach prevents organizations from chasing high-return moonshots while ignoring reliable, moderate-return opportunities.
ROI vs other performance metrics
ROI works best when understood in relation to complementary metrics. Each measurement approach reveals different value dimensions and provides unique insights for decision-making.
| Metric | Definition | Best use case | Limitation |
|---|---|---|---|
| ROI | Measures efficiency relative to cost | General project evaluation | Ignores time value of money and risk |
| ROE | Measures return on shareholder equity | Corporate profitability analysis | Not suitable for evaluating individual projects |
| IRR | Estimates the annual growth rate of an investment | Multi-year capital projects | Complex to calculate and interpret |
| Payback period | Time required to recoup the initial investment | Liquidity and risk assessment | Ignores returns generated after payback |
| NPV | Calculates the present value of future cash flows | Long-term investment decisions | Requires assumptions about discount rate |
ROI vs ROE comparison
Return on Equity (ROE) measures company-wide profitability for shareholders, while ROI evaluates specific investments. ROE helps investors assess overall business performance. ROI helps managers evaluate individual initiatives.
ROI vs IRR analysis
Internal Rate of Return (IRR) calculates the annual growth rate that makes NPV equal zero. While ROI provides total return percentage, IRR accounts for time value, making it superior for comparing investments with different durations.
ROI vs payback period
Payback period answers when you’ll recover your investment, while ROI measures total return. Fast payback might be crucial for cash-constrained organizations even if total ROI is lower. These metrics work together to paint a complete picture.
How to measure ROI with monday.com
Most organizations struggle to connect daily work to financial outcomes. They know projects are happening, but can’t prove which paid off. monday.com changes this by turning every task, automation, and collaboration into measurable ROI data. Here’s how the platform transforms ROI measurement from guesswork into precision.
Track real costs automatically with time tracking and budget columns
Accurate ROI starts with knowing what you spent — not what you budgeted. monday.com’s time tracking captures exactly how many hours your team invests in each project, while budget columns track every dollar flowing out the door.
Instead of reconstructing costs months later from scattered spreadsheets, you see real-time investment totals that include labor, tools, and overhead. This eliminates the guessing that makes most ROI calculations worthless. When a project wraps, you know precisely what it cost down to the hour and the dollar.
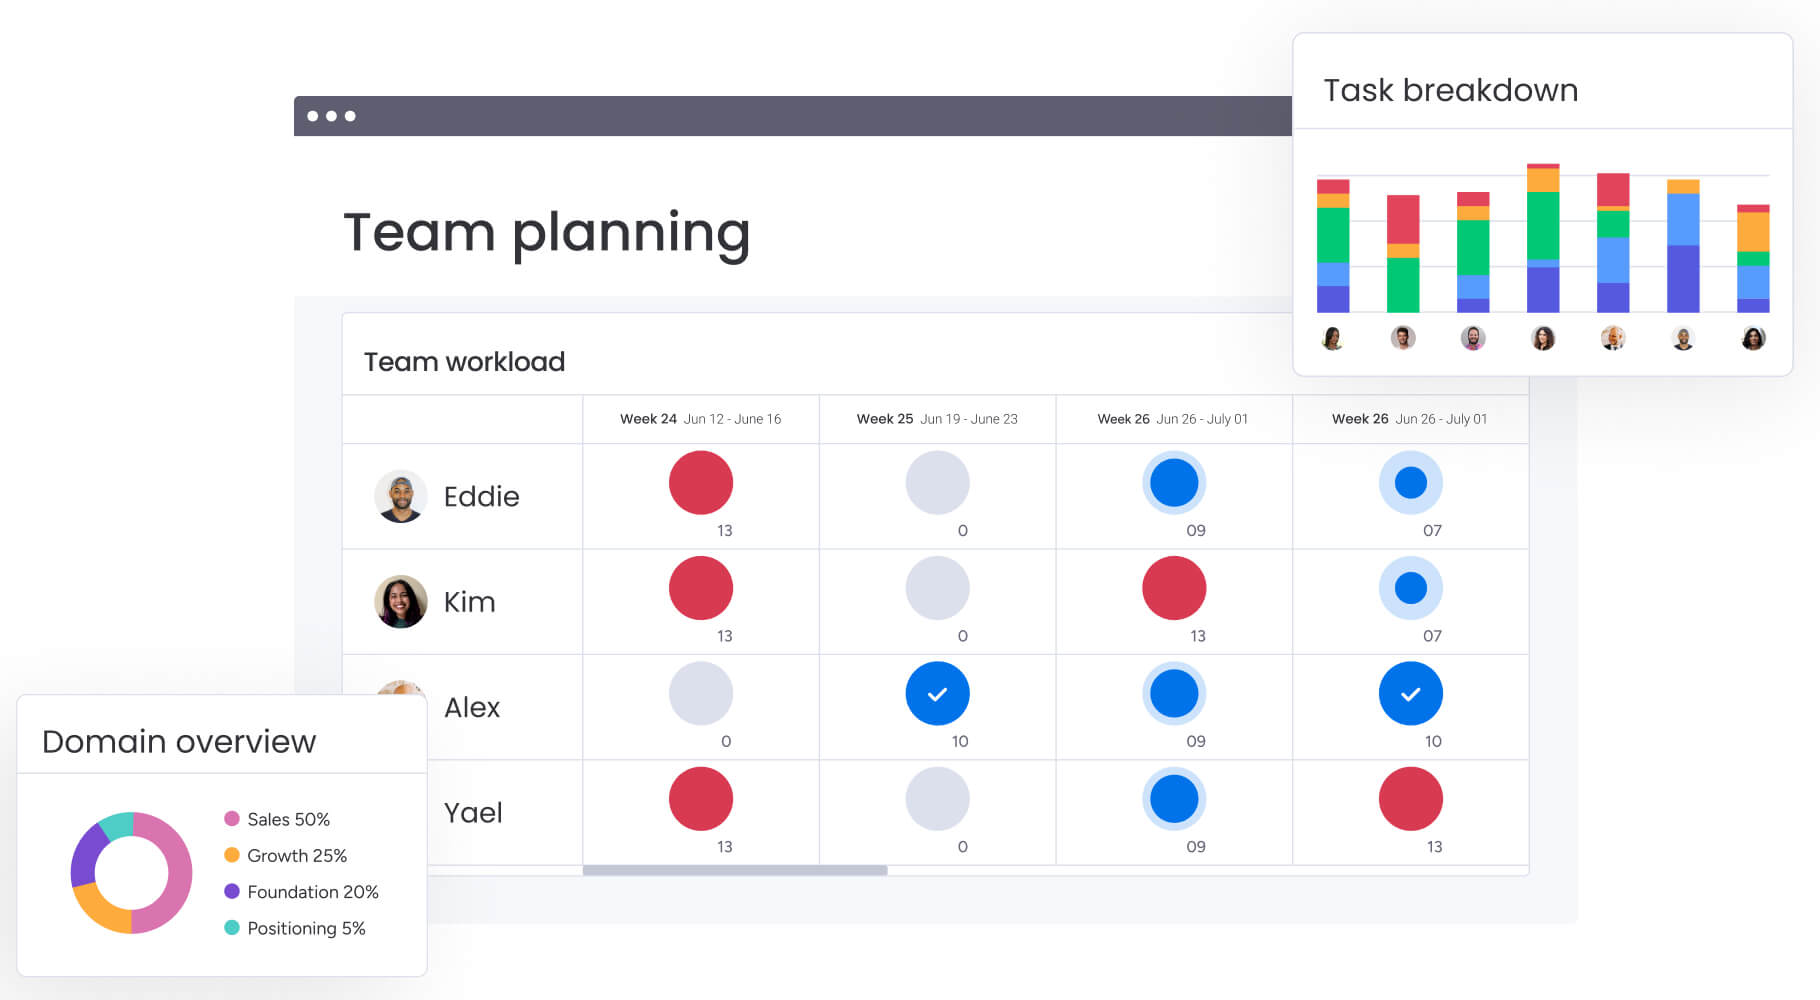
Measure productivity gains through workload view and capacity planning
ROI improves when your best people work on your highest-value projects. The Workload View shows exactly who’s overloaded and who has capacity, letting you reallocate talent before productivity tanks.
This visibility translates directly into ROI improvement. When you move a senior developer from low-impact maintenance to a revenue-generating feature, that reallocation shows up as higher returns. The platform quantifies these gains by connecting resource utilization to project outcomes, making productivity ROI measurable instead of theoretical.
Capture automation returns with workflow analytics
Every automation you build in monday.com creates permanent cost reduction. The platform’s automation analytics track exactly how many times each automation runs and how much time it saves.
Consider a status update automation that runs 200 times weekly and saves 3 minutes per instance. That’s 10 hours saved every week — quantifiable ROI that compounds forever. The platform calculates these savings automatically, giving you hard numbers that prove automation value and justify continued investment in efficiency.
Visualize distributed returns through cross-board dashboards
Value rarely stays in one department. A product launch might reduce support tickets, increase renewals, and accelerate sales cycles — benefits scattered across three teams. Traditional tools miss these distributed returns because they can’t see across silos.
monday.com’s dashboards pull data from every board, capturing ROI wherever it appears. When marketing’s campaign reduces support volume, the dashboard connects those dots automatically. This comprehensive view reveals true initiative value instead of departmental fragments, preventing scenarios where local optimization destroys organizational returns.
Optimize continuously with AI-powered insights and predictive analytics
Static ROI reports tell you what happened. AI tells you what’s about to happen and what to do about it. monday.com’s AI capabilities analyze patterns across your projects, flagging initiatives trending toward negative returns before budgets are exhausted.
This intelligence transforms ROI from historical record to operational advantage, letting you course-correct in real time instead of learning expensive lessons quarterly.
Transform ROI measurement into competitive advantage
monday.com provides the infrastructure for comprehensive ROI measurement and optimization. Unifying work processes and performance data in one platform transforms ROI from periodic calculation to continuous intelligence. Sign up for free today.
Try monday.comFrequently asked questions
What does 30% ROI mean?
A 30% ROI means that for every dollar invested, the project returned the original dollar plus an additional $0.30 in profit. This represents a gain of 30% above the initial investment cost.
Is 50% ROI considered good?
A 50% ROI is generally excellent for most business investments, significantly exceeding typical market returns. However, "good" depends on factors like risk level, time horizon, and industry standards — high-risk ventures might require higher ROI to justify the uncertainty.
How often should companies calculate ROI?
Companies should calculate ROI continuously for ongoing initiatives and at completion for discrete projects. Centralized work management platforms enable real-time ROI tracking, moving beyond traditional quarterly or annual calculations to provide continuous performance visibility.
What's the difference between ROI and profit margin?
ROI measures the efficiency of a specific investment relative to its cost, while profit margin measures the percentage of revenue remaining after expenses. ROI evaluates investment performance; profit margin evaluates operational efficiency.
Can ROI be negative?
Yes, negative ROI indicates the investment lost money, returning less than its original cost. A -20% ROI means you lost $0.20 for every dollar invested, signaling the investment destroyed rather than created value.
How do you calculate ROI for employee training?
Employee training ROI is calculated by measuring performance improvements, retention gains, and productivity increases against training costs. For example, if $10,000 in training reduces turnover and saves $25,000 in replacement costs, the ROI equals 150%.