
Assumptions form the foundation of every business plan and project timeline. When those assumptions prove wrong, the consequences can range from minor delays to major budget overruns. The challenge is not just identifying what could go wrong, but focusing limited resources on the threats that matter most.
This is where a risk matrix provides critical structure. It is a simple visual platform that helps you prioritize threats based on their probability and potential impact, turning abstract worries into a defined action plan.
This guide covers how to build and use a risk matrix effectively. We will explore the essential components, walk through the steps to create your own, and show how to apply this framework to project planning, compliance, and strategic decisions.
Try monday work managementKey takeaways
• Prioritize with precision: A risk matrix is a visual grid that prioritizes risks by plotting likelihood against impact, transforming overwhelming worry lists into defined, actionable priorities that guide resource allocation.
• The most effective risk matrices use specific likelihood criteria and impact scales tailored to your organization’s actual capacity, with 5×5 matrices providing the best balance of detail and usability for most teams.
• Building a comprehensive risk matrix requires seven systematic steps: defining categories, setting criteria, establishing scales, creating templates, mapping risks, calculating scores, and planning response strategies.
• Organizations should assess nine critical risk types including operational, financial, strategic, compliance, technology, reputational, market, project management, and cybersecurity threats to ensure comprehensive coverage.
• Dynamic risk management: monday work management elevates static risk matrices into dynamic, integrated workflows that automatically update risk scores based on real project data, providing real-time visibility and AI-powered insights that help teams spot patterns and predict emerging threats..
What is a risk matrix?
A risk matrix is a grid that shows you which risks need attention first by comparing how likely they are to happen against how much damage they could cause. Think of it as a visual map that transforms endless worry lists into actionable priorities. The primary goal is to identify a project’s risk profile and communicate it, enabling informed decision making to lessen the impact of risks on project objectives like budget and schedule.
You plot each risk on the grid based on two factors: likelihood (will this probably happen?) and impact (how bad would it be?). The result gives you a color-coded view of what needs immediate action versus what you can monitor over time.
Risk matrices go by several names — risk assessment matrix, probability impact matrix, or risk rating matrix. They all serve the same purpose: helping you make objective decisions about where to focus your limited time and resources.
Essential components of risk assessment matrices
Every risk matrix relies on three building blocks that work together to create meaningful assessments. Understanding each component helps you build matrices that actually guide decisions instead of just filling compliance requirements.
Let’s take a look at them in detail:
Likelihood scales
Likelihood measures how probable a risk is within your planning timeframe. Most organizations use a 1-5 scale where 1 means “almost never happens” and 5 means “almost certain to occur.”
You need specific definitions for each level. For instance, “likely” might mean 60-80% chance within the next year, based on your historical data or industry trends.
Impact levels
Impact captures what happens if the risk becomes reality. You measure this across dimensions that matter to your business — financial loss, operational downtime, customer relationships, or regulatory penalties.
A high-impact event for a startup might be a $50,000 loss. For an enterprise, that same threshold could be $5 million. Your impact scale should reflect your organization’s actual capacity to absorb losses.
Risk scoring systems
Multiply likelihood by impact to get your risk score. A risk with likelihood 4 and impact 5 scores 20 — putting it in your highest priority category.
This simple math creates objective rankings. Instead of arguing about which risk matters more, you can point to the scores and allocate resources accordingly. monday work management automates these calculations, updating scores as conditions change.
Types of risk matrices for different needs
Your choice of matrix format shapes how effectively you can manage project risks. Each type balances detail against usability, helping you match the platform to your specific needs.
| Matrix type | Grid size | Best for | Level of complexity |
|---|---|---|---|
| 3x3 Risk matrix | 9 cells | Quick assesments, small teams | Low |
| 5x5 Risk matrix | 25 cells | Standard business use, most projects | Medium |
| Probability Impact Matrix | Variable | Financial modeling, compliance needs | High |
3×3 Risk matrix
The 3×3 matrix gives you nine boxes using simple low, medium, and high ratings. This format works when you need quick decisions or when your team is just starting with formal risk assessment.
You can complete a 3×3 assessment in minutes, making it perfect for weekly team meetings or initial project scoping. The tradeoff is less nuance — you might group risks together that deserve different responses.
5×5 Risk matrix
Most organizations choose the 5×5 matrix because it provides enough detail to make meaningful distinctions without overwhelming users. With 25 cells, you can separate “medium-high” risks from “high” risks and create specific protocols for each zone.
The 5×5 format supports color coding that instantly communicates priority levels. Red zones demand immediate action, yellow zones need monitoring, and green zones can wait.
Probability and impact matrix
Advanced teams use numerical probability and impact values instead of categories. You might assess probability as a percentage and impact in actual dollar amounts.
This approach supports sophisticated risk analysis like Monte Carlo simulations and sensitivity testing. monday work management handles these complex calculations while keeping the visual presentation simple enough for executive reviews.
Try monday work managementHow to create a risk matrix in 7 steps
Building an effective risk matrix requires more than drawing a grid. Follow these steps to create a system that drives real decisions and improves over time.
Step 1: Define risk categories
Start by identifying which types of risks you need to track. Your categories should match your business context and cover all major threat areas. Grouping threats into logical categories helps ensure comprehensive coverage and makes the assessment process more manageable. The following common categories provide a solid foundation for most businesses:
- Operational: equipment failures, supply chain issues, process breakdowns
- Financial: Budget overruns, currency fluctuations, credit risks
- Strategic: Market shifts, competitive threats, technology changes
- Compliance: Regulatory violations, audit findings, legal issues
Customize these based on your industry. A hospital focuses on patient safety risks while a software company prioritizes cybersecurity threats.
Step 2: Set likelihood criteria
Create specific definitions for each probability level. Vague terms like “possible” or “probable” mean different things to different people.
Instead, use concrete criteria. “Very likely” might mean: “Has occurred 3+ times in the past year” or “Current indicators suggest 80%+ probability in next quarter.”
Step 3: Establish impact scales
Define what each impact level means for your organization. Consider multiple dimensions beyond just financial loss:
- Financial: Direct costs, lost revenue, recovery expenses
- Operational: Downtime hours, productivity loss, delivery delays
- Reputational: Customer trust, media coverage, brand damage
Set thresholds that reflect your actual business capacity. A week of downtime might be catastrophic for an e-commerce site but manageable for a consulting firm.
Step 4: Build your risk matrix template
Create your visual grid with clear labels and color coding. Your template needs fields for risk descriptions, owners, and mitigation plans — not just the likelihood and impact ratings.
monday work management provides customizable templates that standardize this process. You can build once and reuse across all projects, ensuring consistency while allowing team-specific adaptations.
Step 5: Identify and map risks
Gather your team to brainstorm potential risks. Use structured techniques like SWOT analysis or process mapping to ensure comprehensive coverage.
Plot each risk on your matrix based on the criteria you established. This collaborative approach captures risks that individuals might miss and builds team buy-in for the results.
Step 6: Calculate risk scores
Apply your scoring formula to rank risks objectively. The basic calculation (likelihood × impact) works for most situations, but you can add sophistication as needed.
Some teams weight certain risk categories more heavily or factor in detection difficulty. Whatever method you choose, document it clearly and apply it consistently.
Step 7: Plan response strategies
Match your response to each risk’s position on the matrix. High-likelihood, high-impact risks need immediate action while low-scoring risks might only need periodic monitoring. Your four main response options are:
- Avoid: Eliminate the risk source entirely
- Mitigate: Reduce likelihood or impact through controls
- Transfer: Shift risk via insurance or contracts
- Accept: Monitor without active intervention
Document who owns each response and when they’ll report progress.
When to use risk assessment matrices
Risk matrices deliver the most value in specific situations where systematic assessment improves outcomes. Knowing when to deploy this approach helps you invest effort where it counts.
Project planning and management
Every project faces uncertainties that could derail timelines or budgets. Risk matrices help you spot these threats early and build contingency plans before problems emerge.
Integrate risk assessment into project kickoffs, phase gates, and regular reviews. When risk thinking becomes part of your project rhythm, teams naturally consider potential issues in their planning.
Compliance and regulatory reviews
Regulated industries need documented risk assessment processes. Risk matrices provide the paper trail auditors expect while actually improving your risk management — not just checking boxes.
Your matrices demonstrate due diligence and systematic thinking. They show regulators you take compliance seriously and have processes to identify and address violations before they occur.
Strategic business decisions
Major decisions deserve structured risk analysis. Whether you’re entering new markets, launching products, or restructuring operations, risk matrices help you weigh opportunities against threats, such as balancing the potential of AI against security concerns cited by 52% of large enterprises as a key barrier to adoption.
Executive teams can quickly grasp visual risk summaries that would take pages to explain in text. This shared understanding speeds decision-making and improves alignment on risk tolerance.
Risk matrix examples across industries
Different industries adapt risk matrices to their specific contexts and challenges. These examples show how the basic framework flexes to meet diverse needs:
healthcare organizations map patient safety risks like medication errors and infection rates against regulatory penalties and patient harm. Their matrices emphasize prevention and rapid response protocols.
Construction companies track safety incidents, weather delays, and material shortages. They use historical data from past projects to set realistic likelihood estimates.
Technology firms focus on data breaches, system outages, and intellectual property theft. Their matrices often include automated monitoring that updates risk scores based on threat intelligence.
Financial services balance market volatility, credit defaults, and regulatory changes. They typically use sophisticated probability models but still present results in simple visual matrices for board reporting.
Try monday work managementRisk matrix calculation methods
Understanding the math behind risk matrices helps you choose appropriate methods for your situation. Start simple and add complexity only when it improves decision-making.
Probability impact matrix formulas
The foundation formula — Risk Score = Probability × Impact — works for most organizations. If a risk has probability 3 and impact 4, it scores 12.
You can enhance this basic approach by adding weights for different factors. Maybe compliance risks get a 1.5x multiplier because of your regulatory environment. Or you factor in detection difficulty — risks that are hard to spot early get higher scores.
Risk scoring matrix techniques
Advanced teams use several techniques to refine their assessments:
- Weighted scoring: Assign importance factors to different risk categories
- Time-based adjustments: Increase scores for risks likely to occur soon
- Confidence intervals: Show ranges instead of single scores when uncertainty is high
monday work management supports these calculations through custom formulas and automated workflows. You define the logic once, then let the system handle the math as teams input new risks.
9 critical risks to watch out for
Comprehensive risk assessment requires looking across all areas where threats could emerge. These nine categories cover the most common risks organizations face:
1. Operational risks
These threaten your daily ability to deliver products or services. Think equipment breakdowns, supplier failures, or key employee departures.
2. Financial risks
Money troubles come in many forms — cash flow crunches, bad investments, or unexpected costs that blow your budget.
3. Strategic risks
Your long-term plans face threats from new competitors, changing customer preferences, or emerging technologies that make your approach obsolete.
4. Compliance risks
Regulations change constantly. Missing new requirements or failing audits can trigger fines, restrictions, or legal battles.
5. Technology risks
System crashes, cyber attacks, and outdated software can paralyze modern businesses that depend on technology for everything.
6. Reputational risks
Social media amplifies every mistake. One bad customer experience or employee incident can spiral into a PR crisis overnight.
7. Market risks
Economic downturns, industry disruptions, and shifting demand patterns threaten revenue and growth plans.
8. Project management risks
Scope creep, resource conflicts, and missed deadlines plague projects across every industry and department, which helps explain why 82% of employees now rely on work management software to track tasks and collaborate. This is why prioritizing enterprise risk management is a key focus for 42% of CFOs in 2025, right alongside cost optimization and digital transformation.
9. Cybersecurity risks
Data breaches and ransomware attacks grow more sophisticated daily, threatening both operations and customer trust.
Learn more: Risk breakdown structure
Key benefits of risk matrices for organizations
Risk matrices deliver value beyond just identifying threats. They transform how organizations think about and respond to uncertainty. Here’s what effective risk matrix implementation enables:
- Objective prioritization: Replace gut feelings with data-driven rankings that everyone can understand and support
- Resource optimization: Focus limited budgets and attention on risks that truly threaten your objectives
- Improved communication: Give executives and boards instant visibility into risk status without lengthy reports
- Regulatory confidence: Demonstrate systematic risk management that satisfies auditors and regulators
- Strategic alignment: Connect risk management to business goals instead of treating it as a separate compliance exercise
These benefits compound over time as teams get comfortable with risk-based thinking and decision-making.
Try monday work managementHow to elevate risk management with monday work management
Static spreadsheet matrices quickly become outdated and disconnected from actual work. monday work management brings risk assessment to life through dynamic, integrated workflows that evolve with your business.
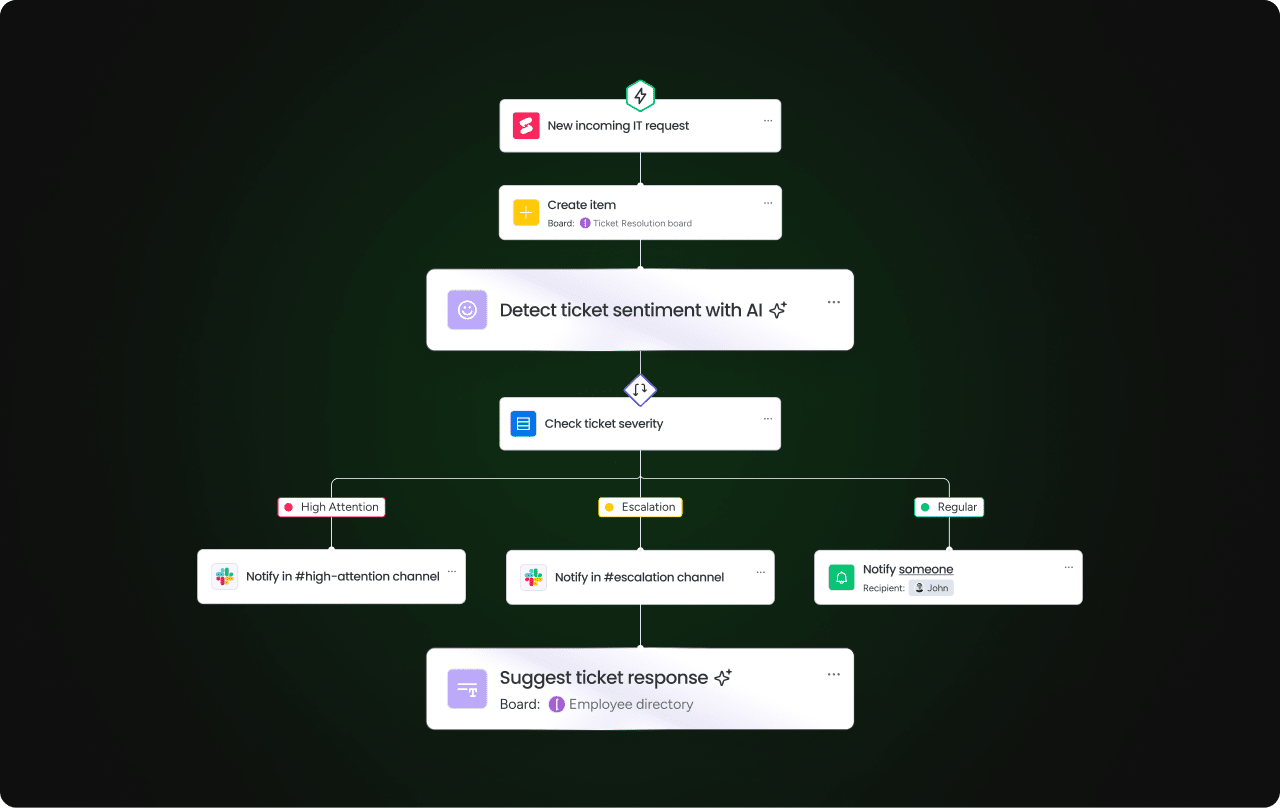
The platform automates risk tracking by connecting assessments directly to project data. When project conditions change, risk scores update automatically. You see emerging threats in real-time instead of discovering them during quarterly reviews.
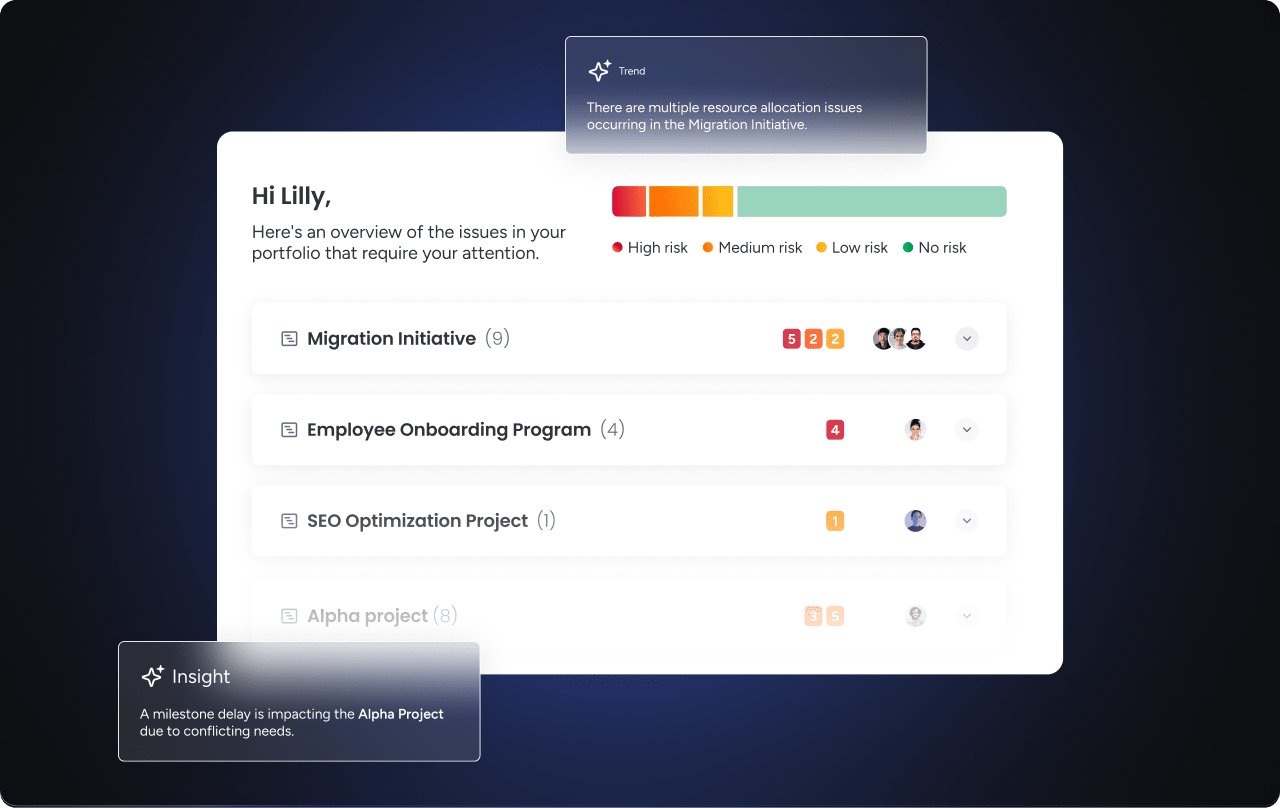
Visual dashboards transform complex risk data into clear insights. Executives can check risk status across the entire portfolio while project managers drill into specific threats. Everyone works from the same live data, eliminating version control issues and conflicting reports.
AI-powered analysis takes risk management further by identifying patterns humans might miss. The system can flag unusual risk combinations, predict which threats are most likely to materialize, and suggest mitigation strategies based on what worked in similar situations.
If you’re at the stage to move beyond static matrices, try monday work management to build risk assessment into your daily workflows
Frequently asked questions
How often should organizations update their risk assessment matrices?
Organizations should update risk assessment matrices at least quarterly and whenever major changes occur in the business environment. Regular updates keep assessments relevant to current conditions, emerging threats, and shifting priorities.
What makes a 5x5 risk matrix more effective than a 3x3 risk matrix?
A 5x5 risk matrix provides 25 cells compared to just 9 in a 3x3 matrix, allowing more precise risk categorization. This granularity helps teams distinguish between risks that need different response strategies and avoid grouping together threats that deserve unique treatment.
Can risk matrix processes be automated with work management software?
Yes, modern work management platforms can automate risk scoring calculations, visual matrix generation, and alert notifications. Automation ensures consistent assessment methods, reduces manual effort, and provides real-time risk visibility across projects and departments.
How should teams present risk matrices to executive stakeholders?
Teams should present risk matrices to executives using visual dashboards that highlight the highest-priority risks with clear business context. Focus on strategic implications and required decisions rather than technical risk details, using color coding and simple graphics for quick comprehension.
Which software platforms work best for creating and managing risk matrices?
Work management platforms like monday work management excel at risk matrix creation through customizable templates and automated calculations. These platforms integrate risk assessment with project workflows, ensuring risk management happens alongside daily work rather than in isolation.
What risk matrix size should small project teams use?
Small project teams should typically use 3x3 risk matrices for simplicity and quick assessment. This size provides sufficient risk categorization for most small-scale projects while avoiding unnecessary complexity that could slow down decision-making.