Project performance often looks healthy on the surface, yet budget overruns, delayed delivery, and misaligned priorities tell a different story when results are reviewed at a strategic level. Task completion and hours logged show activity, but they rarely explain whether projects are delivering real business value.
KPIs for project management bridge this gap by linking execution to outcomes. Rather than reporting what already happened, the right indicators highlight risk early, reveal inefficiencies, and show how work contributes to broader organizational goals.
In the sections below, this article will explores the KPIs that matter most in 2026, how to balance leading and lagging indicators, and how teams can build KPI frameworks that support smarter decisions, stronger alignment, and sustained delivery performance.
Key takeaways
- KPIs for project management must connect execution to strategy: Effective indicators link daily tasks and milestones to measurable business outcomes rather than isolated activity metrics.
- Balancing leading and lagging KPIs improves decision-making: Predictive signals such as risk trends and velocity should complement historical metrics like budget variance and delivery performance.
- A structured KPI framework prevents measurement overload: Focusing on a limited set of action-driven indicators reduces noise while improving clarity and accountability.
- Cross-project KPI alignment strengthens portfolio visibility: Consistent definitions and roll-up reporting ensure individual projects contribute meaningfully to organization-wide goals.
- Work management platforms enhance KPI accuracy and visibility: Solutions like monday work management centralize data, automate tracking, and surface insights in real time across teams and portfolios.
What are project management KPIs?
Project management KPIs are measurable indicators that show how effectively a project supports real business goals. Metrics capture activity. KPIs reveal impact.
There’s a big difference between tracking data and understanding performance. “Hours worked” tells you how busy a team is. “Resource utilization rate” tells you whether capacity is being used wisely. “Money spent” shows cost. “Cost performance index” shows efficiency.
That’s why KPIs matter. They help you decide what to adjust, where to invest, and when to step in. Metrics report the past. KPIs shape what happens next.
Great KPIs have a few things in common that set them apart from regular metrics:
- Strategic alignment: They directly correlate with broader organizational goals, ensuring project success translates to business success.
- Decision-driving: Great KPIs provide actionable insights that prompt specific interventions, rather than just reporting history.
- Time-bound: They measure progress over specific periods, allowing for trend analysis and forecasting.
- Quantifiable: They rely on objective data rather than subjective feelings, reducing bias in performance evaluation.
Why project management KPIs matter for business success
Smart KPI tracking does more than make projects run smoothly. Pick the right indicators, and you’ll stop putting out fires and start preventing them, protecting revenue and speeding up delivery.
KPIs act as a translation layer between the C-suite and project teams. They ensure daily workflows connect directly to quarterly business objectives like market penetration or customer retention. Without this connection, teams can stay busy without moving the business forward.
Here’s what happens when you track KPIs consistently:
- Risk mitigation: Effective indicators function as an early warning system. By tracking variance and trends, managers identify potential bottlenecks or budget overruns weeks before they become critical, allowing course correction while options remain open.
- Resource optimization: Data-driven insights replace gut feelings when allocating talent. KPIs reveal exactly where teams are overcapacity or underutilized, enabling leaders to balance workloads dynamically and prevent burnout while maximizing output.
- Stakeholder confidence: Transparent, consistent reporting builds trust with clients and executives. When stakeholders see objective data regarding progress and health, anxiety decreases and conversations shift from status checks to strategic problem-solving.
KPIs act as a translation layer between the C-suite and project teams. They ensure daily workflows connect directly to quarterly business objectives like market penetration or customer retention. Without this connection, teams can stay busy without moving the business forward.
How to select the right KPIs for your projects
You can’t track everything. Pick what matters most. Tracking too many metrics leads to analysis paralysis, while tracking too few creates blind spots.
Follow this practical four-step framework below to ensures you select KPIs that drive value.
Step 1: Align with business objectives
The selection process begins by reviewing organizational strategy. For example, if the company’s primary goal is customer retention, project KPIs should weigh heavily on quality and satisfaction scores rather than just speed of delivery.
Step 2: Consider project complexity and type
A creative marketing campaign requires different measurements than a construction project. Agile software projects prioritize velocity and cycle time, while waterfall infrastructure projects prioritize schedule variance and critical path adherence.
Step 3: Balance leading and lagging indicators
You need both: data that predicts what’s coming and data that confirms what happened. Leading indicators like backlog growth predict future performance, while lagging indicators like final budget variance confirm past results. If you only track what already happened, you’re always one step behind.
Step 4: Ensure measurability and actionability
Every selected KPI must be reliably measurable with available data. Furthermore, the data must be actionable. If a metric changes, the team should know exactly what levers to pull to correct it.
Before you lock in your KPIs, ask yourself:
- Does this metric directly relate to a key strategic goal?
- Can we collect this data automatically, or does it require manual entry?
- If this number goes down, do we know how to fix it?
- Will sharing this metric motivate the right behaviors in the team?
Top project management KPIs that define performance
Strong KPI tracking looks at performance from every angle, not just deadlines or budget. To make this practical, these KPIs are grouped into five categories that reflect the full picture of project health: schedule, financials, quality, resources, and long-term business impact.
Each category highlights a different dimension of performance, so blind spots don’t turn into surprises.
Schedule and timeline KPIs
These metrics show whether you’ll hit your deadlines, and help you spot delays before they happen. Schedule KPIs answer one question: Will you deliver on time?
- On-time completion rate: The percentage of projects or milestones delivered on or before the deadline
formula: (projects completed on time / total projects) × 100. - Schedule variance (SV): A quantitative measure of whether a project is ahead or behind the planned schedule
formula: earned value (EV) – planned value (PV). - Cycle time: The total time elapsed from the start of a task to its completion
formula: end date – start date. - Milestone achievement rate: The percentage of planned milestones successfully met on the original schedule
formula: (milestones met / total milestones) × 100
Budget and financial KPIs
Financial KPIs keep projects profitable and on budget. They protect your margins and prove the project was worth the investment.
- Budget variance: The difference between the baseline budget and actual costs incurred
formula: actual cost – budgeted cost. - Cost performance index (CPI): A ratio measuring the financial efficiency of a project
formula: earned value (EV) / actual cost (AC). - Return on investment (ROI): The financial return generated relative to the cost of the project
formula: ((project benefits – project costs) / project costs) × 100. - Earned value (EV): The budgeted cost of the work that has actually been performed
formula: % of work completed × budget at completion (BAC).
Quality and performance KPIs
These metrics measure quality and whether stakeholders are happy with what you delivered. Quality KPIs ensure that speed never comes at the expense of excellence.
- Customer satisfaction score (CSAT): A quantified measure of stakeholder or client satisfaction with project deliverables.
- Defect density rate: The number of confirmed defects relative to the size of the deliverable
formula: total defects / size of module. - Deliverable quality score: A composite score based on acceptance criteria met during the review phase.
Resource and team KPIs
These KPIs track your team’s workload and morale, keeping productivity high without burning people out. They help you get more done without running your team into the ground.
- Resource utilization rate: The percentage of available employee time spent on productive, billable, or strategic work
formula: (productive hours / total available hours) × 100. - Team productivity index: A measure of output relative to input, adjusted for project complexity.
- Employee satisfaction score: A measure of team morale and engagement with the project work.
Strategic value KPIs
These metrics measure what happens after the project wraps, the real business impact. Strategic KPIs answer whether the project was worth it.
- Benefits realization rate: The percentage of projected strategic benefits actually achieved after project completion
formula: (actual benefits / projected benefits) × 100.
Leading vs lagging KPI indicators in project management
Strong KPI strategies do not rely on hindsight alone. They combine forward-looking signals with historical results, so performance is both predictable and measurable.
Leading indicators highlight momentum. They show patterns, risks, and behavioral shifts that hint at what is likely to happen next. Lagging indicators confirm outcomes. They validate whether targets were met and whether financial or delivery goals were achieved.
The table below compares common examples of each type and clarifies the role they play in decision-making.
| Leading indicators | Purpose | Lagging indicators | Purpose |
|---|---|---|---|
| Risk register updates | Predicts future stability based on identified threats | Budget variance | Reports financial performance after spend occurs |
| Team velocity trends | Forecasts delivery dates based on current speed | Customer satisfaction | Measures the final reception of the deliverable |
| Backlog growth rate | Anticipates resource bottlenecks | Return on investment | Calculates the ultimate value generated |
| Stakeholder engagement | Predicts adoption and approval speed | On-time completion | Records historical reliability |
Looking at both together creates context. For example, budget variance might show zero deviation today, suggesting financial stability. At the same time, risk register updates could reveal a surge in high-impact technical risks. That contrast signals stability on paper, but potential disruption ahead.
How to build a connected KPI framework across departments
Project KPIs don’t work in isolation. They need to connect to company-wide goals if you want real impact. A connected framework links company goals to individual projects, so every win moves the business forward.
The three-tier KPI framework addresses this challenge by creating explicit connections between organizational strategy and daily execution:
- Strategic level: High-level organizational KPIs, such as Annual Recurring Revenue or Market Share. Projects are authorized specifically to move these needles.
- Portfolio level: Metrics that apply across groups of projects, focusing on resource allocation, portfolio risk, and overall ROI. They help the PMO balance the mix of initiatives.
- Project level: Granular performance measures, like schedule variance and task completion, that individual teams track daily.
Alignment doesn’t happen by accident. Here’s how to keep departments aligned without killing flexibility:
- Standardize definitions: Ensure “completed” means the same thing to the engineering team as it does to the marketing team.
- Automate data collection: Remove manual reporting friction to ensure data accuracy across departments.
- Regular review cycles: Schedule quarterly reviews to ensure project KPIs still align with shifting company strategy.
- Unified visibility: Use a single source of truth where leadership can drill down from a strategic KPI to the contributing project metrics.
Leveraging AI for predictive KPI analysis
AI shifts KPI tracking from static reporting to intelligent forecasting. Instead of simply calculating variances after the fact, it analyzes patterns across projects and surfaces risks before they escalate.
Imagine spotting a project heading off track before a deadline slips or a budget overruns. By connecting data points that traditional reporting treats separately, AI uncovers early signals that would otherwise go unnoticed.
Here’s how AI makes KPI management smarter:
- Pattern recognition: AI analyzes historical project data to identify systemic trends, such as a tendency for specific teams to underestimate timeline requirements during certain seasons.
- Risk prediction: By correlating data points like communication frequency, task complexity, and resource load, AI creates early warning systems that flag at-risk projects before deadlines are missed.
- Automated categorization: AI automatically tags and sorts unstructured project data, ensuring KPIs are calculated based on accurate, comprehensive inputs without manual effort.
- Predictive modeling: Algorithms forecast future project outcomes based on current velocity and historical performance, allowing for more accurate expectation setting.
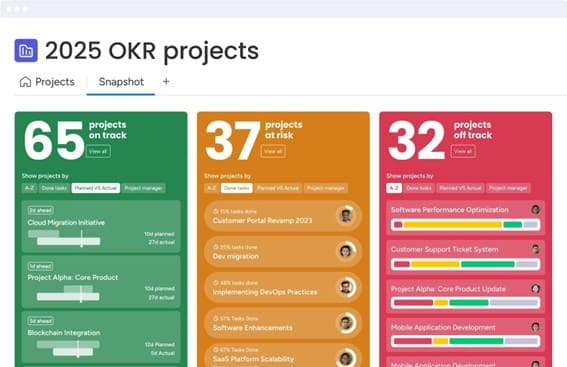
Organizations leveraging intelligent solutions like monday work management can use Portfolio Risk Insights to scan all project boards, quickly flagging potential risks by severity. The platform generates instant alerts as new risks emerge, helping teams stay ahead of problems rather than reacting after damage is done.

Scaling KPI tracking with monday work management
As teams grow, KPI tracking becomes harder to manage manually. Spreadsheets multiply, reporting slows down, and cross-department visibility starts to break. What worked for 10 people rarely works for 200.
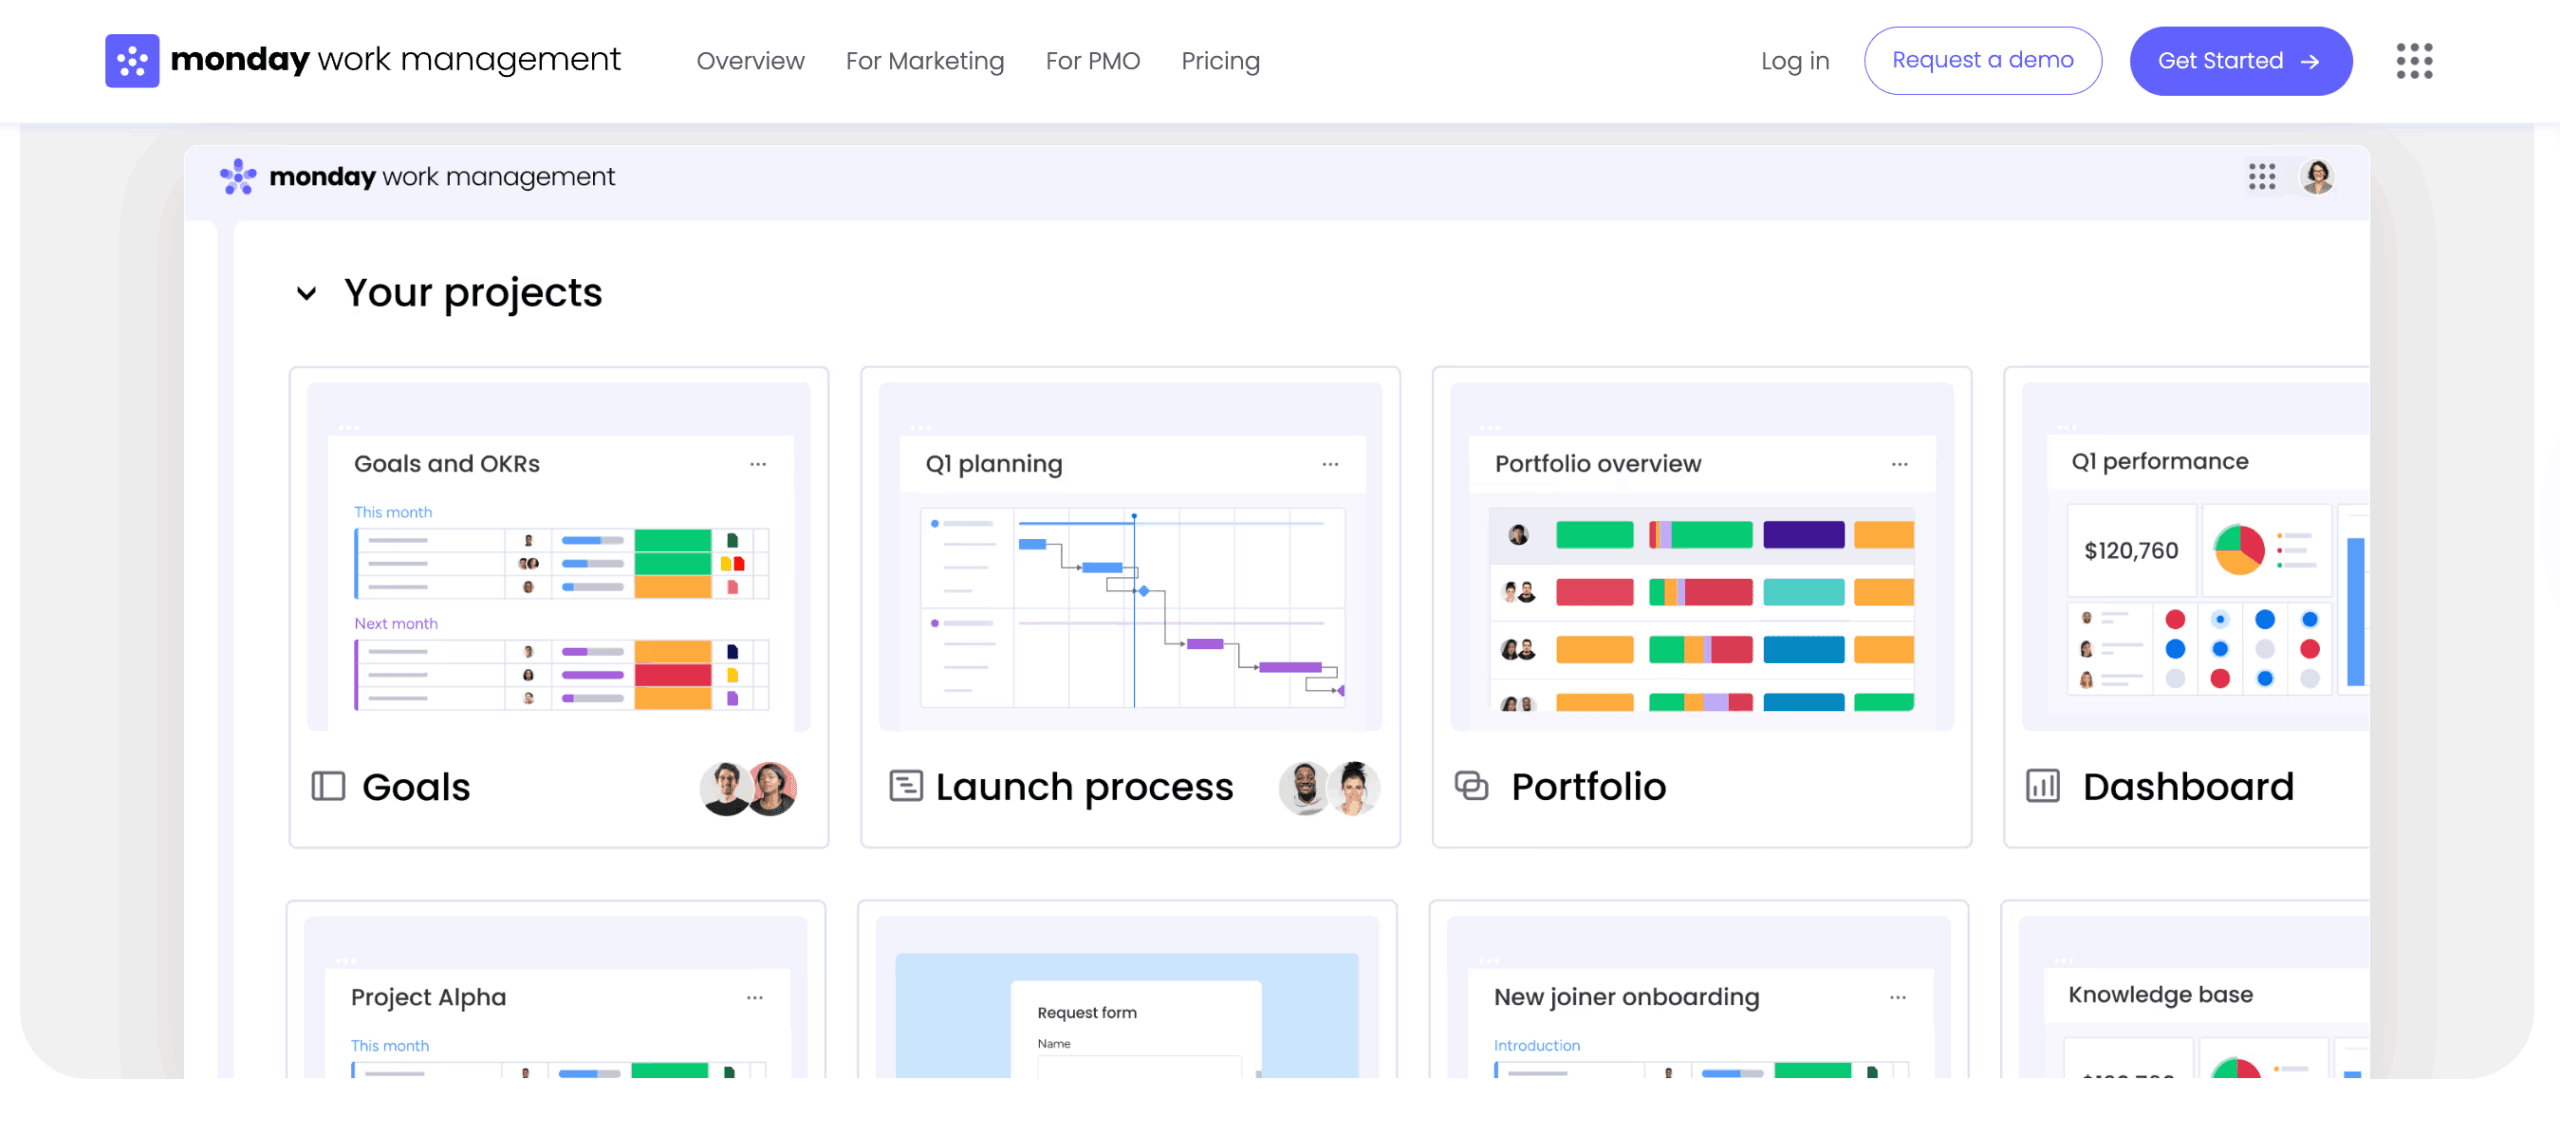
monday work management connects execution and strategy in one place, so KPIs are not pulled from scattered systems. Work, updates, and reporting live in the same environment, turning performance tracking into a continuous, reliable process instead of a weekly scramble.
The table below contrasts traditional KPI tracking with a connected approach on monday work management, showing how automation and real-time visibility replace static, manual reporting.
| Traditional KPI tracking | monday work management approach |
|---|---|
| Manual data collection: spreadsheets requiring weekly manual entry. | Automated data aggregation: data flows instantly from tasks to dashboards. |
| Static reports: snapshots in time that are outdated by the time they're read. | Real-time dashboards: live data that reflects the current state of work. |
| Siloed measurements: departments track metrics in disconnected systems. | Connected cross-project view: a unified layer of intelligence across the organization. |
| Reactive issue response: problems are addressed after they appear in reports. | Proactive AI-powered alerts: notifications trigger when thresholds are breached. |
| Complex setup: requires data analysts to build reports. | Intuitive configuration: no-code widgets allow any manager to build views. |
At scale, that difference becomes significant:
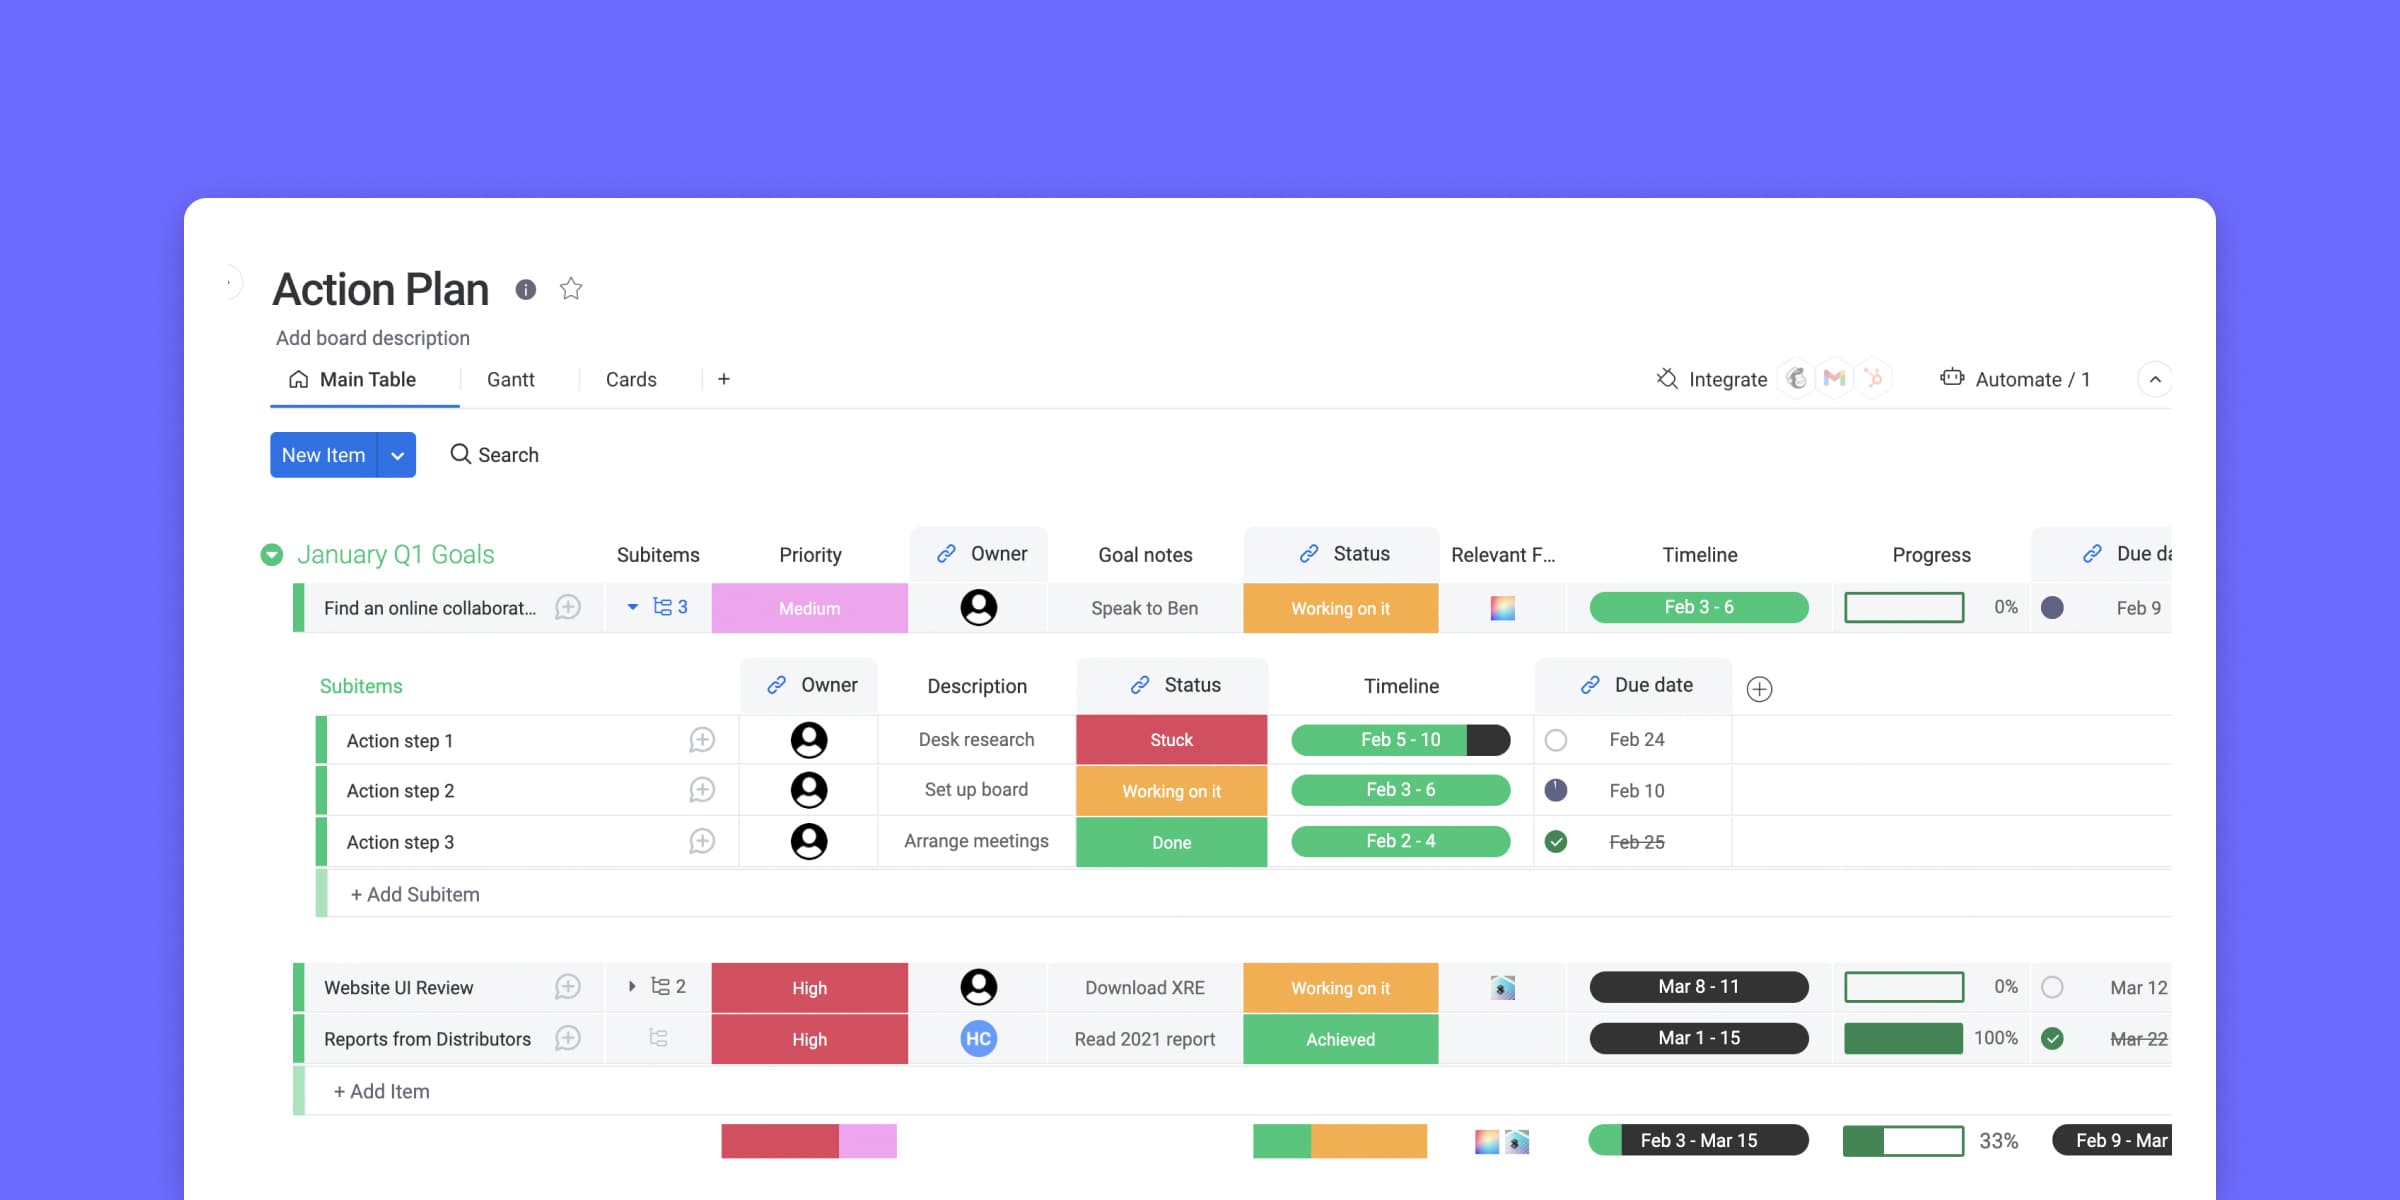
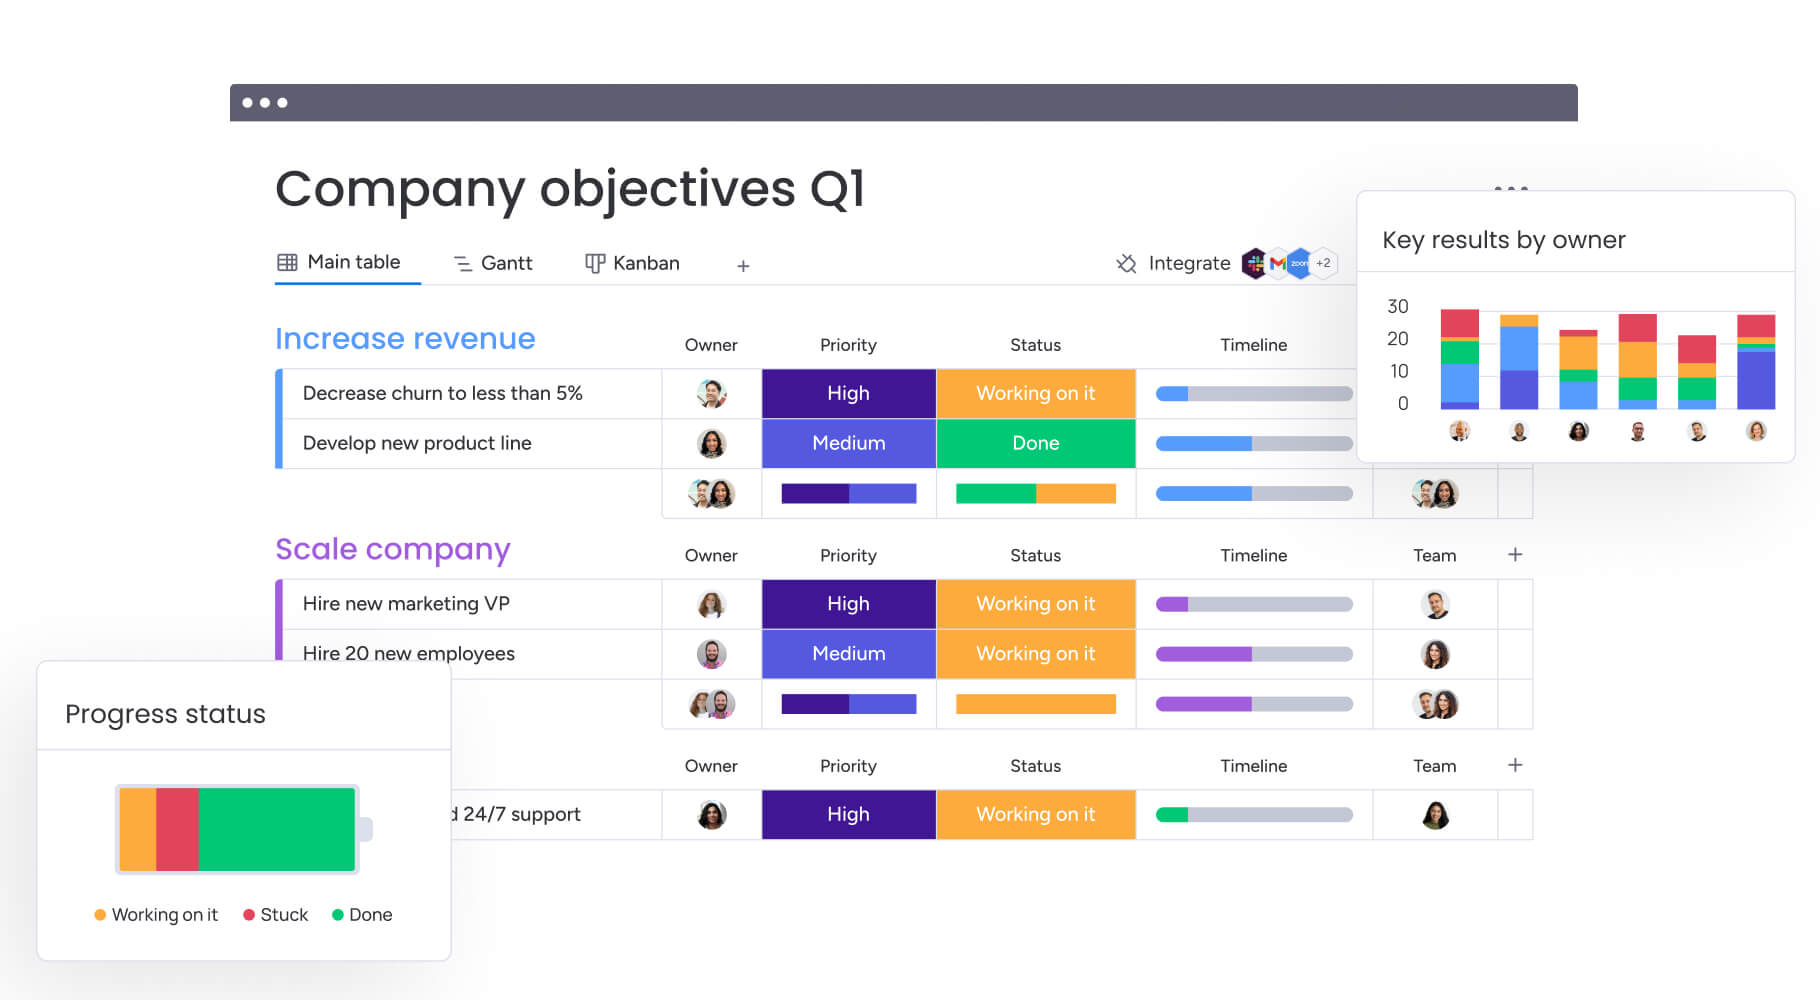
- Real-time dashboards: Build custom dashboards that visualize progress, budgets, and resources instantly using live data from multiple boards.
- Portfolio Risk Insights: Scan across projects with AI to detect anomalies and flag risks before they escalate.
- Customizable automations: Keep KPI data accurate and up to date by removing manual reporting steps and reducing human error.
- Cross-department visibility: Connect operations, marketing, IT, and other teams so individual KPIs roll up into shared company goals.
- Resource management: Monitor team capacity in real time with workload widgets to optimize utilization and prevent burnout.
When KPI tracking shifts from static spreadsheets to a connected platform, performance becomes clearer, faster, and easier to act on.
“monday.com has been a life-changer. It gives us transparency, accountability, and a centralized place to manage projects across the globe".
Kendra Seier | Project Manager“monday.com is the link that holds our business together — connecting our support office and stores with the visibility to move fast, stay consistent, and understand the impact on revenue.”
Duncan McHugh | Chief Operations OfficerTurn measurement into a strategic advantage today
Project teams often struggle to balance deadlines, budgets, and resource capacity while ensuring their work aligns with broader organizational goals. Without real-time visibility and connected data, decisions are reactive, priorities can slip, and strategic objectives may go unmet.
The intuitive and easy-to-use monday work management platform helps bridge these gaps by linking daily execution to measurable business outcomes.
- Real-time dashboards provide visibility: Track project progress, budget consumption, and resource allocation instantly across teams and portfolios.
- Automated KPI tracking reduces manual effort: Data flows directly from tasks to metrics, eliminating errors and delays in reporting.
- Cross-project alignment ensures strategic impact: Portfolio-level insights connect individual work to company-wide objectives, improving prioritization and resource distribution.
- Workload management optimizes team capacity: Visualizations of availability and utilization allow managers to balance assignments and prevent burnout.
- AI-powered alerts highlight risks proactively: Automated notifications identify potential delays or budget overruns before they escalate.
By integrating execution with insights, monday work management transforms scattered data into actionable intelligence, helping teams achieve efficiency, alignment, and measurable strategic impact without added complexity.
Frequently asked questions
What is the difference between KPIs and metrics in project management?
The difference between KPIs and metrics in project management is that KPIs are strategic measurements directly tied to business objectives, whereas metrics are simply quantifiable data points that track the status of a process.
How many KPIs should a project manager track?
A project manager should track between five and ten KPIs to maintain focus on the most critical health indicators without causing analysis paralysis.
What are the five most important KPIs for project success?
The five most critical KPIs are On-time completion rate, budget variance, customer satisfaction score, resource utilization rate, and benefits realization rate.
How often should you review and update project KPIs?
Tactical KPIs should be reviewed weekly during project status meetings, while strategic alignment should be assessed monthly.
Can project management software automate KPI tracking?
Yes, platforms like monday work management can automate the collection, calculation, and visualization of almost all standard KPIs through real-time dashboards and automated data aggregation.
What KPIs matter most for agile project management?
For agile environments, the most significant KPIs are velocity, sprint burndown rate, cycle time, and team satisfaction.