You’ve built a solid team, secured the budget, and launched ambitious initiatives. But three months in, you’re fielding the same uncomfortable questions: Are we on track? What’s working? Where are we burning resources without results?
The gap between having data and having answers reveals why performance reporting has become essential for organizational success. Performance reporting isn’t just about tracking tasks or updating spreadsheets. It’s what connects your daily work to strategic outcomes — revealing patterns that predict what’s coming and spotting opportunities before they turn into problems.
Explore this detailed guide below and we’ll walk through what makes performance reporting effective — from core principles to building systems that actually drive results. We’ll also run through the essential report types every organization needs, show you how to create actionable insights that compel decision-making, and examine how integrated work platforms help teams move from reactive status updates to proactive performance intelligence.
Key takeaways
- Move beyond status updates to strategic insights: transform basic task tracking into performance intelligence that predicts outcomes and drives proactive decision-making across your organization.
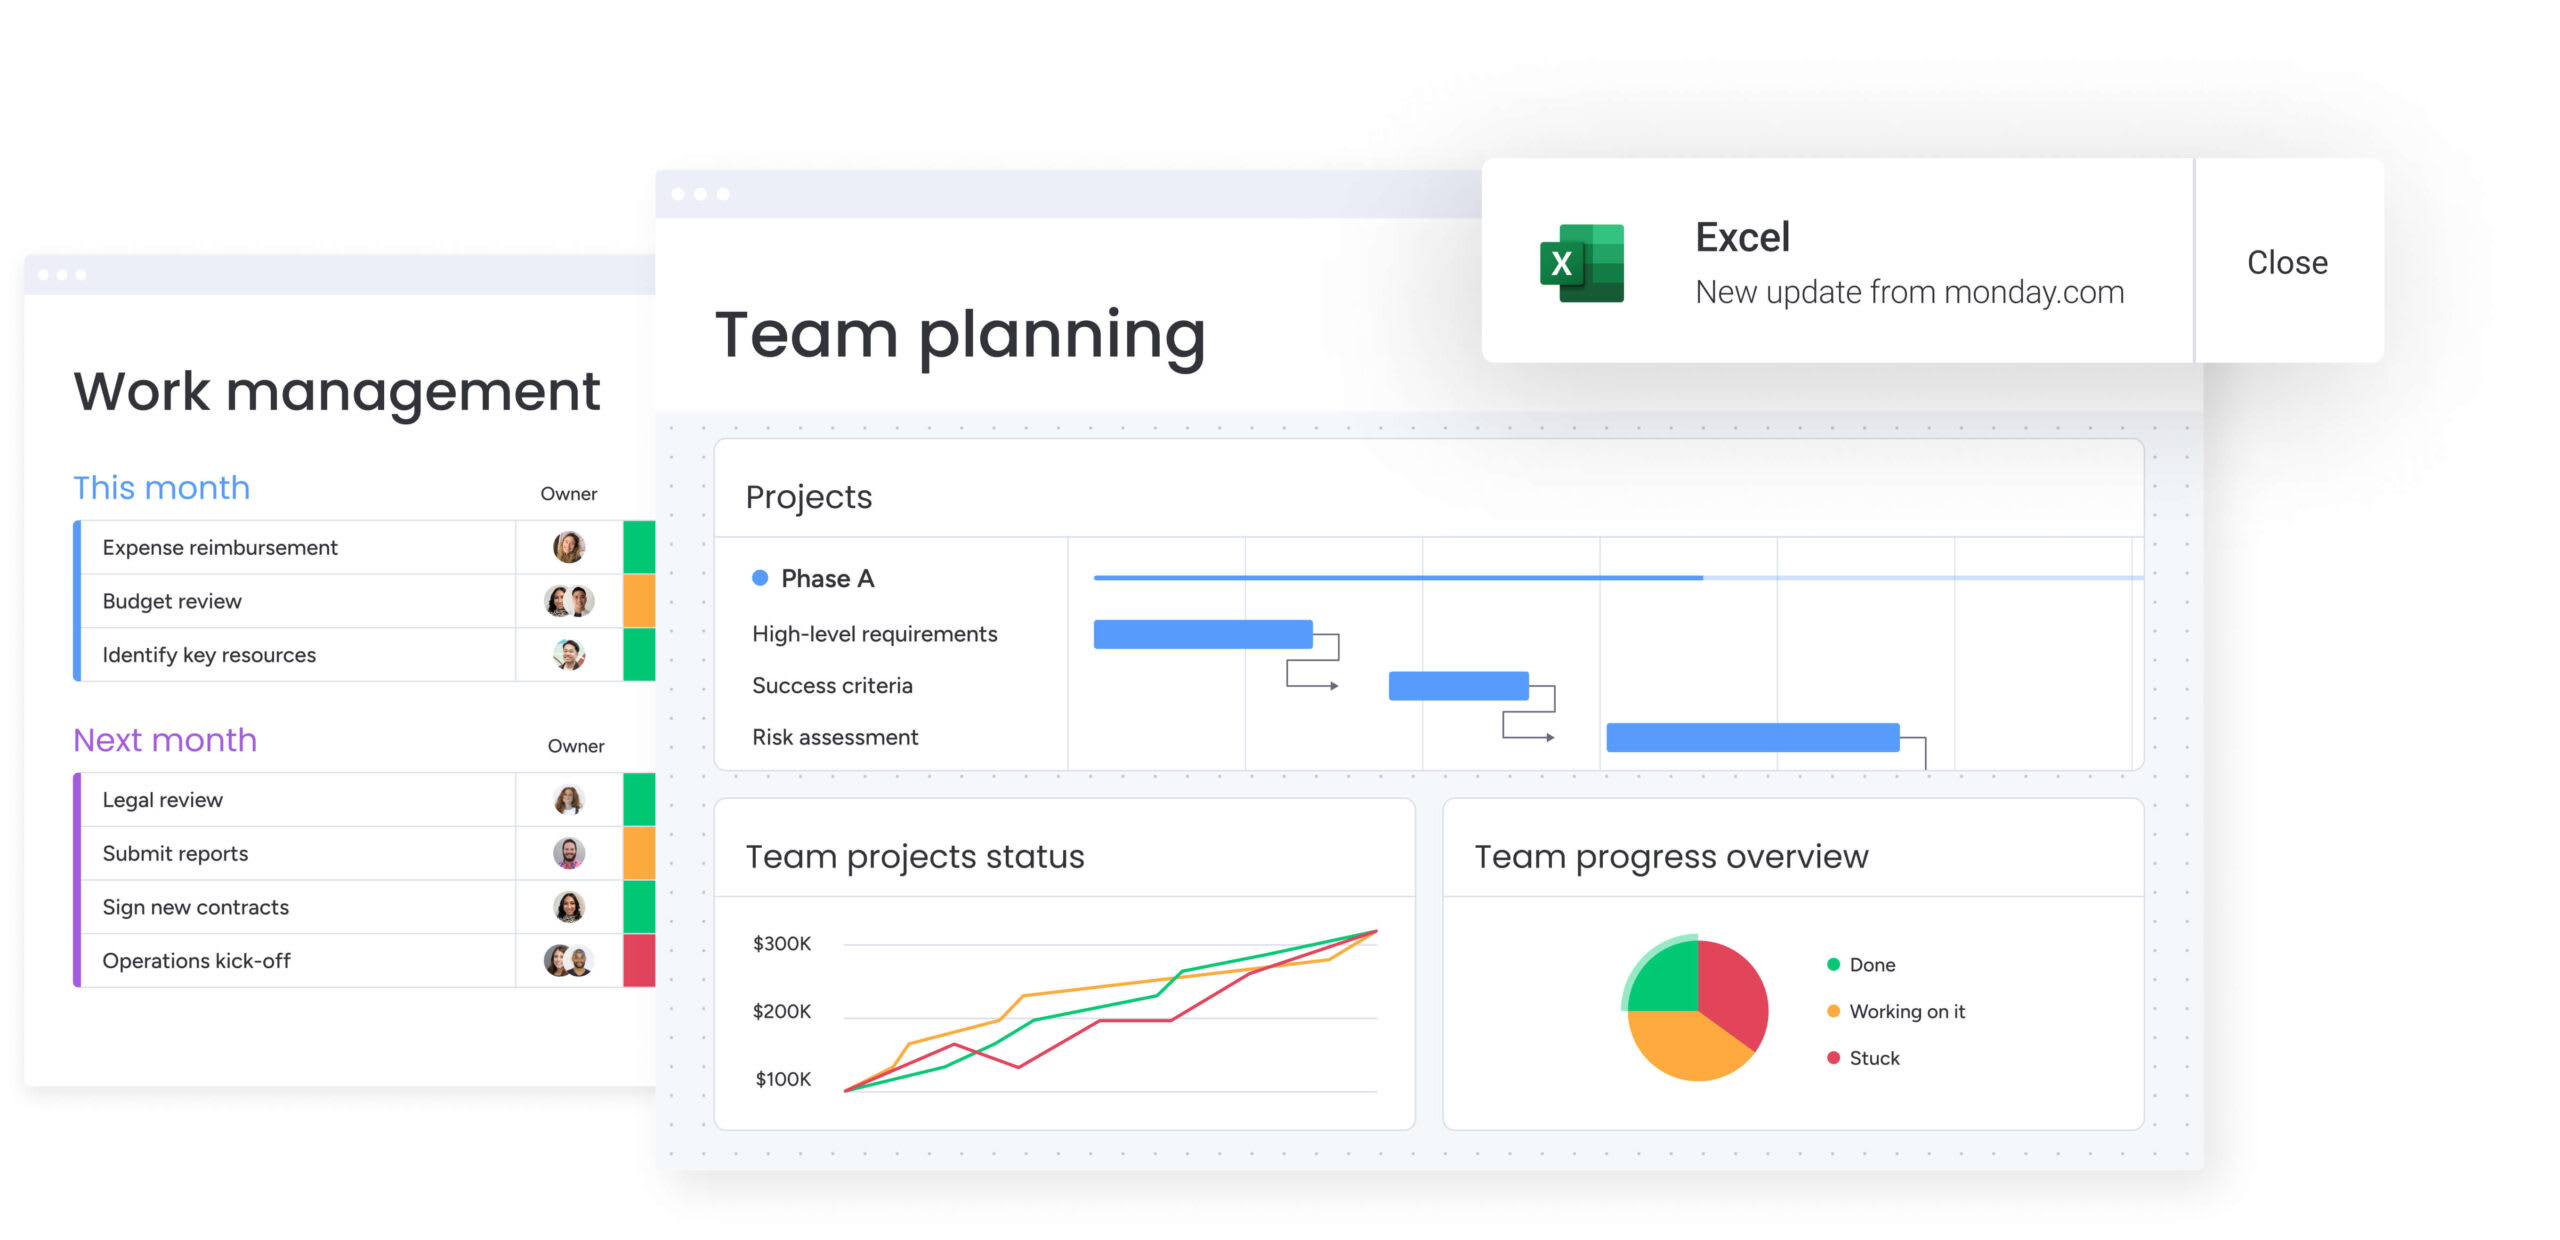
- Connect daily work to business goals through unified reporting: break down data silos by integrating all systems into one view, so marketing delays immediately show their impact on sales targets.
- Focus on actionable metrics that drive decisions: select KPIs that directly influence strategic objectives and include clear recommendations, not just data points that sit unread in reports.
- Automate reporting to eliminate manual effort and errors: set up systems that refresh data automatically and trigger alerts when thresholds are breached, freeing teams to analyze instead of compile.
- Leverage monday work management’s integrated dashboards: centralize performance data from across your tech stack with real-time widgets and AI-powered insights that turn complex data into clear action items.
What is performance reporting?
Performance reporting is how you systematically collect, analyze, and present data that connects daily work to bigger business goals. It turns isolated data points into a cohesive story about how your organization is performing — showing you what happened, why it happened, and what it means going forward.
Basic tracking just records completed work items. Performance reporting puts that data in context: explaining patterns and predicting what’s next. This discipline moves organizations from reactive management toward proactive execution by unifying data from across the business, giving leaders the visibility to optimize resources, mitigate risks, and validate strategy.
Performance reporting vs basic status updates
Status updates and performance reporting serve fundamentally different functions within an organization. Understanding these distinctions helps you determine when each approach serves your needs.
| Feature | Basic status update | Performance reporting |
|---|---|---|
| Primary purpose | Tracks task completion and immediate progress | Analyzes efficiency, impact, and alignment with goals |
| Time horizon | Reactive and backward-looking | Proactive and forward-looking |
| Actionability | Tactical corrections | Strategic pivots |
| Data depth | Surface-level metrics | Contextual insights |
| Audience | Immediate team and direct managers | Cross-functional stakeholders and executive leadership |
Status updates give you snapshots of right now. Performance reporting? That’s your intelligence for navigating what’s ahead. Both matter, but if you’re only doing status updates, you’re missing the strategic insights that separate leaders from followers.
The shift from scattered data to unified insights
Here’s what usually happens: every department speaks a different data language. Marketing tracks engagement metrics in one system, sales monitors pipeline in another, and operations manages capacity in spreadsheets. In fact, retail merchants still spend 40% of their time on low-value tasks including data system consolidation and repetitive spreadsheet work required for performance reporting. That fragmentation creates real problems that limit your ability to make smart decisions.
Unified performance visibility solves three big problems:
- The silo challenge: when marketing, sales, and product teams use disconnected systems, cross-departmental impact becomes impossible to measure. Unified reporting pulls these disconnected sources into one view — so you can see exactly how a product delay impacts sales targets.
- The consistency challenge: without standardized metrics, “complete” means different things to different teams. A unified approach creates a shared data dictionary, so you’re measuring KPIs the same way across the whole company.
- The manual effort challenge: teams waste hours compiling spreadsheets for weekly meetings. McKinsey estimates agentic AI could automate up to 60% of previously manual merchandising tasks and enable merchants to reclaim up to 40% of their time for strategy rather than reporting chores. Integrated platforms automate the collection work, so you can focus on analysis and execution instead of data entry.
Basic tracking just records completed work items. Performance reporting puts that data in context: explaining patterns and predicting what’s next.
How performance reporting transforms business outcomes
For directors and C-suite executives, performance reporting does two things: it helps you spot risks early and optimize how you use resources. It gives you the hard evidence you need to justify headcount, defend budgets, and pivot strategy with confidence.
These benefits show why performance reporting isn’t optional: it’s essential for growth and staying competitive.
Enable strategic decision-making with real-time data
Want to stay agile? You need fast information. When you’re relying on gut instinct or old spreadsheets, you’re always playing catch-up. Real-time performance reporting gives you the immediate data you need for high-stakes decisions.
Among organizations already using AI for decision-making, respondents report roughly 20% average cost reduction and 30–50% faster deal cycles through evidence-based decisions.
Consider a scenario where market conditions shift mid-quarter. With real-time reporting, you can instantly identify underperforming initiatives and reallocate budget to high-growth areas. Suddenly, you’re comparing facts instead of debating opinions.
Uncover hidden bottlenecks before they impact results
When you look at data in aggregate, you’ll spot patterns that individual status updates never show. A single project delay might seem minor in isolation. Performance reporting highlights resource shortages across a whole department before they derail your quarterly plan.
Here’s how different teams use this visibility:
- Operations: identifies supply chain trends that predict inventory shortages weeks in advance.
- Marketing: spots declining engagement rates across specific channels before ad spend is wasted.
- Project management: detects consistent scope creep in specific teams, prompting process adjustments.
Build trust through transparent operations
When everyone can see the data, accountability follows. Make your performance data accessible and transparent, and stakeholders will trust your team’s ability to execute. Standardized reporting formats eliminate ambiguity — you’ll communicate challenges early enough to actually manage them. This transparency builds more trust than constant “green” status reports that hide reality.
Prove ROI to every stakeholder
Performance reporting shows how your day-to-day work creates real business value. It lets you quantify your team’s impact in terms the rest of the organization actually cares about.
Different stakeholders need different views of the same data:
- Executives: view portfolio-level returns and alignment with long-term strategy.
- Department heads: see operational efficiency gains and resource utilization improvements.
- Project managers: validate resource requests through utilization and delivery rate data.
6 essential types of performance reports
A solid reporting system includes different report types for different business questions and decisions. Each serves a unique purpose in your overall performance management strategy. These reports give you visibility across everything — from daily operations to strategic planning.
Operational status reports
Operational status reports give you real-time pulse checks on how your business processes are performing. They focus on efficiency and quality.
- Key metrics: throughput rates, cycle times, error rates, daily active output.
- Example: a manufacturing dashboard tracking line efficiency per hour, or a customer support report monitoring ticket resolution times against SLAs.
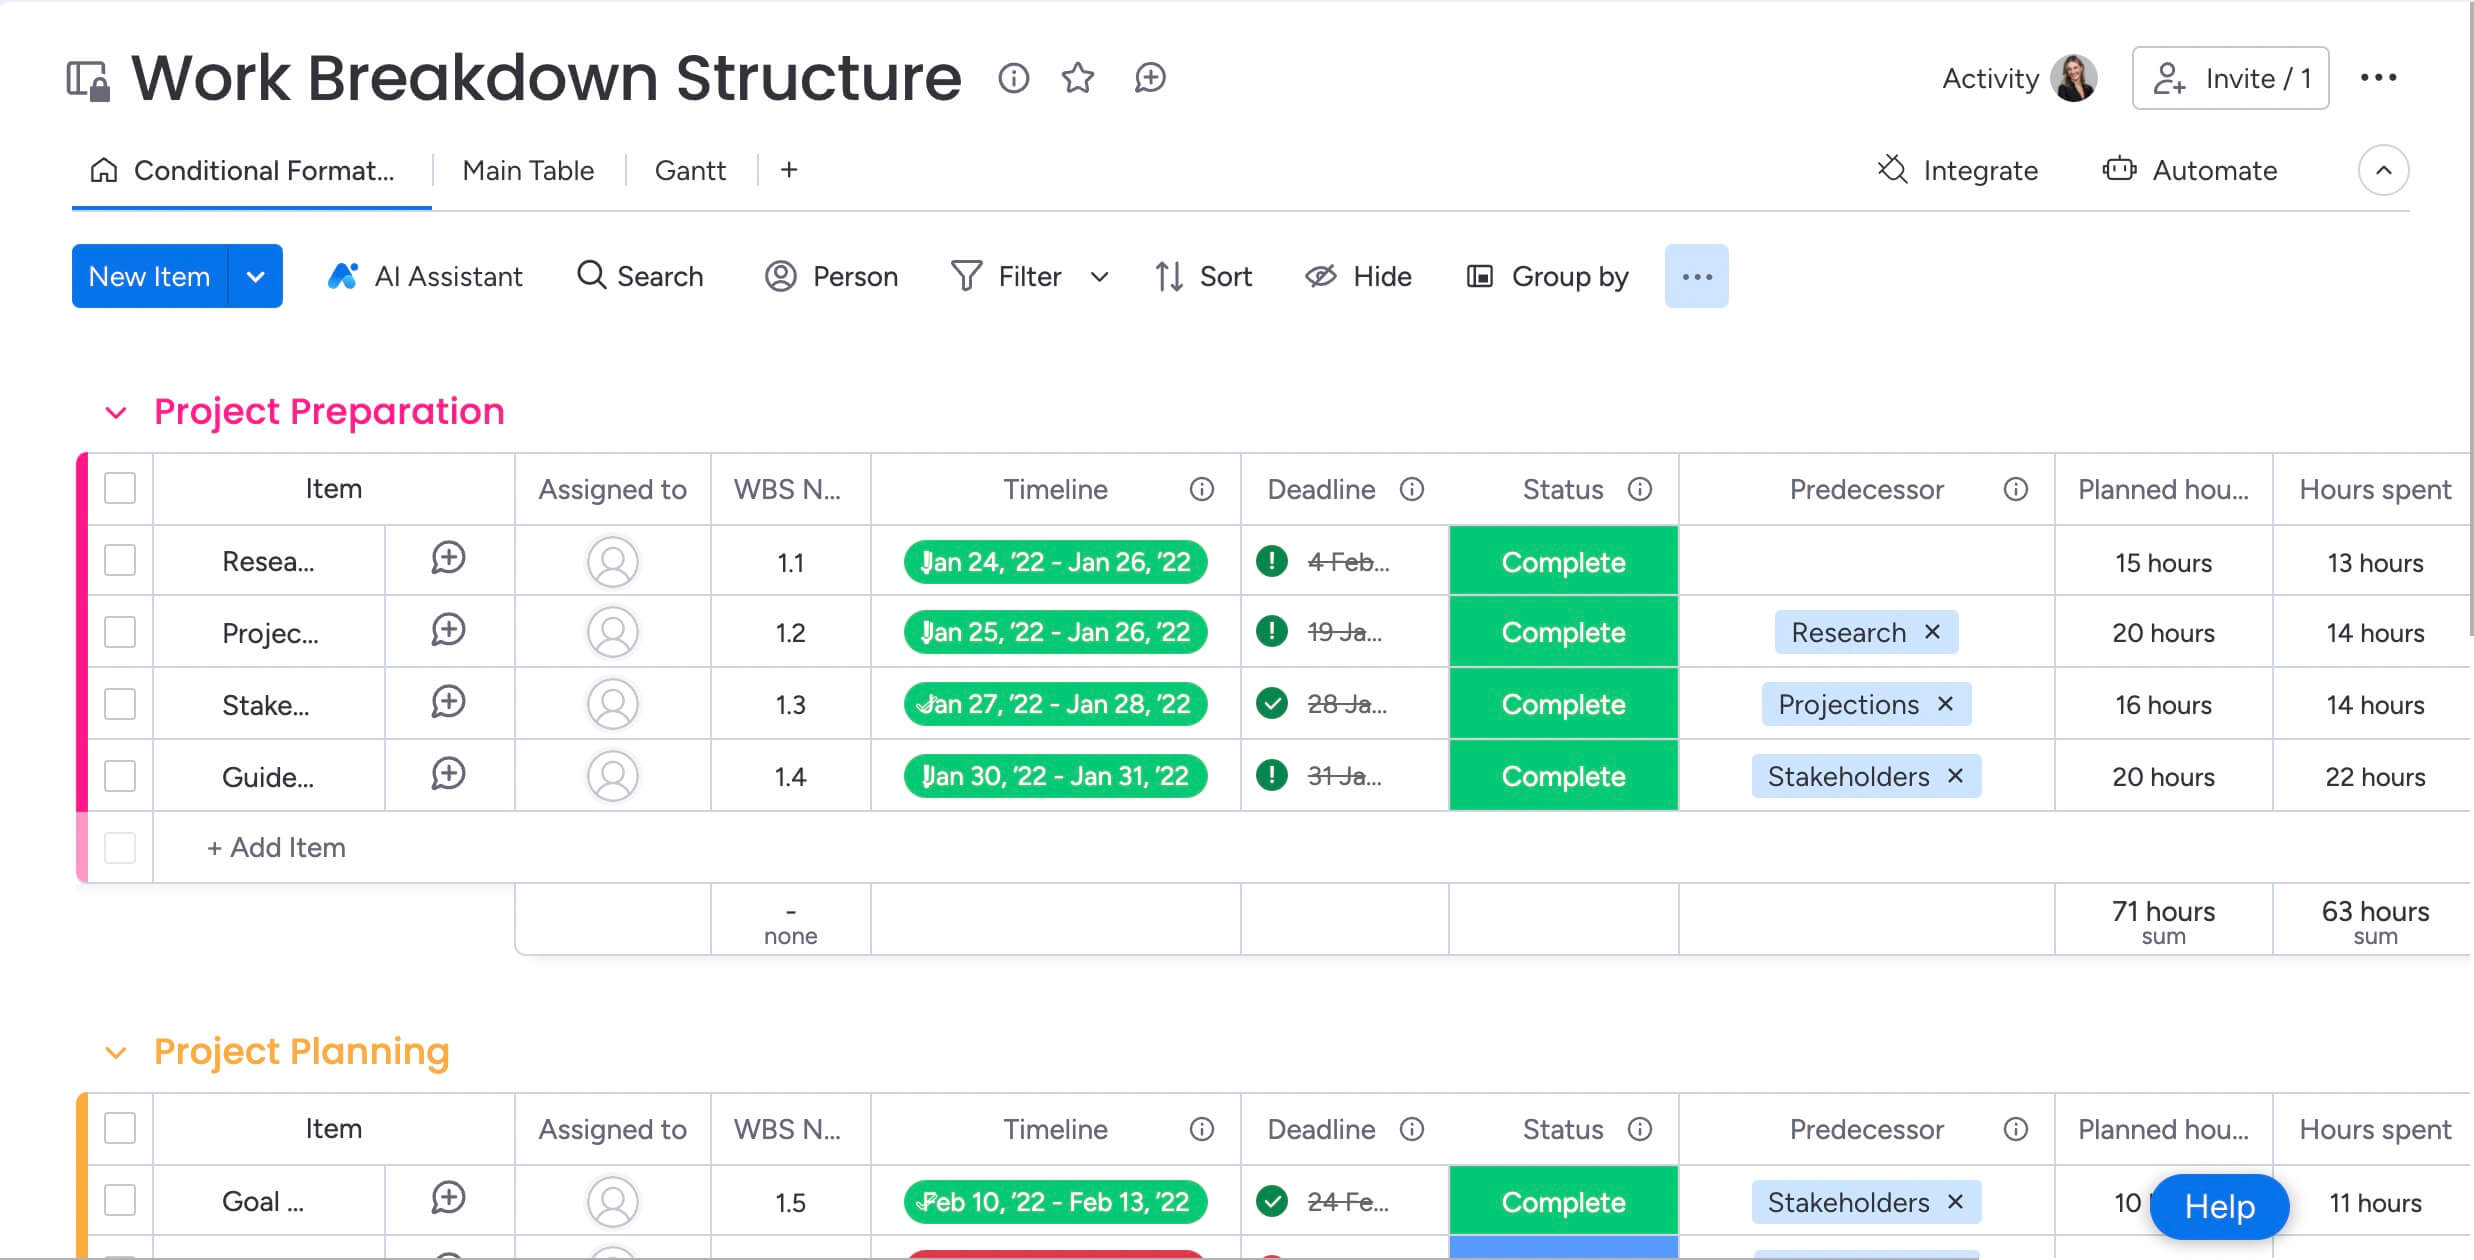
Project progress reports
Unlike simple task lists, project progress reports connect execution to constraints. They show the relationship between work done and resources used.
- Key metrics: schedule variance, milestone completion rates, critical path analysis.
- Example: a product launch report showing that while 80% of work items are complete, the critical path is blocked by a vendor delay requiring immediate intervention.
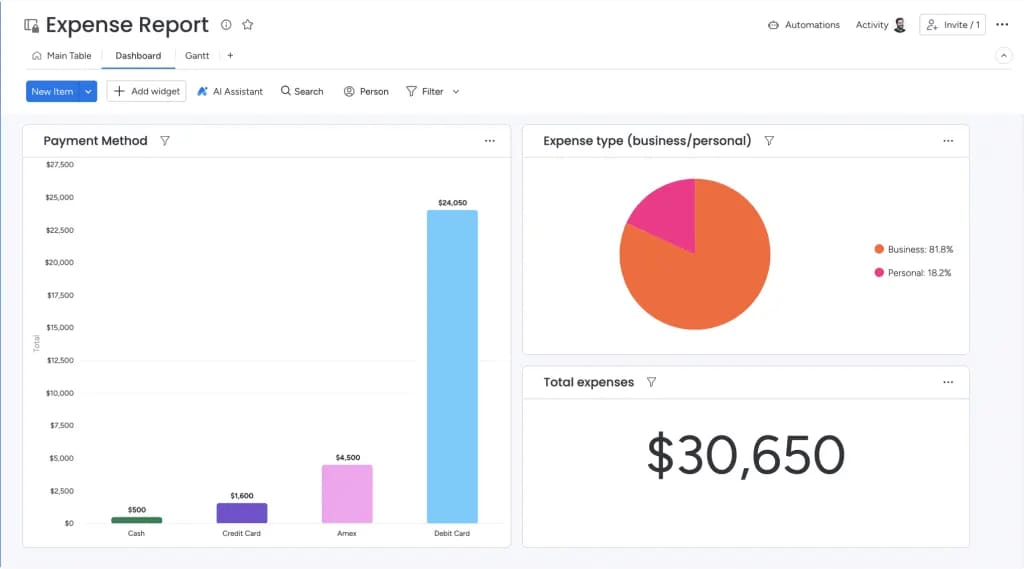
Budget variance reports
Budget variance reports keep your spending on track. They compare what you planned to spend against what you actually spent, so you avoid budget surprises.
- Key metrics: cost variance, burn rate, estimated cost at completion, resource cost allocation.
- Example: a quarterly review highlighting that software licensing costs are 20% over budget due to unmonitored seat additions, prompting a governance review.
Performance trend reports
Trend reports analyze data over time to show whether performance is improving or declining. They separate signal from noise in your operational data.
- Key metrics: month-over-month productivity growth, quality trend lines, customer satisfaction velocity.
- Example: an analysis showing that while team output remains stable, the defect rate has slowly climbed over six months, indicating a need for training or process adjustments.
Predictive forecast reports
Predictive reporting uses historical data and current trajectories to model future outcomes. It shifts you from reacting to problems to shaping outcomes before they happen.
- Key metrics: projected completion dates, resource demand forecasts, revenue projections based on pipeline velocity.
- Example: AI-driven analysis predicting that current engineering velocity will result in a missed Q4 release date unless scope is reduced by 15%.
Executive summary dashboards
Executive dashboards turn complex data into high-level signals for strategic decisions. They focus on exceptions, not every little detail.
- Key metrics: strategic KPI status, top-level risks, portfolio ROI.
- Example: a C-suite view showing that three out of five strategic initiatives are on track, while two require immediate executive sponsorship to address blockers.
Core elements that make performance reports actionable
Reports that sit unread in inboxes fail because they provide information without direction. Effective performance reports share specific traits that make people actually take action. These elements turn data from something you read into something you act on.
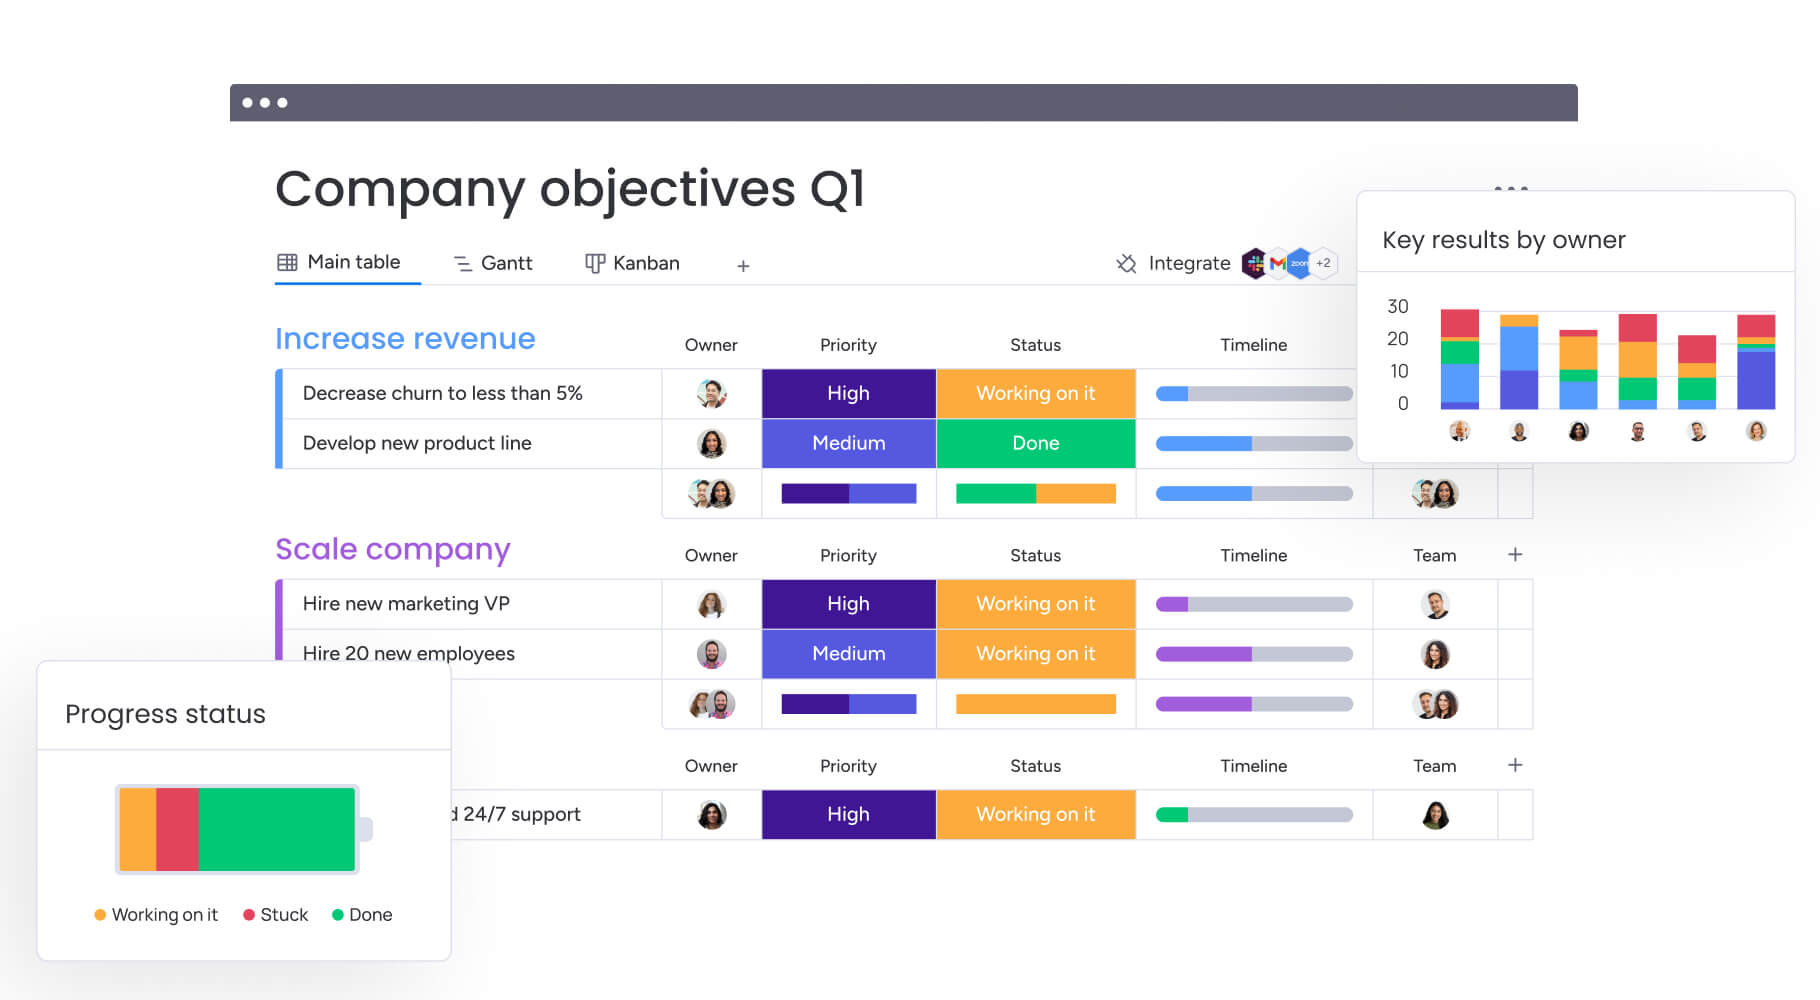
Strategic alignment with business goals
Actionable reports explicitly map operational metrics to strategic objectives. A metric only has value if it influences a business goal. Tracking “lines of code written” provides limited insight. Tracking “feature delivery velocity” aligns with the strategic goal of faster time-to-market.
Organizations connect everyday work to strategic objectives through goal-tracking features that visually link daily metrics to the overarching purpose. This alignment ensures every data point serves a strategic purpose.
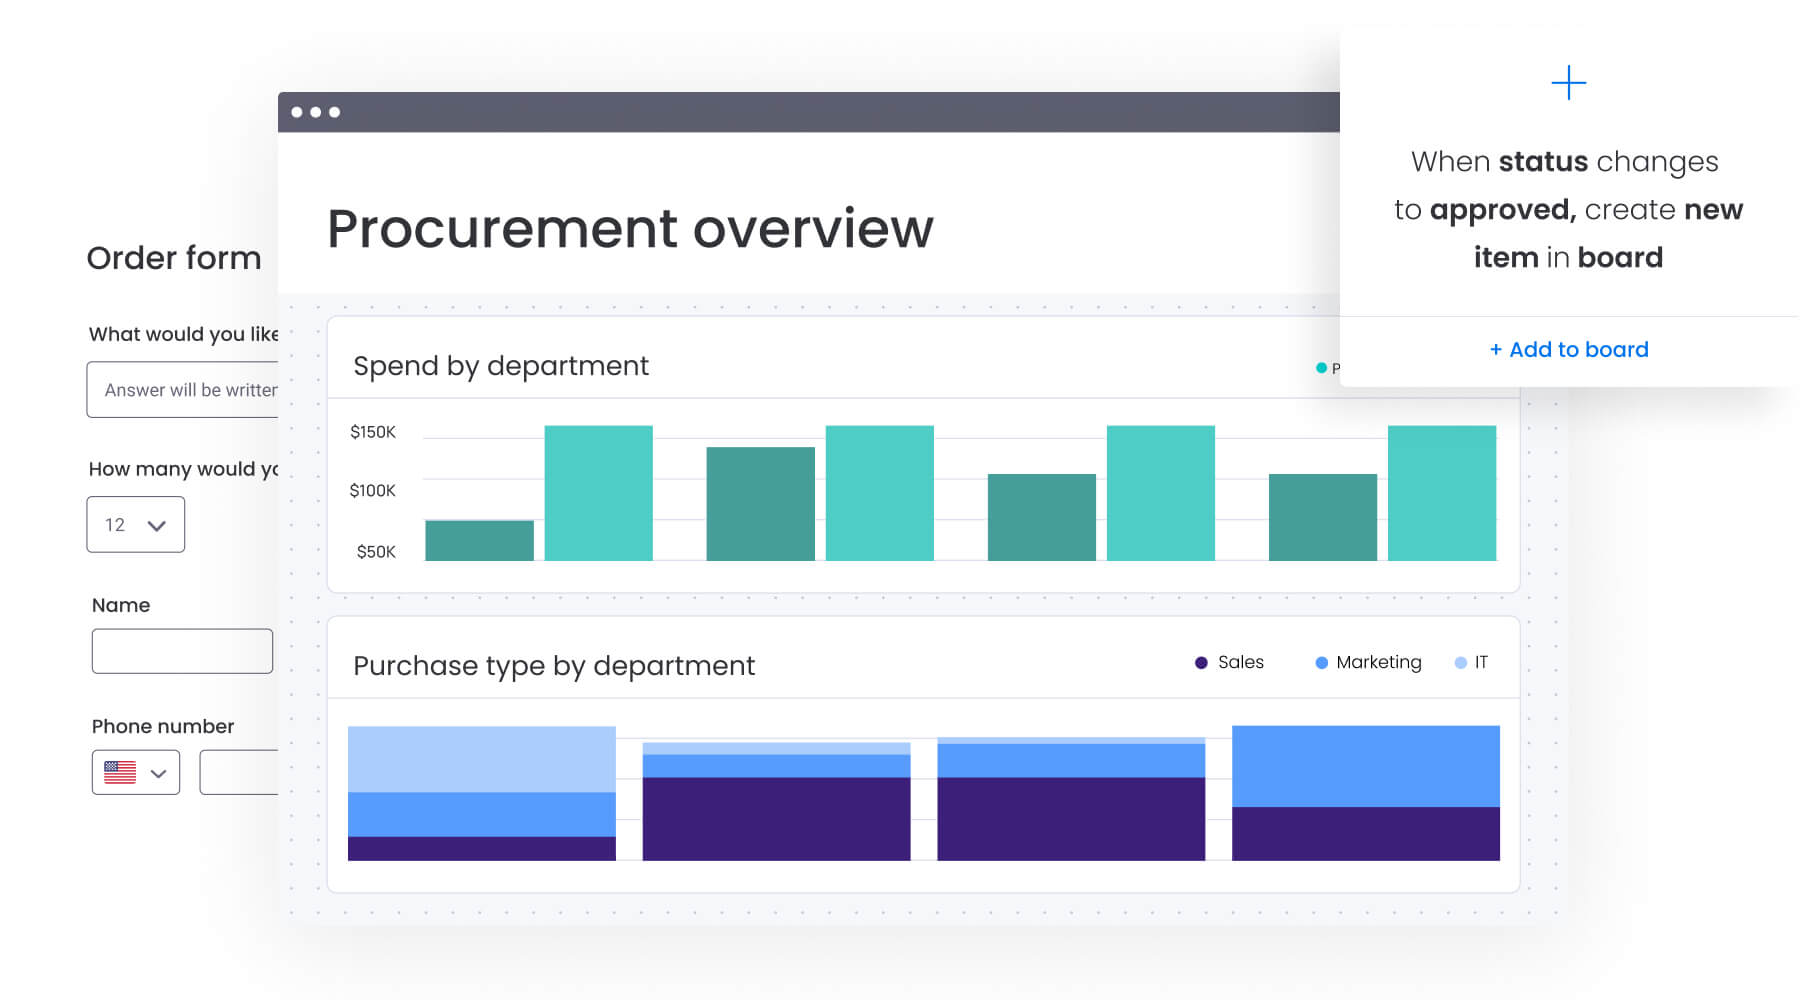
Visual storytelling through data
Stakeholders should understand the narrative of a report within seconds. Visual elements reduce cognitive load and highlight anomalies instantly.
Different visualization types serve different analytical purposes:
- Trend charts: show direction over time for temporal data.
- Comparison charts: highlight variance between budget and actual.
- Heat maps: identify risk areas through color-coded intensity.
Recommendations and next steps
Data diagnosis must be paired with prescription. An effective report doesn’t just state that “budget is overrunning.” It recommends “pausing non-critical contractor spend to realign with Q3 targets.”
AI-powered insights can assist in generating these recommendations by analyzing successful patterns from past projects. This transforms reports from passive documents into active decision-support tools.
Role-based access and customization
Relevance drives engagement. A CFO needs financial granularity, while a Creative Director needs asset approval status. Role-based reporting ensures stakeholders see metrics that impact their specific domain.
Platform-based permissions enable this customization from a single data set. Everyone looks at the same truth through a lens relevant to their role, maintaining consistency while maximizing relevance.
Build your performance reporting system in 7 steps
Building a scalable reporting engine requires systematic planning. Following this structured approach below helps you create a reporting foundation that delivers immediate value while supporting long-term strategic needs.
Step 1: map your strategic objectives
Define what success looks like before selecting metrics. Document high-level business goals to ensure every subsequent report serves a defined business purpose.
Step 2: identify stakeholder information needs
Different stakeholders make different decisions. Interview executives, managers, and team leads to understand exactly what information they need.
Key information requirements by role:
- Executives: monthly trends and risk alerts.
- Managers: weekly resource allocation and progress data.
- Teams: daily work item visibility and dependency awareness.
Step 3: select metrics that matter
Prioritize metric quality over quantity. Select KPIs that are measurable, actionable, and directly relevant to strategic objectives. Focus on leading indicators that enable proactive management, not just lagging indicators that report outcomes.
Step 4: connect your data ecosystem
Siloed data leads to conflicting reports. Integrate various systems to create a unified data layer. Organizations using monday work management connect all their existing systems through integrations with Microsoft Teams, Gmail, Slack, Jira, Salesforce, and over 200 other applications.
Step 5: design dynamic report templates
Standardization ensures consistency and reduces build time. Create templates for common reporting needs that automatically populate with live data. This ensures every report follows the same logic and visual structure.
Step 6: automate data flow and updates
Manual reporting is prone to error and quickly becomes outdated. Automating data collection ensures reports always reflect current reality. Set up scheduled data refreshes and automated notifications to trigger when specific thresholds are breached.
Step 7: create continuous improvement loops
Establish feedback loops where stakeholders can request adjustments to reports. Monitor usage analytics to see which dashboards are actually being used and which are ignored. Refine metrics and templates to improve decision speed and relevance.
While organizations share high-level goals, each department contributes through specific lenses. These metrics help different functions demonstrate their impact on business outcomes. Understanding department-specific KPIs ensures your reporting system captures the full spectrum of organizational performance while maintaining relevance for each functional area.
Operations excellence metrics
- Cycle time: measures total time from process start to finish, indicating speed of delivery.
- Throughput: tracks work completed in specific timeframes, measuring capacity.
- Resource utilization: calculates percentage of available time spent on productive work.
- Error/defect rate: monitors quality by tracking percentage of output requiring rework.
Financial performance indicators
- Budget variance: the difference between baseline budget and actual spend.
- Cost per unit/project: breaks down total spend by output to measure efficiency.
- Return on investment: calculates financial return generated relative to cost incurred.
- Cash flow: monitors timing of inflows and outflows to ensure liquidity.
Portfolio and project health scores
- Schedule performance index: a ratio of earned value to planned value.
- Scope creep: measures percentage of unauthorized changes added to projects.
- Risk exposure: a weighted score of identified risks and potential impact.
- Strategic alignment score: rates how well active projects support organizational goals.
Resource optimization measures
- Capacity vs. demand: compares available resource hours against required hours.
- Skill allocation efficiency: measures how often high-value skills are used appropriately.
- Workload distribution: identifies imbalances in team member utilization.
Best practices for performance reporting excellence
Adhering to specific best practices ensures reporting systems remain reliable and trusted as organizations scale. How confident are you in the accuracy of your current reports? These proven approaches help maintain data integrity and stakeholder confidence while your reporting capabilities evolve with business needs.
Establish data governance standards
Data governance defines the rules for reporting. Create definitions for every metric and assign ownership for data quality. Document these standards to prevent debates over data validity and ensure reports remain consistent even as teams change.
Create your single source of truth
Designate authoritative systems for specific data types. The ERP becomes the source of truth for financials, while the work management platform becomes the source of truth for project status. Integrating these systems ensures that reports generated by marketing match the numbers seen by finance.
Balance comprehensive coverage with simplicity
Use a layered approach to dashboard design. Provide high-level summary views for quick scanning, with the ability to drill down into granular data for root cause analysis. This progressive disclosure keeps reports clean without hiding necessary detail.
Leverage automation for consistency
Automation enforces discipline beyond saving time. Automated reports are generated at the same time, using the same logic, every single cycle. This consistency allows for accurate trend analysis, as variations in data are caused by performance changes, not reporting irregularities.
Organizations using monday work management automate crucial elements including:
- Template creation: creating templated project boards.
- Notification management: sending approval notifications and reminders.
- Alert systems: triggering alerts when metrics breach defined thresholds.
The future of performance reporting with AI
Artificial intelligence is shifting reporting from descriptive to prescriptive. AI capabilities act as an always-on analyst, processing vast datasets to find insights human analysis might miss. This technological evolution transforms how organizations understand and respond to performance data, making sophisticated analysis accessible to teams without dedicated data science resources.
AI-powered risk detection and alerts
AI algorithms analyze historical performance patterns to identify anomalies in real-time. If a specific project type historically runs over budget when a certain vendor is involved, AI flags this risk at the planning stage. These proactive alerts allow managers to intervene before risks become reality.
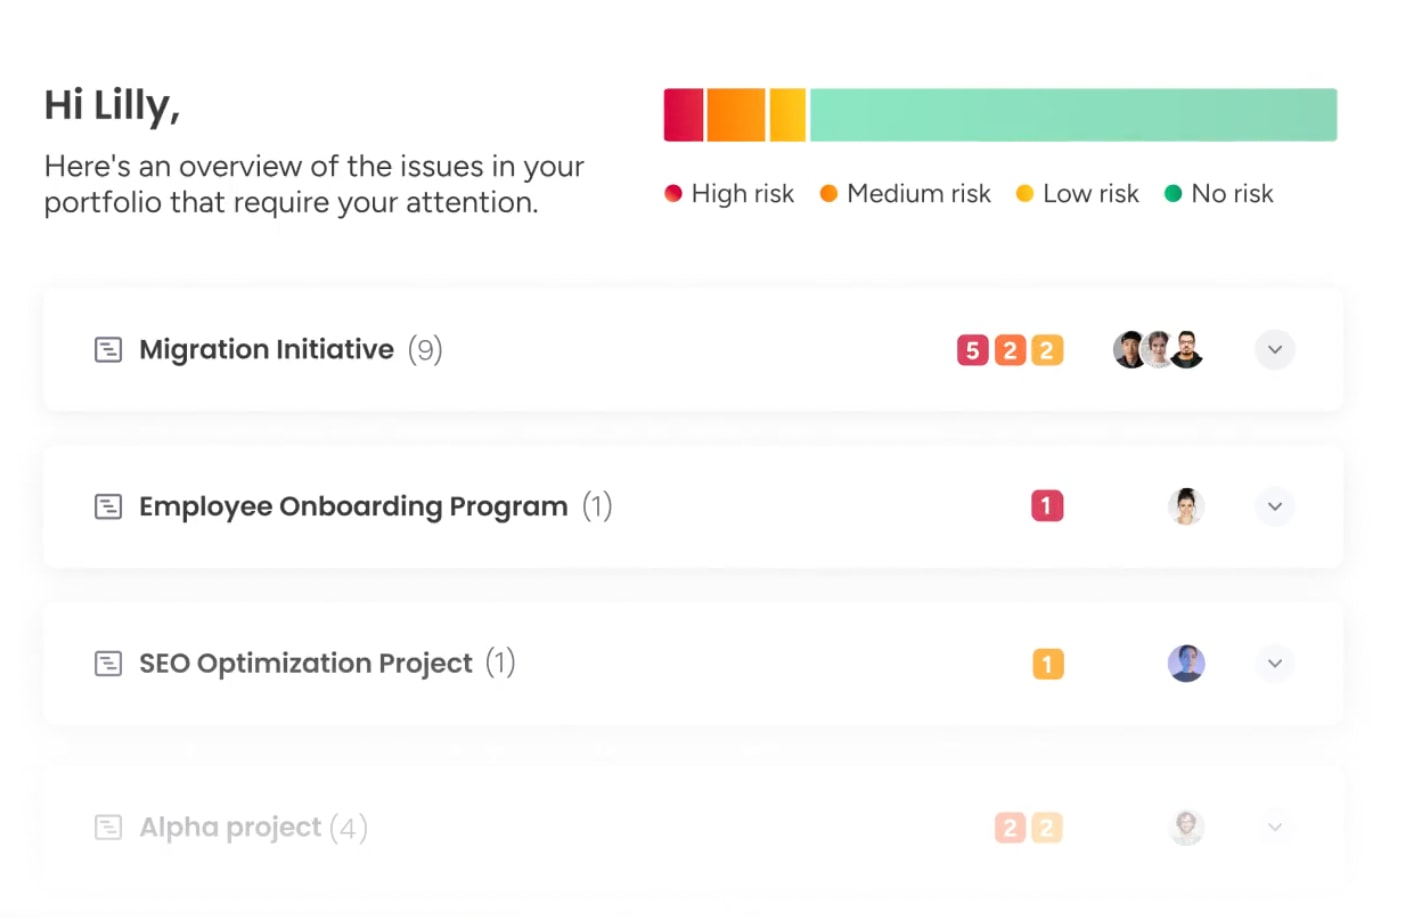
Portfolio Risk Insights in monday work management scans all project boards, quickly flagging potential risks by severity. Teams spot critical issues at a glance, without manually combing through data.
Automated insight generation
Instead of spending hours analyzing charts, AI instantly correlates data points to explain performance drivers. It can identify that a drop in productivity correlates with increased meeting volume, providing an instant hypothesis for leadership to test.
Predictive performance analytics
Predictive models forecast future states with increasing accuracy. AI analyzes current velocity and resource availability to predict project completion dates or budget outcomes weeks in advance. This allows for data-driven capacity planning and realistic expectation setting.
Natural language report creation
AI lowers the barrier to data consumption by writing summaries in plain English. It can scan a complex dashboard and generate a textual narrative that makes performance data accessible to stakeholders who may not be data-savvy.
AI capabilities act as an always-on analyst, processing vast datasets to find insights human analysis might miss. This technological evolution transforms how organizations understand and respond to performance data.
Transform performance reporting with monday work management
Traditional reporting tools sit outside the flow of work. Data is pulled manually, insights arrive late, and leaders are left interpreting static snapshots instead of acting on live signals. monday work management changes that by embedding performance reporting directly into how work happens — which is exactly what the comparison table highlights.
Instead of disconnected BI tools or fragile spreadsheets, the sophisticated platform combines real-time operational data, automation, and AI in one system that teams actually use.
| Feature | monday work management | Traditional BI systems | Spreadsheets |
|---|---|---|---|
| Data source | Real-time operational work data | Disconnected, static data imports | Manual data entry |
| Actionability | Click-through to underlying work items | View-only; cannot edit source data | Static; requires manual updating |
| Implementation | Low-code/no-code; setup in minutes | Requires data analysts/engineers | Easy to start, difficult to scale |
| Collaboration | Built-in context and communication | Data isolated from communication | Comments often buried in cells |
| AI capabilities | Integrated workflow and insight AI | Complex, often requires specialized setup | Limited or non-existent |
What separates monday work management from traditional BI tools and spreadsheets isn’t just how data is collected — it’s how intelligence, action, and role-specific insight come together in one system.
- Executives and PMOs get AI-powered portfolio visibility: live dashboards surface delivery risk, budget drift, and strategic misalignment across initiatives, with AI flagging issues before they impact outcomes.
- CMOs connect performance to revenue impact: campaign execution, budget burn, and channel performance roll up into real-time views that show how delays or underperformance affect pipeline and ROI.
- Operations leaders monitor throughput and bottlenecks as they form: cycle time, capacity, and quality metrics update automatically, while AI highlights recurring slowdowns and workload imbalances.
- Project and program managers move from reporting to control: timelines, dependencies, and performance indicators stay linked to execution, with automated alerts when work slips or risks escalate.
- Teams act directly from insights: every metric, trend, or alert links back to the underlying work items, keeping collaboration, decisions, and accountability in context.
Across all roles, AI-powered insights, automation, and embedded collaboration turn performance reporting into a live management layer — not a retrospective exercise. That’s why monday work management functions as a performance operating system, not just a reporting tool.
Drive results with intelligent performance reporting
Performance reporting transforms from a compliance exercise into a competitive advantage when implemented strategically. Organizations that master this discipline gain the visibility to anticipate challenges, optimize resources, and execute with confidence. The shift from reactive status updates to proactive performance intelligence enables leaders to make decisions based on data rather than intuition.
The most successful implementations combine comprehensive data collection with intelligent analysis and actionable insights. Teams using monday work management experience this transformation first-hand, moving from scattered spreadsheets to unified dashboards that connect daily work to strategic outcomes. This integration eliminates the manual effort that traditionally consumes reporting cycles while providing the real-time visibility that drives informed decision-making.
Your next step involves evaluating your current reporting capabilities against the framework outlined in this guide. Identify the gaps between your existing approach and the strategic reporting system your organization needs to thrive in an increasingly competitive landscape.
Frequently asked questions
What is the difference between a performance report and a status report?
A performance report analyzes data against strategic objectives to provide actionable insights and future trends, whereas a status report simply communicates the current state of projects without strategic context.
How often should organizations create performance reports?
Reporting frequency depends on decision-making cycles: operational teams typically need daily or weekly reports, project managers review weekly or bi-weekly data, and executives generally require monthly or quarterly strategic overviews.
Which performance reporting platforms work best for cross-functional teams?
The most effective platforms for cross-functional teams are integrated systems that centralize data from various departments, offer role-based access to shared dashboards, and support collaborative decision-making within the platform itself.
Can performance reporting work for small teams without dedicated analysts?
Yes, platforms with no-code interfaces, pre-built templates, and AI capabilities allow small teams to generate professional performance reports automatically without needing data science expertise.
What are the top 5 KPIs every performance report should include?
While specific metrics vary, every comprehensive report should track strategic alignment, financial health, operational efficiency, risk indicators, and stakeholder satisfaction.
How does monday work management simplify performance reporting for non-technical teams?
monday work management utilizes an intuitive visual interface with drag-and-drop dashboard widgets and pre-built templates, allowing any team member to build complex, automated reports without writing code or SQL queries.