
You’re staring at a backlog of 30 initiatives, a dozen stakeholder requests, and a sprint deadline that keeps inching closer. Every item feels urgent, and your team has strong opinions about what should come first. An impact effort matrix gives you a structured way to compare options and turn prioritization from a debate into a decision.
This guide explores what an impact effort matrix is, how the 4 quadrants work, a step-by-step process for building one in monday.com’s AI Work Platform, and how it compares to frameworks like the Eisenhower Matrix, RICE, and ICE.
Get startedKey takeaways
- An impact effort matrix helps teams prioritize by plotting initiatives on 2 axes: potential impact and required effort
- The 4 quadrants (quick wins, major projects, fill-ins, and thankless tasks) give teams an objective framework for deciding what to work on first
- Defining scoring criteria for both impact and effort before plotting prevents bias and misalignment across stakeholders
- Regular reviews (at least quarterly) keep your matrix accurate as priorities, resources, and business conditions shift
- monday.com’s AI Work Platform lets teams build, score, and track their impact effort matrix with AI-powered automations and real-time dashboards
What is an impact effort matrix?
An impact effort matrix (also known as an action priority matrix or effort impact matrix) is a decision-making framework you can use to prioritize initiatives based on their potential impact and the amount of effort required to implement them.
- Impact is typically measured in terms of an initiative’s ability to achieve a specific goal, whether that’s revenue growth, customer satisfaction, or operational efficiency.
- Effort is measured in terms of time, money, personnel, or other resources needed to execute.
Plotting initiatives on a 2-by-2 grid lets teams quickly identify which projects offer the highest return relative to the resources they require. The result is a shared, visual reference that replaces subjective debate with structured analysis.
How impact effort analysis works
The underlying logic is straightforward. You evaluate each initiative against 2 dimensions (impact and effort) using a consistent scoring method. Scores can be numeric (1 through 10), categorical (small, medium, large), or based on weighted criteria. Once scored, each initiative is plotted on the grid, and its position in one of the 4 quadrants tells you how to handle it.
The visual nature of the matrix is what makes it powerful. A backlog of 20 initiatives in a spreadsheet feels overwhelming. The same 20 initiatives plotted on a matrix immediately reveal patterns: clusters of quick wins you’ve been ignoring, major projects consuming resources without proportional impact, and thankless work that should be deprioritized or eliminated entirely.
Impact effort matrix vs prioritization matrix
The terms are sometimes used interchangeably, but they aren’t identical. A generic prioritization matrix can use any combination of axes: urgency vs importance, feasibility vs value, or risk vs reward. An impact effort matrix specifically evaluates potential impact against required effort, making it particularly useful when teams need to balance ambition with available resources.
A decision matrix, by contrast, evaluates options against multiple weighted criteria simultaneously. It’s more granular but also more time-consuming. The impact effort matrix works well as a first pass to narrow the field before applying a more detailed scoring model.
When to use an impact effort matrix
Not every situation calls for a formal prioritization exercise. The matrix works across industries, team sizes, and planning cycles, as long as there’s a defined set of options to evaluate. If any of the following apply, an impact effort matrix is worth your time:
- You have more than 5 competing initiatives and no structured way to compare them
- Your team disagrees on what should be prioritized, and the disagreements are based on gut feeling rather than data
- You’re about to kick off a new quarter, sprint, or planning cycle and need to align on direction
- Resources are constrained and you need to make deliberate trade-offs
If you’re a manager making decisions for your team, the matrix gives you a defensible, transparent rationale for why certain initiatives take priority over others.

Why use an impact effort matrix?
Prioritizing projects can be difficult when multiple stakeholders are involved in the decision-making process. Individuals may have their own subjective preferences about which initiatives should lead. When people have conflicting ideas, delays and friction follow. For this reason, it’s useful to have an objective way of choosing between initiatives based on effort and impact.
Using an impact effort matrix provides a visual overview of how projects vary across these 2 critical factors. It gives teams a framework for making informed, objective decisions about their next moves. While it doesn’t always produce a single definitive answer, it creates a basis for productive, structured discussions that move work forward.
Another key advantage relates to something called “the planning fallacy.” This describes the general tendency people have to underestimate how much effort something will take, a pattern well-documented in research on project duration forecasting. An impact effort matrix gets people thinking realistically about resource requirements, helping you bypass the tendency to underestimate effort before it derails your timeline.
The benefits of performing an impact effort analysis go beyond simply ranking initiatives. Teams that use the matrix consistently report faster decisions, fewer resource conflicts, and greater confidence in their project roadmaps. Here are some of the most significant advantages:
- Aligns teams on project goals: Everyone sees the same matrix, which reduces ambiguity about what’s important
- Saves resources: Early identification of low-impact, high-effort work avoids investing in projects that don’t deliver proportional value
- Improves collaboration: The scoring process itself forces cross-functional conversations that locate hidden dependencies and assumptions
- Maximizes workflow efficiency: Quick wins get prioritized, keeping momentum high while larger projects are planned properly
- Creates a sequenced roadmap: Instead of a flat list, you get a prioritized sequence that accounts for both value and feasibility
- Defines ownership: Once initiatives are plotted, it’s straightforward to assign owners and timelines based on quadrant priority
How to define and score impact vs effort
But how do you put a number on “impact”? This is the step that trips up most teams, and it’s also the step that determines whether your matrix produces useful results or just reorganizes your existing biases.
Impact analysis should be defined relative to your strategic objectives. For a product team, impact might mean the number of users affected, revenue potential, or alignment with quarterly OKRs. For an operations team, it might mean hours saved, error reduction, or customer satisfaction improvement. The key is to agree on the criteria before you start scoring.
Effort is typically easier to estimate, but it still benefits from structure. The method you choose depends on how much data you have and how quickly the team needs to move. Consider these common approaches:
- Numeric scale (1 to 10): Simple and fast. Each team member scores independently, then you average the results to reduce individual bias
- T-shirt sizing (S, M, L, XL): Less precise but faster for early-stage prioritization when detailed estimates aren’t available
- Revenue potential vs resource hours: More data-driven. Compare the projected financial outcome against the actual person-hours or budget required
- Weighted criteria: Assign weights to multiple factors (reach, confidence, strategic alignment) and calculate a composite score
Whatever method you choose, consistency matters more than precision. A team that uses T-shirt sizing consistently will get more reliable results than a team that switches between numeric scales and gut-feel rankings from meeting to meeting. For more prioritization methods, explore approaches like RICE and weighted scoring alongside the impact effort matrix.
Common challenges with prioritization
A structured framework makes prioritization more reliable, but knowing where teams typically get stuck helps you stay ahead. Here are the most common pitfalls and how to handle them:
- Subjective bias: Team members may inflate the impact of their own projects or underestimate effort on initiatives they’re excited about. Anonymous scoring or independent estimates before group discussion can reduce this
- The planning fallacy: As mentioned earlier, people consistently underestimate effort. Build in a buffer, or calibrate against completed projects of similar scope
- Stakeholder disagreement: When executives and execution teams disagree on priority, the matrix creates a neutral visual that grounds the conversation in shared criteria rather than hierarchy
- Scope creep: An initiative that starts as “low effort” can balloon once implementation begins. Re-evaluate quadrant placement regularly as new information crops up
The 4 quadrants of the impact effort matrix
The 4 quadrants of the impact effort matrix are quick wins (high impact, low effort), major projects (high impact, high effort), fill-ins (low impact, low effort), and thankless tasks (low impact, high effort). Each quadrant represents a different strategic recommendation for how to handle the initiatives that land there. Understanding all 4 is essential for using the matrix effectively.
What separates a useful matrix from a decorative one is how your team responds to each quadrant. Here’s what each one means and how to act on it.
Quick wins: high impact, low effort
Quick wins are the initiatives every team wants more of. They deliver significant value relative to the resources they consume, and they’re typically fast to implement. Prioritize these first.
Examples include:
- automating a recurring status report that currently takes someone 2 hours every week
- fixing a broken link on a high-traffic landing page
- updating onboarding email copy that’s driving support tickets.
These aren’t glamorous projects, but their impact-to-effort ratio makes them the most efficient use of your team’s time.
The risk with quick wins is ignoring them. Because they’re small, they often sit in a backlog while the team focuses on larger, more visible projects. A disciplined approach to the matrix ensures quick wins get executed consistently.
Major projects: high impact, high effort
Major projects deliver substantial results but require significant planning, resources, and time. Think of initiatives like migrating to a new CRM, launching a new product line, or redesigning your company’s website.
These initiatives belong on the roadmap, but they need risk assessment, milestone planning, and cross-functional coordination before you commit resources. The impact effort matrix helps you identify which major projects deserve investment and which ones are deferred until capacity allows.
A common mistake is treating everything in this quadrant as equally important. Rank major projects against each other using additional criteria (strategic alignment, time sensitivity, dependencies) to determine sequencing.
Fill-ins: low impact, low effort
Fill-ins are the “nice to have” initiatives. They don’t move the needle significantly, but they also don’t cost much to complete. Examples include updating internal documentation, making minor UI adjustments, or reorganizing a shared drive.
These are ideal for downtime, those moments when your team has capacity between larger projects or is waiting on dependencies. Don’t schedule fill-ins during peak sprint periods, but don’t ignore them entirely either. Over time, small improvements compound.
Thankless tasks: low impact, high effort
Thankless tasks consume disproportionate resources relative to the value they produce. Maintaining a legacy system that only a handful of people use, building exhaustive manual reports that no one reads, or pursuing compliance on a standard that doesn’t apply to your industry — these are all candidates for deprioritization or elimination.
The hardest part of this quadrant is letting go. Teams often continue investing in thankless tasks because of sunk-cost bias (“we’ve already put so much into this”) or organizational inertia. The matrix gives you a visual, data-backed reason to stop.
How to create an impact effort matrix: 5 steps
Building an impact effort matrix doesn’t require specialized software or a certification. It does require structured thinking and cross-functional input. Here’s a 5-step process that works whether you’re using sticky notes on a whiteboard or a digital platform.
Step 1: Gather your team and define objectives
An impact effort matrix is most effective when it involves the people closest to the work. Bring together a cross-functional group (project managers, team leads, subject matter experts) and align on what “impact” and “effort” mean in your specific context. A marketing team might define impact as pipeline contribution, while an engineering team defines it as user adoption. These definitions need to be explicit and shared before anyone starts scoring.
Step 2: List all initiatives
Before plotting anything, you need a comprehensive list. Pull from backlogs, roadmaps, stakeholder requests, and recurring meeting notes. The goal is to capture everything competing for your team’s attention, not just the initiatives that are top of mind. Incomplete lists produce incomplete matrices.
Step 3: Score each item on impact and effort
Using the scoring approach your team agreed on (numeric, T-shirt sizing, weighted criteria), evaluate each initiative independently. Have team members score individually first, then compare and discuss. This reduces groupthink and spots disagreements early, when they’re easier to resolve.
Step 4: Plot items on the matrix
Place each initiative on the grid based on its scores. Whether you’re using a whiteboard, sticky notes, or a digital platform, the visual output should be immediately scannable. Clusters reveal patterns: a pile-up in the “major projects” quadrant might signal that your team is overcommitting to high-effort work at the expense of quick wins.
A platform like monday.com’s AI Work Platform makes this visual and shareable across teams, with formula and rating columns that automate the scoring and placement process. You can also explore a prioritization template to get started quickly.
Step 5: Build your action plan and assign owners
Prioritize quadrant by quadrant: quick wins first, then major projects with proper planning, fill-ins as capacity allows, and thankless tasks deprioritized or eliminated. Every initiative that makes the cut needs an owner and a timeline. Without accountability, even the most well-organized matrix becomes a snapshot that gathers dust.

Impact effort matrix examples
Seeing the matrix in action across different contexts makes it easier to apply to your own work. Here are 4 examples spanning different functions and industries.
Marketing: campaign prioritization
A marketing team is weighing 3 initiatives for the upcoming quarter: an SEO content refresh of 15 existing articles (high impact on organic traffic, moderate effort), a paid social campaign targeting a new audience segment (moderate impact, low effort), and a complete email drip series rebuild (high impact, high effort). Plotting all 3 on the matrix reveals that the SEO refresh is the quick win, the paid social campaign is a fill-in, and the email rebuild is a major project that needs proper scoping before the team commits.
Creating an impact effort matrix for their marketing management strategy helps teams avoid the common trap of jumping straight into the largest, most exciting project without first capturing the quick wins sitting right in front of them.
Product management: feature backlog prioritization
An agile product team has a backlog of 40 feature requests. Using the matrix, they identify that fixing a login bug affecting 30% of users is a quick win (high impact, low effort), while building a completely new onboarding flow is a major project (high impact, high effort). A cosmetic dashboard redesign lands in the fill-ins quadrant, and a rarely requested API integration falls under thankless tasks. The matrix gives the product owner a structured rationale for sprint planning.
Operations: process improvement
An operations team evaluates 2 competing initiatives: automating invoice processing (high impact on time savings, moderate effort to implement) versus conducting a manual audit of 200 vendor contracts (low impact on daily operations, very high effort). The matrix makes the decision straightforward. Automate first, then defer the audit until capacity opens up or a triggering event (like a compliance review) changes the impact calculation.
HR: employee engagement initiatives
An HR team is weighing a formal mentorship program (high impact on retention, high effort to design and launch), an annual employee engagement survey (moderate impact, low effort), and a new peer recognition platform (moderate impact, moderate effort). The survey is a quick win they can execute immediately. The mentorship program is a major project worth planning for next quarter. The recognition platform sits in the middle and can be sequenced based on available budget.
Tips for getting more out of your impact effort matrix
Building a matrix is only the starting point. How you maintain and iterate on it determines whether it becomes a living decision-making framework or a one-time exercise. Here are six practical tips for making your matrix consistently useful.
- Use a consistent scoring scale: Whether you choose 1 to 5, 1 to 10, or T-shirt sizing, the entire team must use the same method. Mixed scales produce unreliable placements and erode trust in the process
- Involve cross-functional stakeholders: Engineers estimate effort differently than marketers, and executives define impact differently than individual contributors. Including multiple perspectives produces a more accurate matrix
- Review and update quarterly: Priorities shift as projects progress, new data emerges, and business conditions change. Revisit your matrix at least once per quarter, or at the start of each sprint for agile teams, to keep it current
- Avoid sunk-cost bias: If a high-effort project isn’t delivering the impact you projected, move it to the thankless tasks quadrant. The resources you’ve already spent don’t change the future return
- Start with one team or project: Don’t try to build an organization-wide matrix on your first attempt. Pilot with a single team, refine your scoring criteria, and expand once the process is proven
- Combine with other frameworks: Use the impact effort matrix for initial sorting, then apply RICE or ICE scoring for deeper analysis on the initiatives that make the shortlist. For guidance on building an effective priority list, layer multiple approaches based on your team’s needs
Impact effort matrix vs other prioritization frameworks
The impact effort matrix is one of several structured approaches to prioritization. Choosing the right framework depends on your team’s size, the type of work you’re evaluating, and how much data you have available. Here’s how the most common frameworks compare.
| Criteria | Impact effort matrix | Eisenhower matrix | RICE scoring | ICE scoring |
|---|---|---|---|---|
| Axes/factors | Impact vs effort | Urgency vs importance | Reach, impact, confidence, effort | Impact, confidence, ease |
| Best for | Initiative-level prioritization | Personal or daily task management | Product feature scoring | Quick feature scoring |
| Complexity | Low (visual and intuitive) | Low (4 quadrants) | Medium (requires data inputs) | Low to medium (3 factors) |
| Team size | Any | Individual or small team | Product teams | Product teams |
| Limitation | Subjective without defined scoring criteria | Doesn't account for effort or resources | Can be data-intensive | Confidence factor is subjective |
The Eisenhower Matrix is ideal for individual productivity, sorting daily work into “do, schedule, delegate, delete” buckets based on urgency and importance.
What is the difference between an impact effort matrix and the Eisenhower Matrix? The impact effort matrix evaluates potential impact against required effort, while the Eisenhower Matrix evaluates urgency against importance. The critical difference is the “effort” axis: the Eisenhower Matrix doesn’t account for resource cost, which makes it less useful for team-level project prioritization.
RICE (reach, impact, confidence, effort) and ICE (impact, confidence, ease) scoring models are popular in product management. They’re more granular than the impact effort matrix, incorporating additional variables like confidence levels and user reach. This makes them powerful for feature-level decisions but heavier to implement for broader initiative planning. The action priority matrix is another related framework worth exploring if you want to compare approaches side by side.
For teams that need visual, collaborative prioritization across a range of initiative types, the impact effort matrix is often the strongest starting point. You can also layer in a risk matrix to evaluate uncertainty alongside effort and impact.

How monday.com's AI Work Platform helps you prioritize
Once you’ve built the strategic foundation (defined your criteria, scored your initiatives, and mapped them to quadrants), the next step is operationalizing your matrix so it stays current and actionable. This is where monday.com’s AI Work Platform fits in.
Build and visualize your impact effort matrix
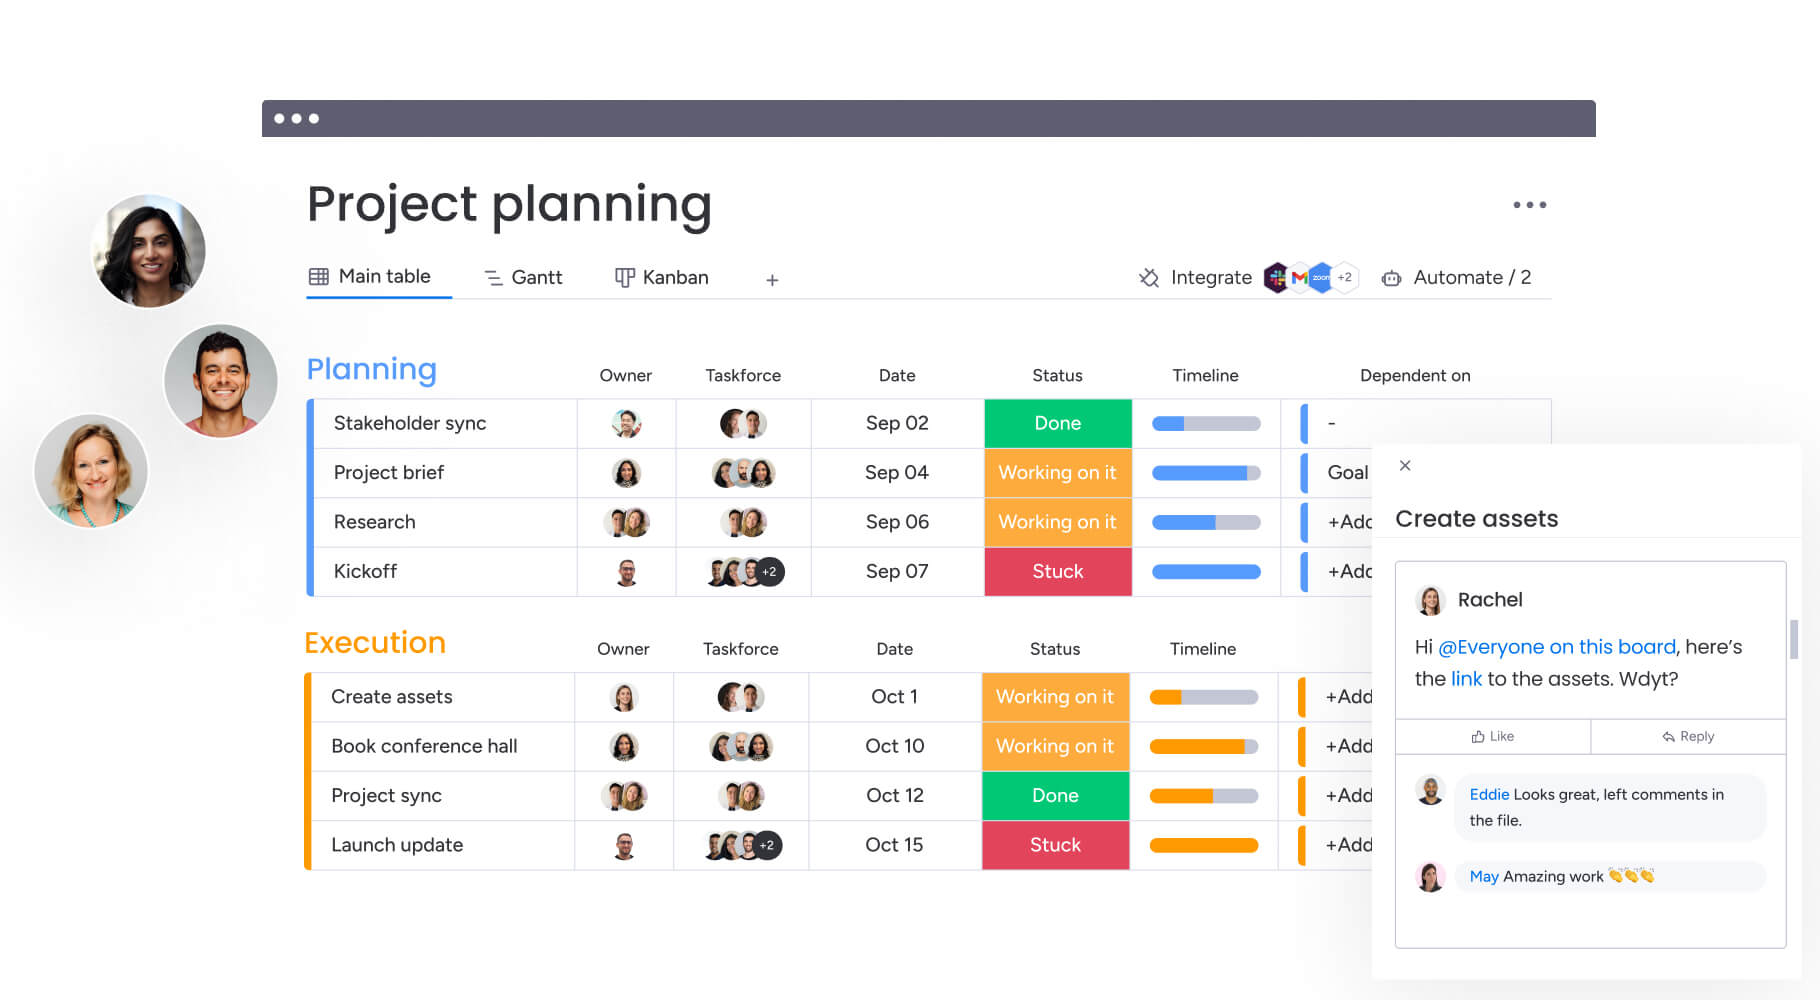
Formula and rating columns let you create custom impact (1 to 10) and effort (1 to 10) scores directly on your project board. You can use a Kanban view grouped by quadrant (quick wins, major projects, fill-ins, thankless tasks) to replicate the matrix layout digitally, making it accessible to everyone on the team, not just the people who were in the room when you built it.
Dashboards with 10+ drag-and-drop widgets give you a real-time view of how prioritized work is progressing. Instead of updating a static matrix after every status meeting, your dashboard reflects the current state automatically. You can also start from a ready-made template, like the weekly planning template or marketing strategy template, and adapt it to your prioritization workflow.
Automate your prioritization workflow
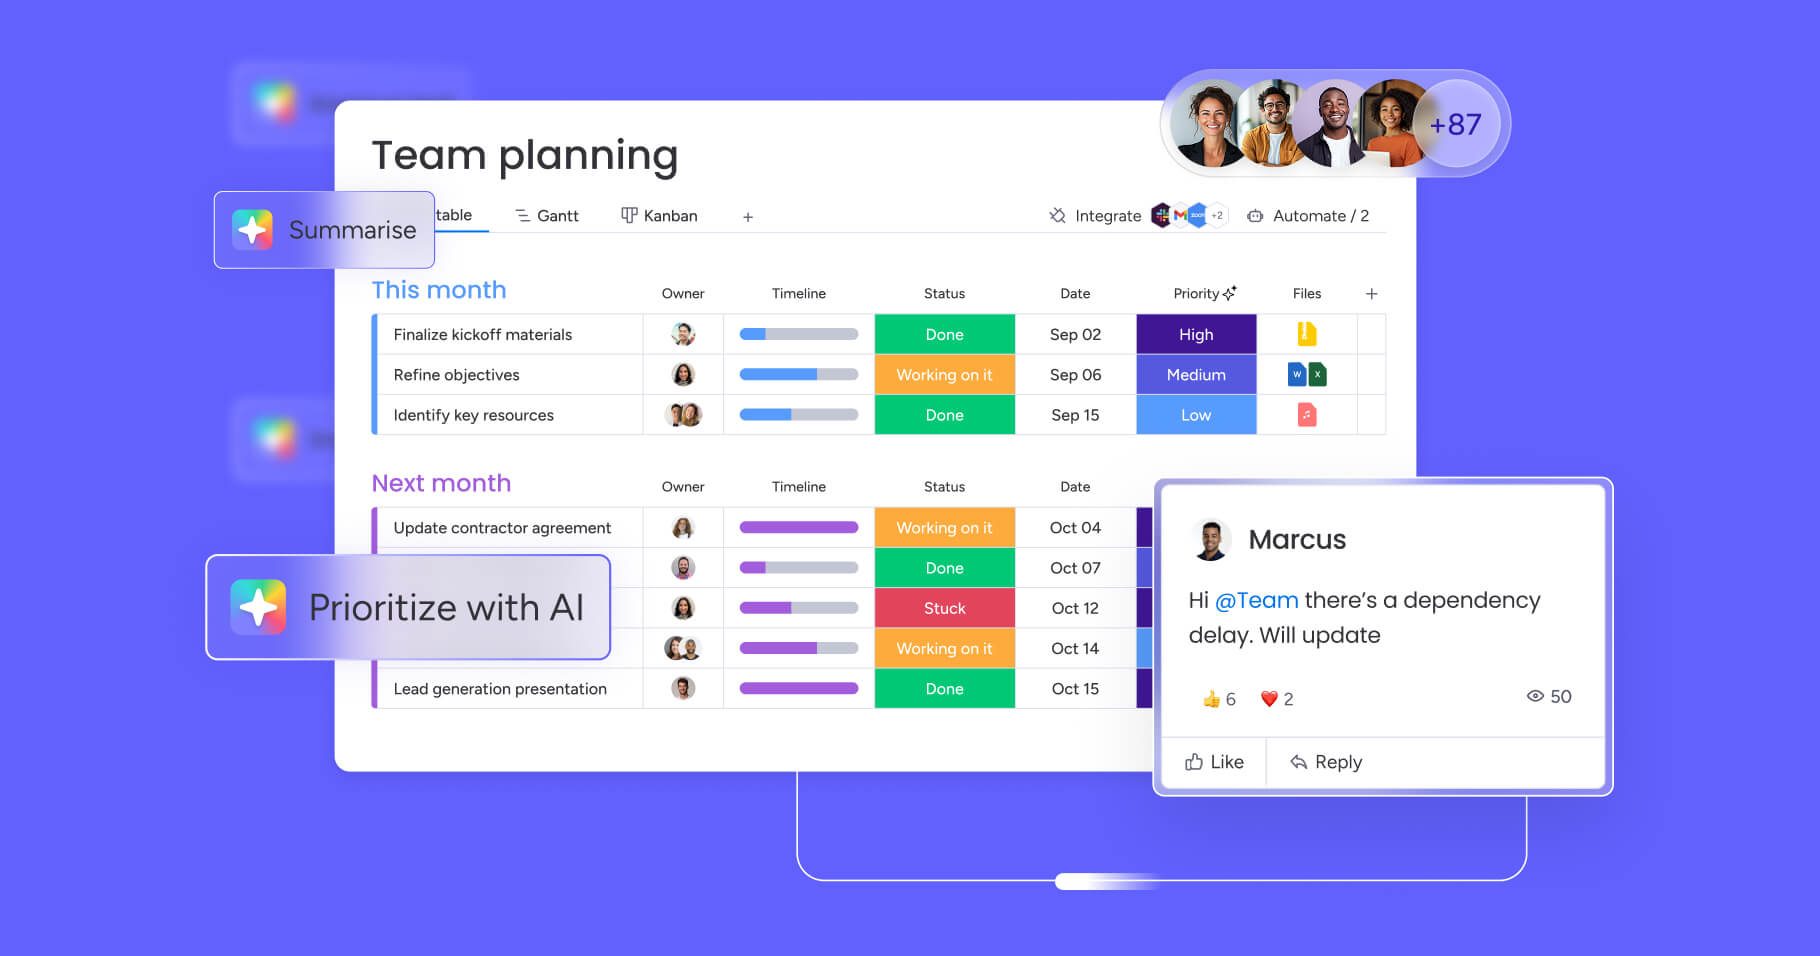
With 200+ automation recipes, you can build rules that move initiatives between quadrants automatically based on score changes. For example: “When effort score drops below 3 and impact score is above 7, move item to the Quick Wins group.” This keeps your matrix current without requiring manual updates every time an estimate changes.
AI Blocks let you auto-categorize new initiatives by impact and effort based on historical data from your workspace. The Workload View also helps you balance team capacity when assigning high-effort projects, ensuring that your most ambitious initiatives don’t burn out your most productive people.

Use AI to find smarter priorities
monday sidekick, the platform’s built-in AI assistant, understands your organizational data, workflows, and history. You can ask it to assess impact and effort levels for your initiatives, generate priority reports, or recommend which quadrant an item belongs in based on comparable past projects.
monday agents take this further. The Project Analyzer agent flags bottlenecks in high-effort projects and adjusts schedules proactively. The Risk Analyzer agent detects schedule, dependency, and workload risks on items that might need re-evaluation, catching problems before they escalate.
With monday vibe, teams can build a custom prioritization app tailored to their specific criteria. Describe the matrix logic in plain language, and vibe generates a fully functional app with no code required. Through monday MCP (Model Context Protocol), you can connect external AI assistants like Claude, ChatGPT, or Copilot directly to your workspace, enabling deeper cross-board analysis and automated priority suggestions.
Get started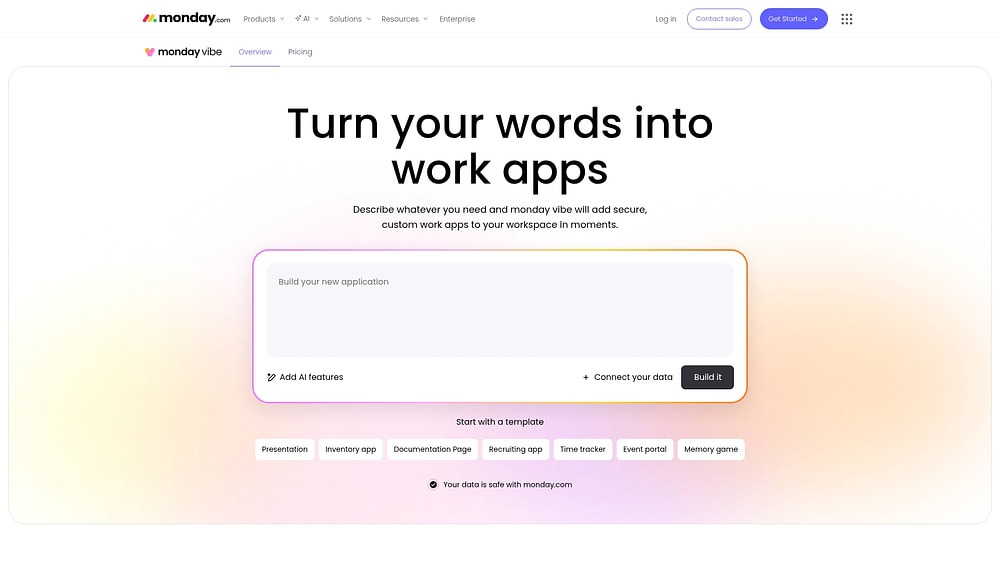
Make every project count with smarter prioritization
An impact effort matrix gives your team a visual, collaborative framework for focusing on the work that delivers the most value relative to the resources it requires. By defining scoring criteria, mapping initiatives to quadrants, and reviewing regularly, you transform prioritization from a recurring debate into a structured, repeatable process.
Combining the matrix with AI-powered prioritization on monday.com’s AI Work Platform keeps the process dynamic and data-driven. Automations move initiatives between quadrants as estimates change, dashboards flag progress in real time, and AI agents flag risks before they become blockers. The result is a prioritization workflow that evolves with your team instead of gathering dust on a whiteboard.
Get startedFAQs
What is an impact effort matrix?
An impact effort matrix is a visual prioritization framework that plots initiatives on two axes (potential impact and required effort) to help teams decide what to work on first. It's also commonly referred to as an action priority matrix.
What are the 4 quadrants of the impact effort matrix?
The 4 quadrants of the impact effort matrix are quick wins (high impact, low effort), major projects (high impact, high effort), fill-ins (low impact, low effort), and thankless tasks (low impact, high effort). Quick wins should be tackled first, major projects require careful planning, fill-ins are ideal for downtime, and thankless tasks should be deprioritized or eliminated.
How do you calculate impact vs.effort?
To calculate impact vs effort, teams use consistent scoring methods such as numeric scales (1 to 10), T-shirt sizing (S, M, L, XL), revenue potential vs resource hours, or weighted criteria. The key is for the entire team to agree on the scoring approach before evaluating any initiatives.
What is the difference between an impact effort matrix and the Eisenhower Matrix?
The impact effort matrix evaluates potential impact against required effort, while the Eisenhower matrix evaluates urgency against importance. The critical difference is the "effort" axis: the Eisenhower matrix doesn't account for resource cost, making the impact effort matrix more suitable for team-level project prioritization.
How often should you update your impact effort matrix?
You should update your impact effort matrix at least once per quarter, or at the start of each sprint for agile teams. Priorities shift as projects progress and new information emerges, so regular updates keep your matrix accurate and actionable.
How does monday.com's AI Work Platform help with prioritization?
monday.com's AI Work Platform supports impact effort prioritization through formula and rating columns for scoring, real-time dashboards for visualization, 200+ automation recipes for routing initiatives by priority, and AI features like Sidekick and Agents for identifying smarter priorities based on your workspace data.