
Every major investment decision eventually lands on someone’s desk as a spreadsheet full of assumptions and a room full of opinions. The stakes are high; one wrong call on a technology rollout, a new hire, or a process overhaul can cost your organization months of productivity and thousands in wasted budget. That’s where a cost benefit analysis template changes the equation. A CBA template gives you a standardized, repeatable process for weighing projected expenses against expected returns, so you can make confident, data-driven calls.
This guide walks you through everything you need: what a cost benefit analysis template includes, five free templates for common scenarios, a six-step evaluation process, the key formulas behind every calculation, and how monday.com’s AI Work Platform turns the entire process from a static document into a live decision engine.
Key takeaways
- Streamline decision-making: Cost-benefit analysis templates remove guesswork, reduce errors, and save time by standardizing how you evaluate business investments.
- Follow six essential steps: Define the scope, identify costs and benefits, assign values, apply discount rates, calculate key metrics, and outline recommendations.
- Collaborate effectively: monday.com’s AI Work Platform transforms static templates into shared, collaborative spaces where teams contribute data simultaneously, calculations update automatically, and analysis connects directly to execution.
- Avoid common pitfalls: Hidden costs, overlooked benefits, inaccurate discount rates, unrealistic timelines, missing stakeholder input, ignored non-financial factors, and forgotten maintenance expenses.
- Match template to complexity: Choose simple templates for straightforward decisions, specialized ones for technology investments, and comprehensive formats for large-scale or strategic initiatives.
What is a cost-benefit analysis template?
A cost-benefit analysis template is a pre-built framework that guides you through comparing project costs against expected benefits. Sometimes called a cost analysis template, it provides structured sections for documenting expenses, calculating returns, and making data-driven decisions about whether to proceed with an investment. Throughout this article, we’ll use “CBA template” as shorthand.
These templates eliminate the guesswork from financial evaluation. Instead of building analysis from scratch, you get standardized categories, built-in formulas, and professional formatting that ensures nothing gets overlooked.
Cost-benefit analysis: your financial scorecard
Cost-benefit analysis (CBA) quantifies the pros and cons of any decision in monetary terms. You identify all costs, such as equipment, labor, training, and then compare them against benefits like revenue increases or time savings.
Think of it as a financial scorecard for your project. Every expense gets documented, every benefit gets valued, and the final calculation tells you whether the investment makes sense.
How does a CBA template differ from ROI or NPV analysis?
A CBA template is a comprehensive framework that captures all costs and benefits, including intangible ones like employee satisfaction or brand reputation, across a defined timeframe. ROI, by contrast, is a single percentage metric that expresses return relative to investment. Net present value (NPV) adjusts future cash flows to reflect what they’re worth in today’s dollars, accounting for the time value of money. A CBA template often includes both ROI and NPV calculations as components within the broader analysis, making it the most complete evaluation approach for complex decisions involving multiple stakeholders.
How cost-benefit analysis templates accelerate decision-making
Cost benefit analysis templates simplify complex financial evaluations by turning them into structured, step-by-step processes. They give beginners a solid framework to follow and help experienced analysts save valuable time setting up their models.
Key benefits of using CBA templates
Ready-made templates deliver immediate value through standardization and time savings. Here’s what makes them essential for smart decision-making:
- Consistent methodology: Every project gets evaluated using the same criteria.
- Reduced errors: Built-in formulas prevent calculation mistakes.
- Faster analysis: Skip the setup and focus on gathering accurate data.
- Professional output: Present findings that executives trust.
5 free CBA templates for every business
Different projects demand different analytical approaches. A simple website update might need basic cost tracking, while enterprise software requires deep financial modeling. These five templates match common business scenarios with the right level of detail.
1. Simple cost-benefit analysis template
Perfect for first-time users and straightforward projects. This template covers the essentials without overwhelming complexity.
It includes sections for one-time costs, recurring expenses, direct benefits, and indirect advantages. The calculations stay simple — total costs, total benefits, and basic ROI. Use this when you need quick answers for smaller investments or initial project screening.
2. Excel cost-benefit analysis template

Excel templates harness the platform’s calculation power for more sophisticated analysis. Formulas automatically compute net present value, update charts as you input data, and highlight key metrics through conditional formatting.
These templates handle complex scenarios like multi-year projects, varying cash flows, and sensitivity analysis. Built-in pivot tables let you slice data multiple ways without manual recalculation.
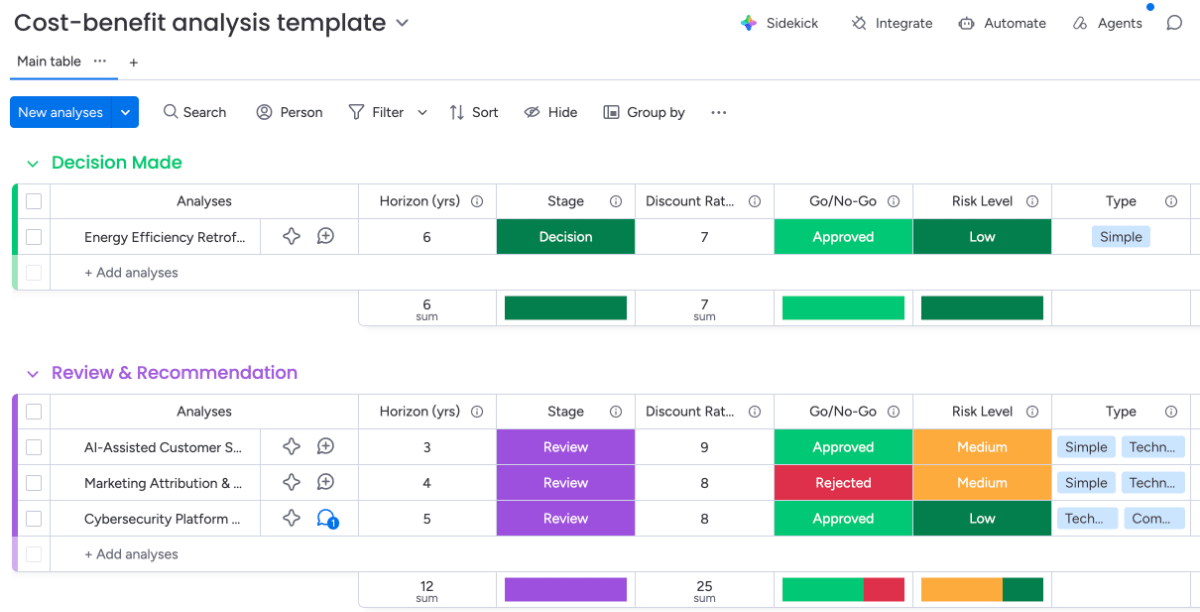
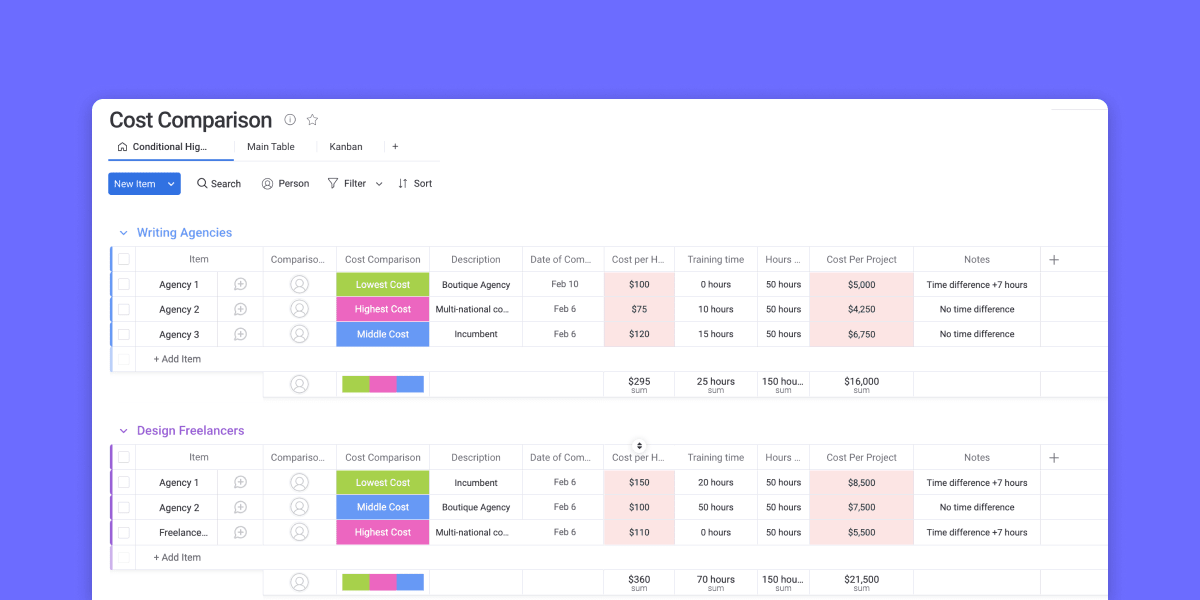
3. Project management CBA template
This template connects financial analysis to project execution realities. It accounts for resource allocation, timeline dependencies, and stakeholder-specific benefits that standard templates might miss.
For teams who want to go beyond static files, you can also build your own CBA directly on monday.com’s AI Work Platform, linking cost-benefit analysis to live project tracking so actual costs unfold against projections in real time.
4. Software cost-benefit analysis template
Technology investments bring specific challenges that general templates often miss. This version focuses on the financial and operational factors unique to software adoption and implementation.
Key considerations include:
- Licensing models: Compare one-time purchases versus subscription plans.
- Implementation phases: Outline setup, configuration, and rollout timelines.
- Integration complexity: Account for connections with existing systems.
- User adoption: Estimate training needs and learning curves.
- Ongoing costs: Include maintenance, updates, and productivity impacts.
- Hidden expenses: Capture data migration, downtime, and support requirements.
5. Strategic initiative CBA template
Major organizational changes require analysis beyond immediate financial returns. This comprehensive template evaluates market positioning, competitive advantages, and cultural transformation alongside traditional metrics, ensuring thorough benefits management.
It provides frameworks for scenario planning, risk assessment, and long-term value creation that strategic decisions demand. Use this for mergers, market expansions, or fundamental business model shifts.
Essential components every CBA template must include
Strong templates share common elements that ensure thorough analysis. Understanding these components helps you evaluate templates and customize them for your specific needs.
Direct and indirect costs
Direct costs have obvious connections to your project, such as purchasing equipment, hiring consultants, or licensing software. These expenses appear on invoices and tie directly to implementation.
Indirect costs require deeper thinking. They include management oversight, shared resources, and opportunity costs of choosing this project over alternatives, which are often considered soft costs and can be harder to quantify. Missing these hidden expenses leads to budget overruns and surprised stakeholders.
Tangible and intangible benefits
Tangible benefits translate easily to dollars — faster processing saves labor hours, automation reduces errors, new features attract customers. These measurable outcomes form the foundation of your business case.
Intangible benefits like improved morale or enhanced reputation need creative valuation. For example, you can assign a proxy monetary value by linking employee satisfaction improvements to reduced turnover costs. For example, if your average replacement cost is $15,000 per employee and you expect a 5% reduction in attrition, that’s a quantifiable benefit. You can also use customer lifetime value or competitive benchmarking to assign monetary values to these softer benefits.
Timeline and discount rate
Money today holds more value than the same amount in the future. A discount rate adjusts for this difference by converting future cash flows into their present value.
Key points to consider:
- Purpose: Discount rates help measure the true worth of long-term returns.
- Typical range: Most businesses use rates between 5% and 15%.
- Risk level: Lower rates suit stable, low-risk projects, while higher rates apply to uncertain or high-return opportunities.
- Guidance: Finance teams can recommend the most appropriate rate for your organization.
Risk and sensitivity factors
What happens if costs run 20% higher? What if benefits take twice as long to materialize? Risk assessment explores these scenarios before they become reality and helps you manage cost variance effectively.
Your CBA template should include best-case, worst-case, and most likely projections. This range helps stakeholders understand potential outcomes and plan appropriate contingencies.
Executive summary section
Busy executives need answers fast. The summary distills your entire analysis into key findings, critical assumptions, and recommendations.
Write this section last but position it first. Include the cost-benefit ratio, payback period, and net present value in your budget proposal template. Highlight any major risks or dependencies that could affect the decision.
6 steps to complete your cost-benefit analysis
6 steps to complete your cost-benefit analysis
Follow this proven sequence to build comprehensive, defensible analysis. Each step creates foundation for the next, ensuring nothing gets missed.
Step 1: Define project scope and objectives
Fuzzy boundaries lead to fuzzy analysis. Define exactly what your project includes. Good scope definition specifies deliverables, timelines, affected departments, and success metrics. A well-defined scope ensures every cost and benefit is correctly attributed to the project. Without it, you risk counting expenses that belong to other initiatives or missing benefits that fall outside your original frame.
Step 2: Identify all costs and benefits
Cast a wide net when brainstorming impacts. Costs extend beyond purchase price to include training, integration, and ongoing support. You might want to create a cost breakdown structure to ensure no expense is overlooked. Benefits reach beyond direct savings to include risk reduction and strategic positioning.
What costs are hiding in plain sight? For technology and AI projects, this step is especially critical. A thorough CBA accounts for labor productivity loss during transition periods, training time, and the organizational effort required to adopt something new. Common categories to consider include:
- Setup costs: Initial purchases, installation, configuration.
- Operating costs: Maintenance, licenses, ongoing support.
- Transition costs: Training, temporary productivity loss, change management.
- Revenue gains: New sales, pricing improvements, market expansion.
- Efficiency gains: Time savings, error reduction, faster delivery.
Step 3: Assign monetary values
Use an estimate template to transform your lists into dollars using research, benchmarks, and expert input. Market data provides external validation while historical performance offers internal baselines.
For harder-to-quantify benefits, document your reasoning. If improved customer service reduces churn by 2%, show how you reached that estimate. Transparency builds credibility even when precision isn’t possible. Don’t skip intangible benefits entirely, assigning a conservative proxy value is more accurate than recording zero.
Step 4: Apply time value of money
Future cash flows need discounting to reflect present value. A dollar received 3 years from now is worth less than a dollar today.
The formula is straightforward: divide future value by (1 + discount rate) raised to the number of years. Most templates automate this calculation once you input the appropriate discount rate. Choosing the right timeframe matters just as much as the rate itself, so be sure to match it to the realistic lifecycle of your investment, not an arbitrary round number.
Step 5: Calculate key metrics
Different metrics answer different questions about your investment. Templates should calculate multiple perspectives automatically as you input data.
Cost-benefit ratio shows overall value creation. Net present value reveals dollar impact. ROI communicates percentage returns. Payback period indicates risk exposure. Together, these metrics paint a complete picture for decision-makers.
Step 6: Create recommendations
Numbers tell a story, but recommendations drive action. Connect your analysis to strategic priorities and organizational context.
Strong recommendations acknowledge both financial metrics and qualitative factors. They provide direct guidance while recognizing that perfect information rarely exists. Help stakeholders move forward with confidence based on thorough analysis. Once you’ve defined your framework, a connected platform can automate the calculation and tracking process, keeping your CBA current as conditions change.
CBA formulas and calculations made simple
Once you have your data in place, a few straightforward formulas can turn numbers into insights. Knowing how these calculations work helps you double-check results, explain your reasoning, and give stakeholders a view of each option’s potential.
The metrics below offer different ways to see value, from overall return to how long it takes to break even.
| Metric | Formula | What it tells you |
|---|---|---|
| Cost-benefit ratio | Total benefits ÷ Total costs | Values above 1.0 indicate positive returns |
| Net present value | PV of benefits - PV of costs | Actual dollar value created |
| Return on investment | (Benefits - costs) ÷ Costs × 100 | Percentage return on investment |
| Payback period | Initial investment ÷ Annual cash flow | Time to recover investment |
Cost-benefit ratio formula explained
The benefit cost ratio (BCR) is the simplest viability check: divide total benefits by total costs. A BCR above 1.0 means benefits exceed costs. The higher the ratio, the more attractive the investment. A BCR below 1.0 means costs outweigh benefits and the project isn’t financially justified.
This metric works well for quick comparisons but ignores timing. A project with high returns in year five might show the same ratio as one with immediate benefits.
Net present value calculation
NPV accounts for both magnitude and timing of cash flows using the present value formula: PV = FV ÷ (1 + r)^n, where FV is the future value, r is the discount rate, and n is the number of years. Positive NPV creates value. Negative NPV destroys it. Zero NPV breaks even.
This metric enables apples-to-apples comparison between different investments. It answers the fundamental question: how much value does this create in today’s dollars?
Formulas in action: IT software procurement
How do these formulas work in practice? Imagine your team is evaluating a $50,000 project management software investment with a 3-year horizon:
- Total costs (3 years): $50,000 license + $10,000 implementation + $15,000 training + $9,000 annual maintenance (×3) = $102,000
- Total benefits (3 years): $45,000/year in productivity gains + $15,000/year in error reduction = $180,000
- BCR: $180,000 ÷ $102,000 = 1.76 — the investment returns $1.76 for every dollar spent
- ROI: ($180,000 – $102,000) ÷ $102,000 × 100 = 76.5%
- Payback period: $75,000 (first-year costs) ÷ $60,000 (annual benefits) = 1.25 years
With a BCR well above 1.0 and a payback period under 18 months, this investment is financially justified. When should you use NPV instead of BCR? NPV is the stronger choice for multi-year projects where cash flows vary significantly over time, while BCR works well for straightforward, single-period comparisons.
Return on investment formula
ROI translates returns into familiar percentage terms. Stakeholders understand “76% return” more easily than complex present value calculations.
Remember that ROI ignores project duration. Consider both percentage return and time frame when evaluating investments.
Payback period analysis
How quickly will you recover your investment? Payback period provides this risk measure in simple terms, whether it’s months or years until break-even.
Shorter paybacks generally mean lower risk. However, this metric ignores benefits beyond the payback point. Use it alongside other measures for complete evaluation.
When to use a cost-benefit analysis template
Not every decision needs formal analysis. But certain situations demand rigorous evaluation to ensure smart resource allocation and risk management:
New project evaluation
When several projects compete for the same resources, a cost-benefit analysis offers a way to compare them. By quantifying each option’s potential value, you can prioritize initiatives that deliver the greatest overall impact.
Technology and software investments
Technology decisions involve complex trade-offs between upfront costs and long-term benefits. CBA templates help capture implementation complexity, training requirements, and productivity gains that justify investment.
Don’t forget hidden costs like integration effort, data migration, and ongoing maintenance. These often exceed initial purchase prices over the system’s lifetime. With 40% of enterprises expected to embed AI agents by end of 2026, using a structured CBA to evaluate AI adoption has become a standard practice, especially given that traditional cost models can underestimate true AI spend by 40–60%.
Process improvement initiatives
Efficiency gains require upfront investment in change management and system modifications. CBA quantifies whether productivity improvements justify disruption costs.
Factor in transition periods where performance may temporarily decrease, using an impact analysis template to understand potential disruptions. Include training time, documentation updates, and the learning curve’s impact on output.
Strategic business decisions
Major shifts like market expansion or business model changes need comprehensive analysis beyond pure financials. Templates help structure evaluation of competitive positioning, risk mitigation, and capability development.
These decisions often proceed despite marginal financial returns because strategic value outweighs immediate ROI. Document these considerations thoroughly in your analysis.
AI and automation investments
With 91% of project managers reporting that AI will have at least a moderate impact on project work, evaluating AI-related investments through a CBA framework has become essential. Projects targeting operational automation typically achieve payback within 12–18 months, while strategic AI initiatives average 24–36 months, making it critical to set realistic timeframes and account for hidden costs in data preparation, change management, and ongoing model maintenance.
7 common pitfalls in CBA and how to avoid them
Even the best analysis can go off track if critical details are overlooked. Small assumptions, missing data, or narrow perspectives can lead to decisions that look good on paper but fall short in practice.
By watching for these common pitfalls (and addressing them early) you can improve accuracy, build stronger business cases, and keep projects aligned with real-world outcomes.
1. Overlooking hidden costs
Projects routinely exceed budgets because hidden costs weren’t considered. Training time, productivity loss during transition, and unexpected technical requirements add up quickly.
Build contingency buffers into your overall cost estimation in project management approach. If similar projects typically run 15% over budget, factor that into your analysis upfront.
2. Ignoring intangible benefits
Focusing only on hard numbers misses significant value. Employee satisfaction, customer loyalty, and competitive positioning often justify investments beyond pure financial returns.
3. Using wrong discount rates
Discount rates dramatically affect long-term project evaluation. Too low overvalues future benefits. Too high rejects good investments.
Consult your finance team for guidance. They’ll consider your cost of capital, project risk, and alternative investment options.
4. Underestimating implementation time
Optimism bias plagues project timelines. Delays increase costs and postpone benefits, undermining your financial projections.
Review similar past projects for realistic baselines. Add buffer time for unexpected challenges and dependencies.
5. Excluding stakeholder input
The IT team knows technical costs. Operations understands process impacts. Customers reveal benefit potential. Gathering input from across the organization prevents major disconnects and surfaces costs or benefits that might otherwise go unnoticed.
6. Focusing only on financial metrics
Numbers matter, but strategic value often transcends ROI. Market positioning, risk reduction, and organizational capabilities provide compelling justification beyond financial returns. Balance quantitative analysis with qualitative assessment. Document strategic benefits even when they resist easy quantification.
7. Missing ongoing maintenance costs
Initial costs often stand out, but ongoing expenses can quietly erode returns over time. These hidden costs frequently exceed the upfront investment.
Key areas to include:
- Software subscriptions: Recurring fees that add up each year.
- Hardware replacements: Planned upgrades or component failures.
- Training and support: Continuous learning and onboarding for new team members.
- Renewals and upgrades: Version updates or extended service agreements.
Calculate the total cost of ownership across the investment’s full lifecycle to maintain strong cost management from start to finish.
Transform your CBA process with monday.com's AI Work Platform
A CBA built in a static spreadsheet is a snapshot; it goes stale the moment a cost estimate changes or a new stakeholder enters the picture. What if your analysis could update itself, pull in data from live projects, and keep every contributor on the same page without a single email chain?
monday.com’s AI Work Platform transforms cost-benefit analysis from isolated documents into living decision engines. Teams collaborate seamlessly, calculations update automatically, and analysis connects directly to execution. Here’s how the platform stacks up against traditional approaches:
| Capability | Spreadsheet | Manual process | The AI Work Platform |
|---|---|---|---|
| Real-time cost updates | No | No | Yes — dashboards auto-update |
| Formula calculations | Manual | Manual | Formula columns (BCR, NPV, ROI) |
| Stakeholder collaboration | Email back-and-forth | Meetings | Live shared boards |
| Document extraction | Manual copy-paste | Manual | AI blocks extract from PDFs/invoices |
| Approval workflows | Email chains | Manual sign-off | Automated notifications |
| Portfolio-level view | Multiple files | Manual roll-up | Portfolio dashboards |
| AI-assisted analysis | None | None | Agents, sidekick, MCP |
Dashboards for real-time budget tracking
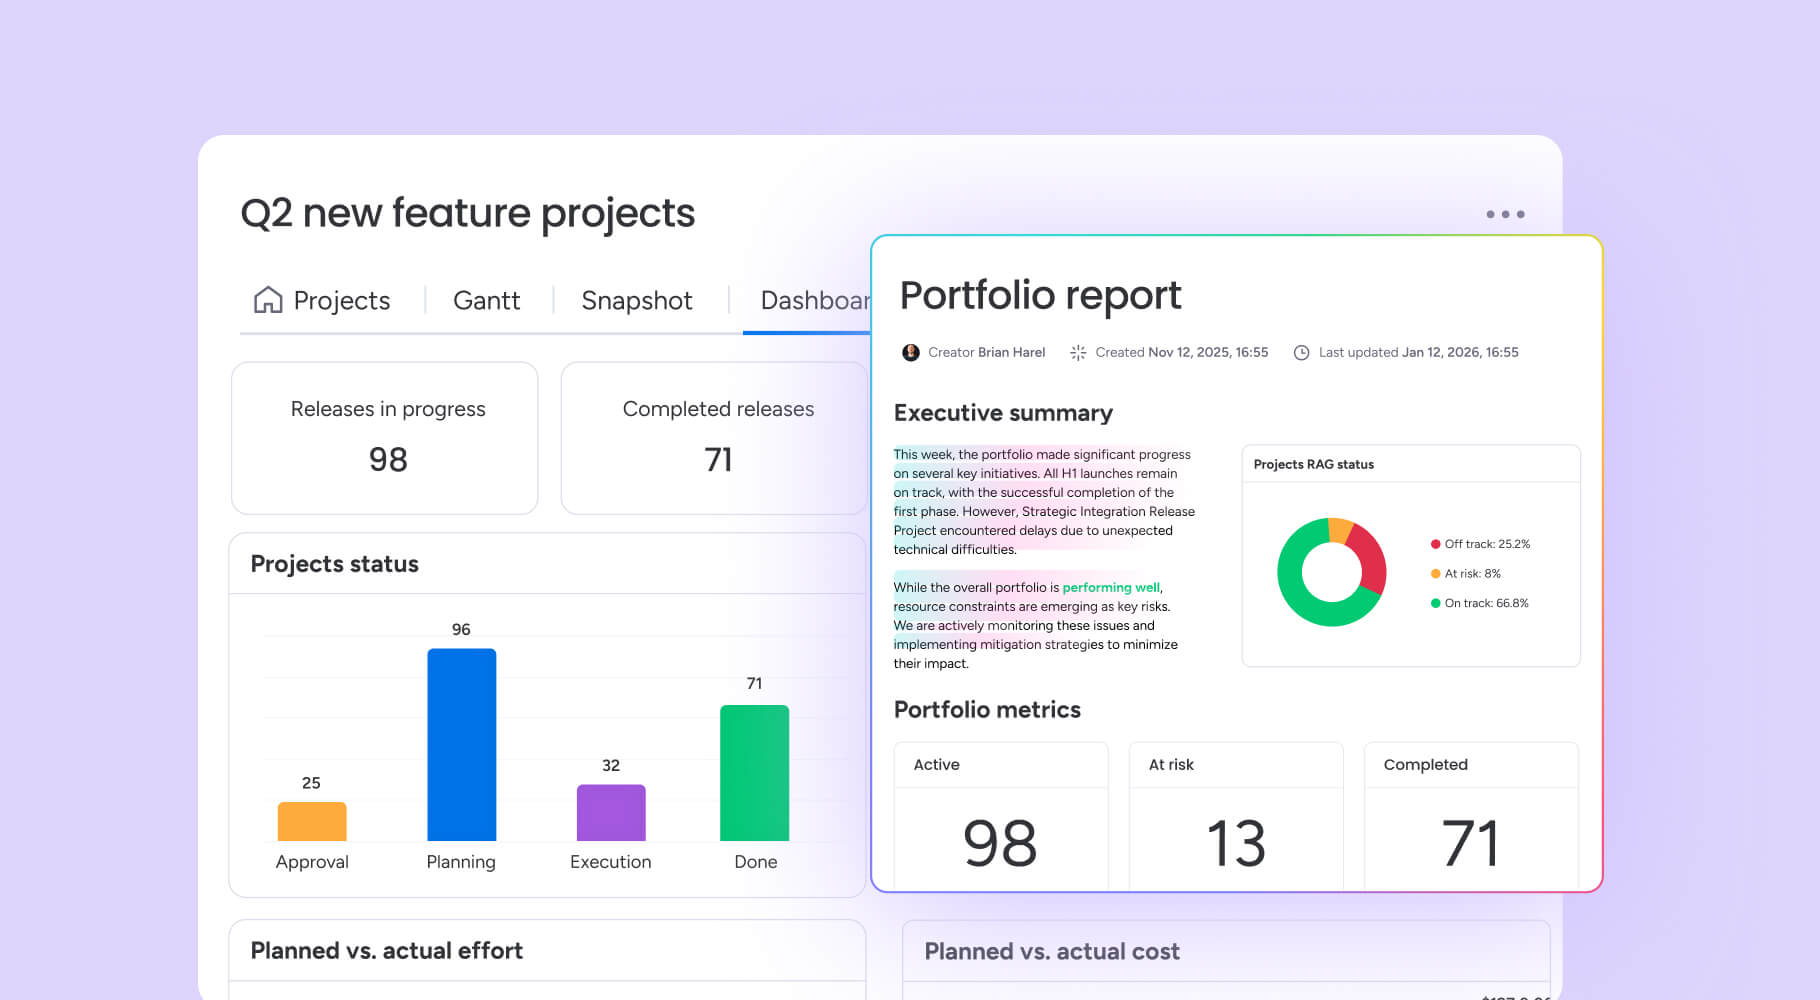
Custom dashboards with 10+ drag-and-drop widgets give you real-time budget-versus-benefit visualization at a glance. Track cost variance across projects, monitor benefit realization milestones, and present portfolio-level ROI reports to executives, all without switching between files or building charts manually.
Formula columns for automated calculations
Calculate BCR, ROI, and NPV directly on your boards using formula columns. Change an assumption and watch every metric recalculate instantly. Test multiple scenarios quickly to understand which variables have the biggest impact on your business case.
AI blocks for smarter data collection
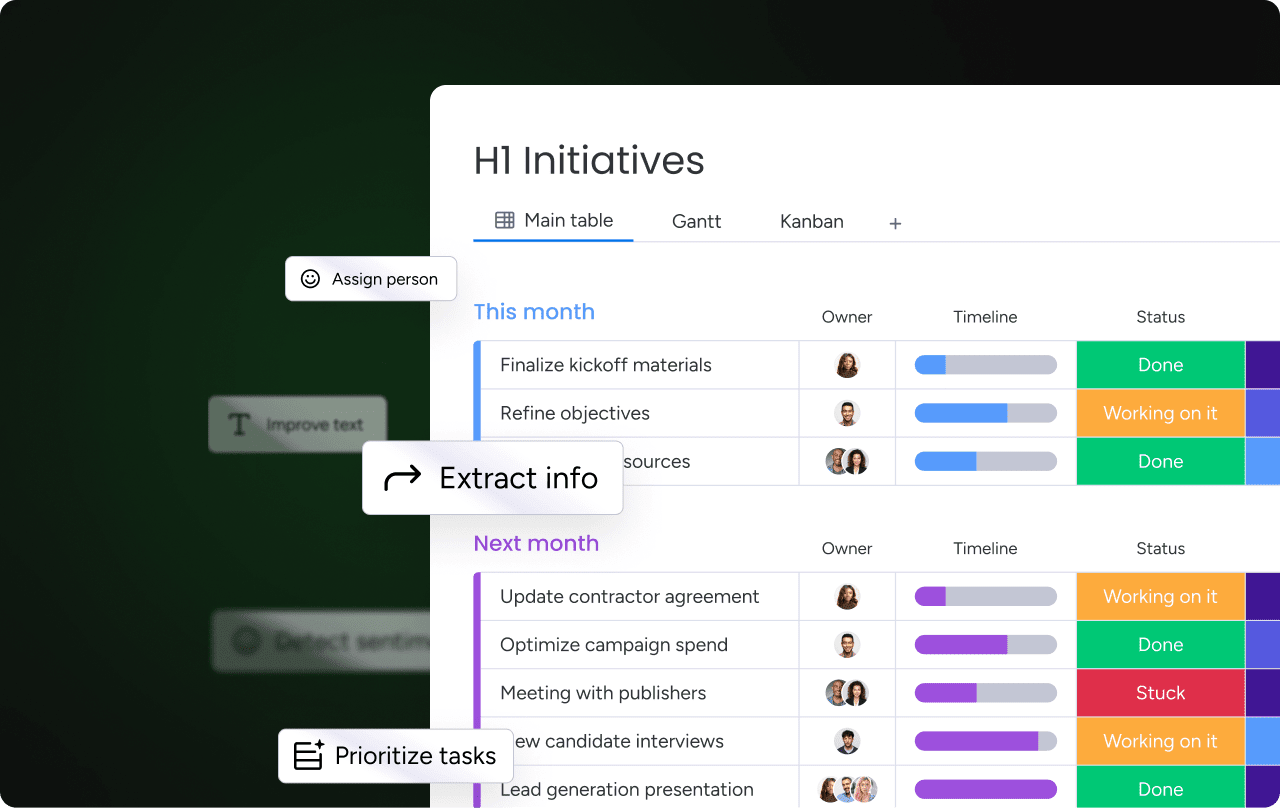
AI blocks extract cost data from contracts, invoices, and PDFs automatically, eliminating hours of manual copy-paste. Use the Categorize block to sort expenses by type at scale, and the Summarize block to generate executive summaries of CBA findings that highlight the numbers that matter most.
Automations for streamlined approvals
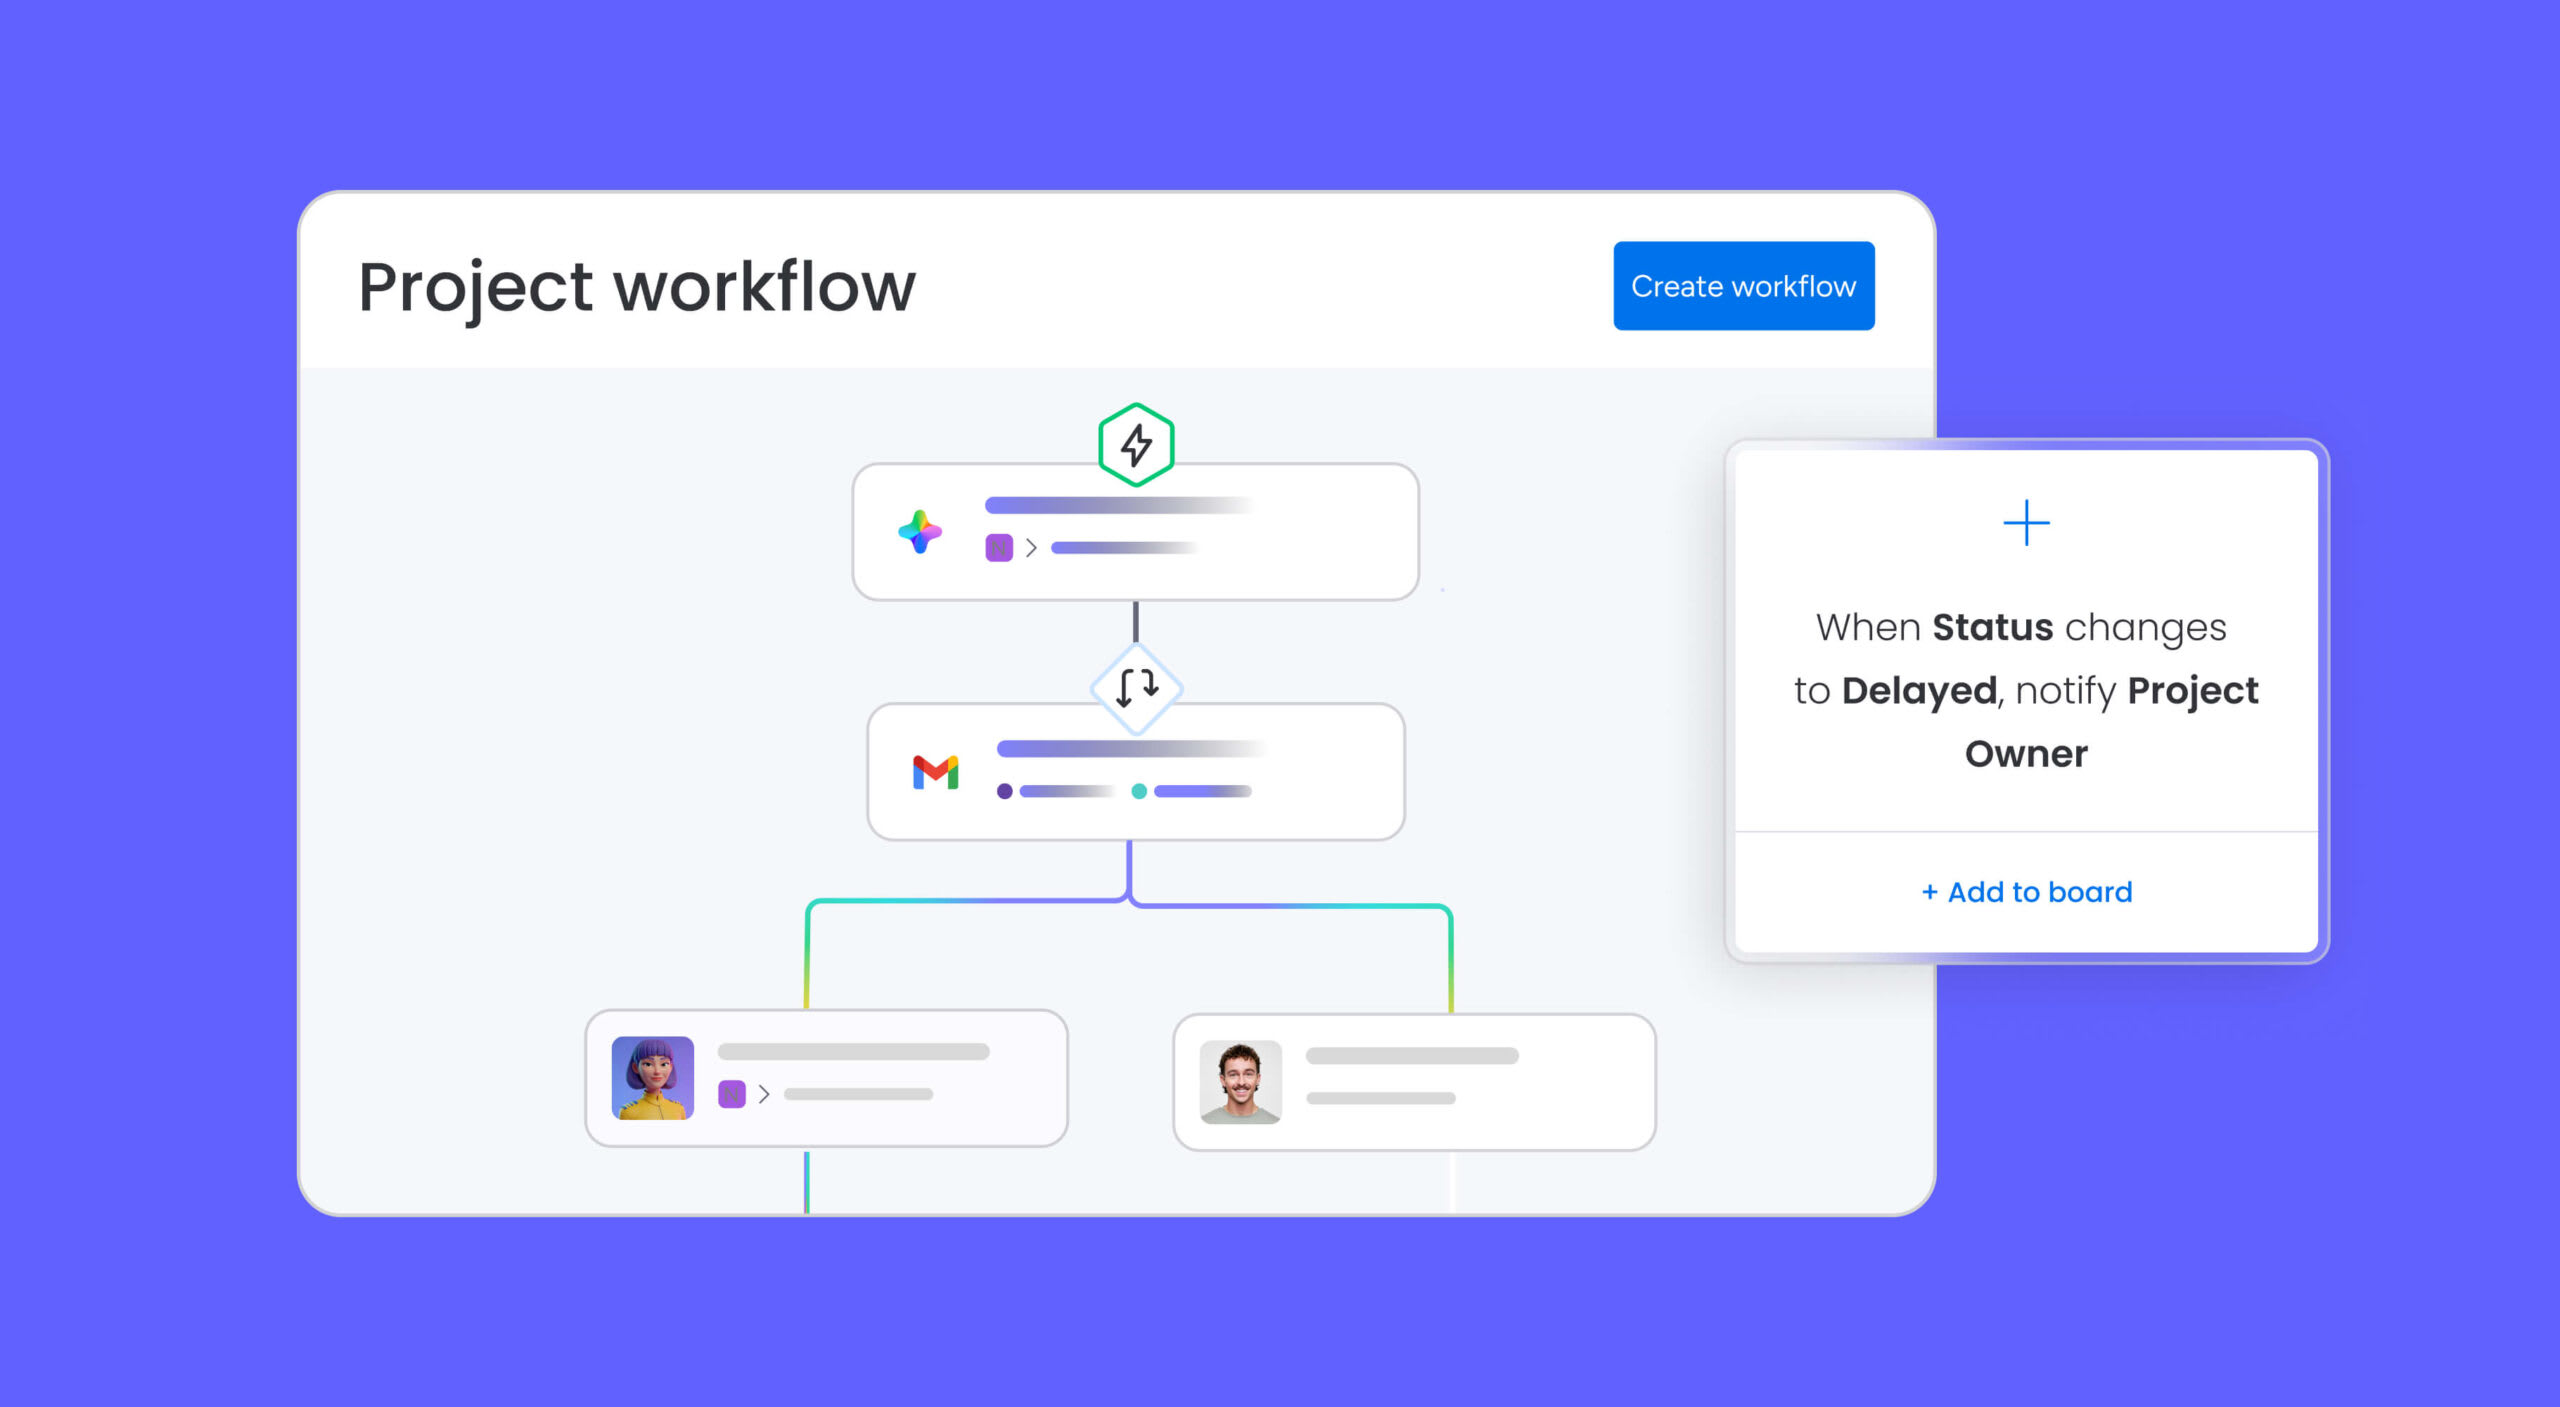
Set approval workflows that trigger when budget thresholds are crossed, send automatic stakeholder update reminders, and generate reports that refresh themselves. With 200+ integrations connecting your existing data sources, cost inputs flow into your CBA without manual effort.
Gantt charts for phased cost projections
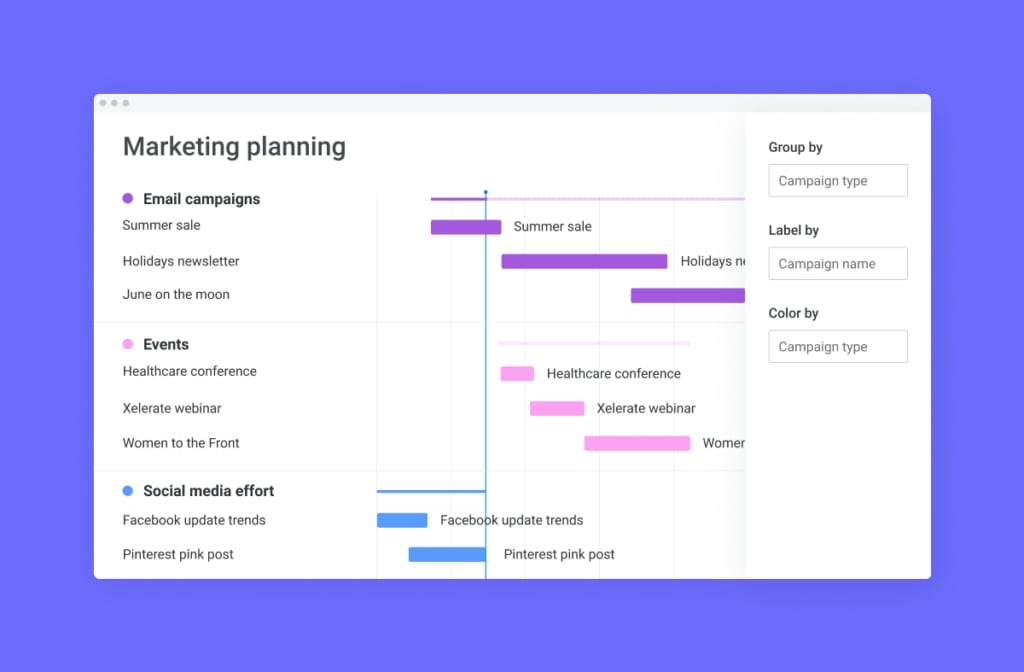
Visualize phased costs and benefit timelines alongside project milestones using Gantt charts with baseline comparison. Compare planned versus actual spending in real time, and identify where timeline delays are pushing costs higher or postponing expected returns.
monday agents for automated analysis

Purpose-built AI agents handle the repetitive work so your team can focus on strategy. The Project Analyzer monitors projects in real time and flags bottlenecks that could affect cost projections. The Vendor Researcher analyzes procurement requirements and researches supplier pricing, feeding accurate cost data directly into your CBA.
monday vibe and monday MCP
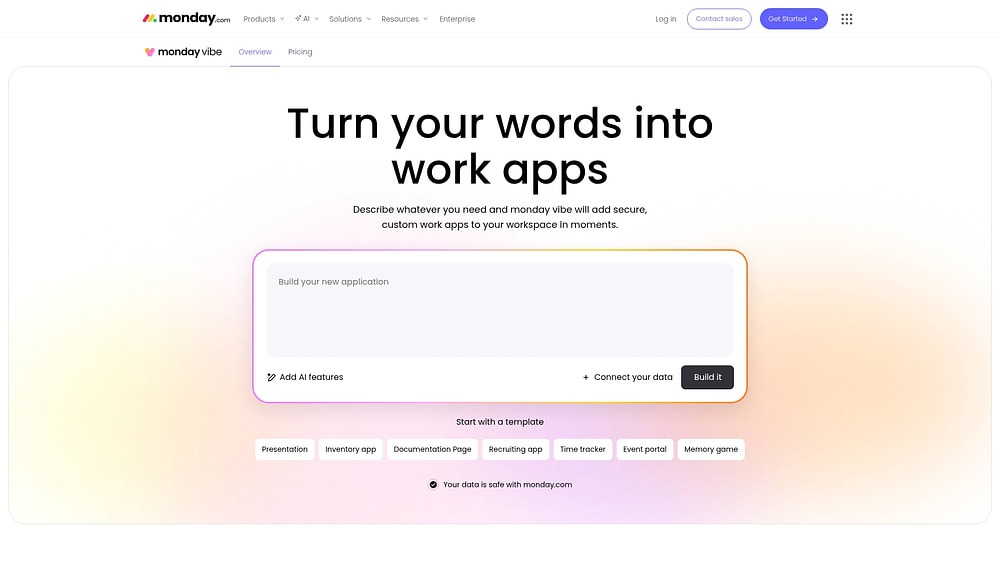
Need a custom CBA app for a specific workflow? With monday vibe, anyone can describe what they need and build a secure, tailored work app, like a sales forecasting dashboard or an executive cost overview, without writing a single line of code. And with monday MCP, you can connect external AI assistants like Claude, ChatGPT, or Copilot to analyze CBA data directly from your boards, pulling cross-project insights that would take hours to assemble manually.
Proven ROI you can measure
The results speak for themselves. According to a Forrester Total Economic Impact study, monday.com customers achieve 346% ROI over three years with less than a 4-month payback period. Organizations report $4.14M saved through process optimization, $121K in productivity gains, and over 6,000 hours saved per year, turning cost-benefit analysis from a one-time exercise into a continuous competitive advantage.
Make your next big decision with confidence
A well-built cost benefit analysis template takes the guesswork out of your most consequential business decisions. This guide covered everything you need: template structure, a six-step process, proven formulas, common pitfalls to avoid, and five free templates to get started immediately.
Ready to turn your cost-benefit analysis into a live, collaborative process? monday.com’s AI Work Platform gives your team the dashboards, automations, and AI-powered insights to keep every CBA current, connected, and actionable.
Frequently asked questions
What should a cost-benefit analysis template include?
A CBA template should include a project description, a full list of costs (direct, indirect, and intangible), a full list of expected benefits, a defined timeframe, a discount rate for present value calculations, a cost-benefit ratio calculation field, and a final recommendation section.
What is the cost-benefit ratio formula?
The cost-benefit ratio (BCR) is calculated by dividing total expected benefits by total expected costs. A BCR greater than 1 means the investment is financially justified; a BCR below 1 means costs outweigh benefits.
What is the difference between a CBA and an ROI calculation?
A cost-benefit analysis evaluates all costs and benefits, including intangible ones, across a defined timeframe, while ROI is a single percentage expressing return relative to investment. CBA is broader and more suitable for complex decisions involving multiple stakeholders.
How do you account for intangible benefits in a cost-benefit analysis?
You assign a proxy monetary value to intangible benefits by linking them to measurable outcomes. For example, estimating employee satisfaction gains in terms of reduced turnover cost, or customer loyalty improvements in terms of repeat revenue.
Is there a free cost-benefit analysis template in Excel?
Yes, monday.com's AI Work Platform offers free CBA templates including an Excel-compatible format that you can download and start using immediately, or build directly on the platform for real-time collaboration and automated calculations.
What are the limitations of cost-benefit analysis?
CBA is most reliable when costs and benefits can be quantified; it becomes less precise when intangible factors dominate. It also depends on the accuracy of estimates. Overly optimistic projections or underestimated hidden costs can skew results significantly.