
Every organization runs on processes, whether someone’s written them down or not. Orders get fulfilled, campaigns get launched, and somehow new hires find their way through onboarding. But ask three people how any of those workflows actually operate, and you’ll likely get three different answers.
That gap between what teams think happens and what actually happens is where business process modeling comes in. With AI adoption accelerating, distributed teams working across time zones, and operations scaling faster than documentation can keep up, business process modeling has shifted from a nice-to-have discipline to an operational necessity.
This guide covers what business process modeling is, the techniques that drive it, the challenges it solves, and how to put your process models into action. By the end, you’ll have a practical framework for turning invisible workflows into visible, improvable systems on a platform built to support them.
Key takeaways
- Business process modeling makes invisible work visible: It creates shared visual representations of how work actually flows, giving teams the foundation to identify bottlenecks, reduce waste, and standardize operations
- Five proven techniques cover every scenario: BPMN, flowcharts, UML diagrams, Gantt charts, and PERT diagrams. Each serves different modeling needs, from simple workflow visualization to complex notation standards
- Modeling before automating prevents costly rework: Organizations that map and analyze processes before investing in automation see significantly higher success rates and faster ROI
- Every team benefits, not just IT or operations: Marketing, finance, HR, customer service, and PMO teams all use process modeling to improve handoffs, compliance, and cross-functional alignment
- monday AI Work Platform operationalizes your process models: With automations, dashboards, AI agents, and 15+ board views, you can move from modeling to execution and continuous optimization in one place
What is business process modeling?
A business process is the logical sequence of events that leads to a particular outcome relevant to your organization. A process includes all the activities or tasks in a chain of events that accomplish something. Some common business processes include issuing purchase orders, assembling products, shipping products, invoicing clients, and estimating project costs.
Business process modeling is the practice of creating visual representations of each process in your organization to understand the components needed to achieve a goal and identify potential improvements for each. What do you mean by business process modeling? At its core, it answers one question: how does work actually flow from start to finish?
It’s a business process analysis and continuous improvement discipline that helps you maximize any process through critical examination. For example, a typical business process model might look something like this:

The discipline has evolved rapidly. Forty-three percent of organizations now actively use AI in business process management, according to the BOC Group BPM Study. Process mining, no-code platforms, and AI-driven orchestration are reshaping how teams approach modeling, making it faster and more evidence-based, with direct connection to execution.
The business process modeling process
Business process modeling typically follows five core steps, though some frameworks expand this to seven depending on the level of detail required. What are the seven steps of the business process? The answer depends on the framework, but five stages are standard across most approaches:
- Identify the process: Select the workflow you want to model and define its boundaries, including the starting trigger and the desired outcome
- Gather information: Interview process owners, observe how work actually flows, and collect data on timing, handoffs, and decision points
- Create the model: Use a modeling technique (BPMN, flowcharts, or others) to visualize the process from end to end
- Analyze and optimize: Review the model for bottlenecks, redundancies, and unnecessary steps. Identify where automation or restructuring could improve performance
- Implement and monitor: Put the optimized process into action and track its performance against the model over time
Business process modeling vs. business process management
These two terms are closely related but distinct. Business process modeling focuses specifically on the visualization and analysis of workflows. Business process management (BPM) is the broader organizational discipline that includes modeling as one component alongside execution, monitoring, and continuous optimization.
Business process modeling vs. process mapping vs. process mining
What is the difference between process modeling, process mapping, and process mining? Each serves a different purpose in understanding how work flows. Process mapping captures the basic sequence of steps. Process modeling goes deeper by adding data on resources, decision points, exceptions, and performance metrics. Process mining uses AI and event log analysis to discover how processes actually execute in practice.
What is business process modeling software?
Business process modeling software provides the digital environment for designing, visualizing, and analyzing workflows. These platforms range from dedicated diagramming applications to comprehensive work management systems that combine modeling with execution, automation, and real-time monitoring.
The most effective business process modeling software doesn’t stop at documentation. It connects your process models directly to how work gets done every day, turning static diagrams into living operational systems that teams can continuously execute, track, and improve.
Does your business use business process modeling?
If your team relies on verbal explanations, scattered spreadsheets, or tribal knowledge to describe how work flows, you’re already doing process modeling informally. The question is whether you’re doing it deliberately enough to capture improvements.
Signs that your organization would benefit from formal business process modeling include frequent handoff failures between teams, difficulty onboarding new employees to existing workflows, compliance documentation that requires manual reconstruction for every audit, and scaling pain points where processes that worked at a smaller scale are breaking under increased volume.
Organizations rarely struggle because their people aren’t working hard enough. The real issue is usually that work moves through invisible, undocumented paths that no one fully understands. What happens when your processes exist only in people’s heads?
Lack of process visibility
Teams cannot improve what they cannot see. When processes are undocumented, bottlenecks hide in plain sight, redundant steps go unnoticed, and handoff failures become the norm rather than the exception. A procurement team, for example, might not realize that purchase orders sit in an approval queue for four days simply because no one has mapped the approval chain end-to-end.
Modeling brings these invisible friction points to the surface. Instead of reacting to symptoms after delays have already occurred, teams can identify the root cause and address it systematically.
Cross-team communication gaps
Different departments often describe the same process in completely different ways. Marketing calls it a “campaign launch.” Operations calls it a “resource allocation workflow.” Finance calls it a “budget commitment.” Without a common reference point, these teams end up solving different versions of the same problem.
Business process modeling creates a shared visual language that everyone can reference. When stakeholders from different functions review the same process diagram, they develop a shared understanding of handoffs, dependencies, and responsibilities. This reduces miscommunication and improves cross-functional collaboration across the entire organization.
Scaling manual workflows
What works at 10 people breaks at 100. Manual processes that rely on email threads and undocumented institutional knowledge become unsustainable as organizations grow. Modeling identifies which steps can be automated before scaling, preventing costly rework. The global business process automation market is projected to grow from $15.3 billion in 2025 to $33.4 billion by 2032, reflecting the urgency organizations feel to formalize and automate their workflows.
Compliance and risk exposure
Undocumented processes create compliance blind spots. When no one can point to a diagram showing who is responsible for what, audit preparation becomes a scramble. Regulators expect documented controls, and the absence of a formal process model can turn a routine audit into a costly remediation project.
Modeling documents who is responsible for each step and what happens when exceptions arise. For industries like healthcare, finance, and manufacturing, this traceability is not optional. It’s the foundation of regulatory confidence and risk management.
Benefits of business process modeling
Improves collaboration across teams
A process model gives everyone a shared view of how work flows between departments. Instead of each team operating with its own assumptions about what happens before and after its contribution, modeling creates cross-functional alignment.
When an operations manager can see exactly where their team’s output feeds into the sales team’s workflow, handoffs become deliberate rather than accidental. Teams see their role in the larger picture, understand dependencies, and coordinate without relying on guesswork or status meetings.
Reduces bottlenecks and delays
Modeling reveals where work slows down, where queues build up, and where handoffs fail. With a visual model in front of you, it’s far easier to spot a three-day approval loop or a redundant data-entry step that’s costing your team hours every week. Organizations that model their processes before automating them see significantly higher success rates because they fix the workflow before layering technology on top.
Delivers measurable results for stakeholders
Stakeholders need more than “we’re working on it.” Process models provide concrete evidence of how time and resources are allocated, enabling data-driven decisions about priorities and investments.
When you can show leadership exactly how a process improvement reduced cycle time or eliminated unnecessary steps, you build credibility and secure buy-in for further optimization. The model becomes the shared artifact that connects day-to-day execution with strategic decision-making.
Supports continuous improvement
Business process modeling is not a one-time exercise. Models become living documents that evolve as the organization changes. A process that made sense six months ago may need to be restructured after a new product launch, a team expansion, or a shift in customer expectations.
With the convergence of process modeling and process mining, AI can now monitor actual process execution against the designed model, flagging deviations and surfacing optimization opportunities in real time. This turns modeling from a periodic project into an ongoing operational discipline.
Which teams benefit from business process modeling?
Business process modeling is not limited to IT departments or operations teams. Any function with repeatable workflows benefits from documenting and analyzing how work gets done. Which processes on your team could benefit from a visual model?
- Operations: Map end-to-end supply chain and fulfillment workflows to identify delays, reduce waste, and improve resource allocation across teams
- IT: Document incident response, change management, and service request processes to reduce resolution times and standardize procedures
- HR: Model onboarding, performance review, and offboarding workflows to deliver a consistent employee experience regardless of which manager or location is involved
- Finance: Visualize invoice approval, expense reimbursement, and budgeting cycles to tighten controls and accelerate close processes
- Marketing: Diagram campaign launch, content production, and creative approval processes to reduce turnaround time and eliminate missed handoffs
- PMO: Standardize project intake, prioritization, and reporting workflows to maintain consistency across portfolios and support strategic goal management
- Customer service: Map ticket routing, escalation, and resolution processes to improve response times and identify training gaps
- Legal and compliance: Document contract review, approval, and regulatory filing processes to maintain audit readiness and reduce risk exposure
Five business process modeling techniques you should know
Now that you understand the value of business process modeling, how do you represent your processes visually? Here are five proven techniques, each suited to different scenarios and levels of complexity.
1. Business process modeling notation (BPMN)
BPMN stands for Business Process Model and Notation, and it’s the most widely adopted standard for visually representing processes. BPMN 2.0, the current standard maintained by the Object Management Group, provides over 100 proprietary objects for precise process documentation.
Some of these objects include:
- Process flow objects: Represent the sequence flow and execution of activities
- Pools: Represent process participants
- Swimlanes: Define sub-groups and divisions within pools
- Data objects: Represent information flowing through the process
- Gateways: Define decision points and branching logic
BPMN provides a unified “language” for modeling, ensuring that technical and non-technical stakeholders can read the same diagram and reach the same understanding. Modern BPM platforms increasingly use BPMN models as the foundation for direct process automation, connecting the diagram to the execution engine.
The example we shared earlier is a fairly simple BPMN model. Here’s an example of a more complex one:

2. Flowcharts
Flowcharts are one of the simplest and most widely used techniques for process modeling. As the name suggests, flowcharts help you map out the sequence flow of activities you need to perform to complete a specific process.
In a flowchart, you represent each step in the process with a shape, then connect those shapes with lines or arrows to indicate the logical progression. Different shapes indicate different types of steps:
- Rounded rectangles or ovals: Represent start and end points
- Rectangles: Represent process steps or actions
- Diamonds: Represent decision points
Here’s a simple process model example:

Flowcharts are powerful because they communicate a business process in a way everyone can understand, regardless of technical background. In practice, you can use many different shapes to represent different components, especially when dealing with a complex process. For teams new to process modeling, flowcharts are often the fastest way to capture and share a workflow.
3. UML diagrams
UML (Unified Modeling Language) is a modeling language that helps you describe the elements of a specific software system and how they interact. It’s especially useful when communicating software design to a non-technical audience.
UML includes different types of diagrams , broken into two main categories. Structural diagrams represent the elements and objects that make up a system, including class diagrams for data modeling and component diagrams for physical structure. Behavioral diagrams focus on how objects interact, including:
- Use case diagrams: Describe possible interactions between user and system
- Activity diagrams: Graphical representation of a user’s activities within a system
- State machine diagrams: Represent the behavior of an object within a system
4. Gantt charts
Gantt charts are used to plan a project’s schedule by showing tasks and their dependencies on a horizontal bar chart. They’re particularly useful for scheduling and dependency mapping in process improvement projects, helping teams see how changes at one step affect downstream timelines.
Many work management platforms include a built-in Gantt View that lets you update process timelines directly in the chart. You can also add a Gantt widget to your project dashboard for at-a-glance schedule tracking alongside other process metrics.

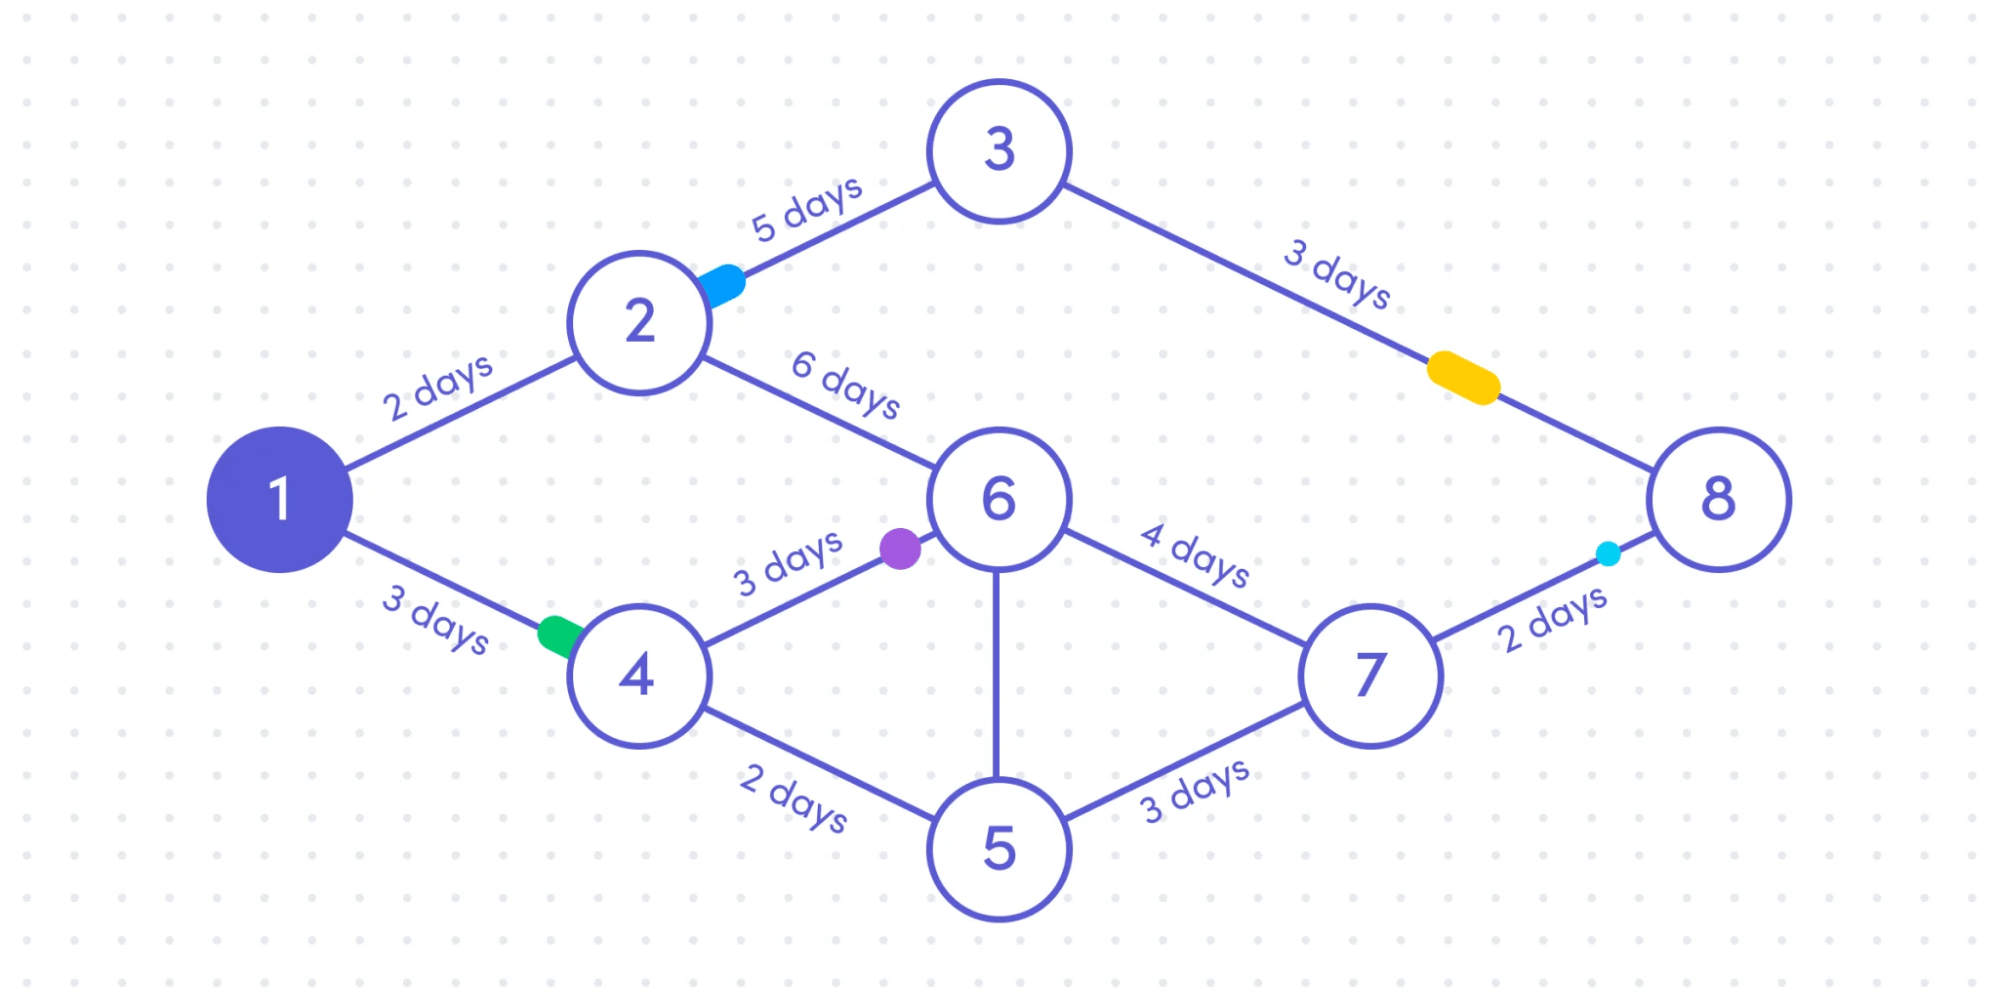
5. PERT diagrams
Similar to Gantt charts, PERT (Program Evaluation and Review Technique) is a framework for mapping task dependencies and estimating a project’s duration.
This type of flowchart is useful in the early stages of planning, when sorting out how all the pieces fit together.
How to implement business process modeling with monday AI Work Platform
Modeling your processes is the foundation, and the value multiplies when those models connect directly to how work gets done. Putting models into action requires a platform that connects visualization with execution in one place. How can you create an effective business process model and operationalize it?
Here’s a four-step approach using monday AI Work Platform to move from documentation to measurable results:
- Map your current processes: Use boards and views to capture each step, owner, and dependency in your workflow. Start with ready-to-use templates like the Advanced Project Management Template to structure your processes quickly, then customize as needed
- Identify bottlenecks with dashboards: Real-time reporting surfaces delays and resource conflicts before they escalate. Dashboards pull data from across your boards to show where work is stacking up, which owners are overloaded, and where cycle times are drifting
- Automate repetitive steps: No-code automation recipes replace manual handoffs, notifications, and status updates. Instead of requiring someone to remember to send an email when a step is complete, the platform handles it automatically
- Monitor and optimize continuously: Dashboards and AI-powered insights flag risks before they escalate. Track performance against your process model over time and adjust as your organization evolves

By centralizing workflows on a single platform, you eliminate the gap between designing a process and executing it. Teams work directly inside the model, keeping documentation and execution in one place.
Business process modeling features that drive results on monday AI Work Platform
What should you look for in a platform that supports end-to-end business process modeling? Here are the capabilities that matter most when moving from modeling to execution.
- 15+ board views: Visualize any process as a Kanban board, Gantt chart, calendar, or workload map. Choose the view that matches how your team thinks about the work
- Automations: Replace manual handoffs with no-code automation recipes that trigger actions, send notifications, and update statuses automatically
- Dashboards: Track process performance with real-time charts, goal tracking, and AI-generated summaries that surface risks before they escalate
- monday agents: Delegate process monitoring to AI agents that flag risks and handle domain-specific workflows autonomously
- monday sidekick: Ask questions about your process data in plain language and get instant answers, summaries, and recommendations without building a report first
- Integrations: Connect external platforms like Slack, Teams, Gmail, Jira, and Salesforce to keep process data flowing across your entire technology stack

The platform is designed for teams that need operational results without a steep learning curve or lengthy implementation cycles. Trusted by over 250,000 customers worldwide, including over 60% of the Fortune 500, it delivers the adoption rates that make process modeling data reliable from day one.
How business process modeling shapes the future of work
Business process modeling has evolved far beyond static diagrams pinned to office walls. With 43% of organizations already using AI in BPM and the process automation market projected to reach $33.4 billion by 2032, modeling has become the operational foundation for how organizations adapt and compete in an increasingly complex environment.
AI agents now monitor process execution in realtime, flagging deviations before they become problems. Process mining turns event logs into evidence-based insights that validate or challenge your assumptions. Meanwhile, low-code platforms have put process design in the hands of business users rather than limiting it to IT teams.
monday AI Work Platform bridges that gap. From modeling your first workflow to orchestrating cross-departmental operations with AI agents, the platform provides the visibility and automation to turn process knowledge into measurable outcomes.
FAQs
What is business process modeling?
Business process modeling is the practice of creating visual representations of an organization's workflows to analyze, improve, and optimize how work gets done. It helps teams identify bottlenecks, standardize operations, and align activities with strategic goals.
What are the five stages of BPM?
The five stages of BPM (business process management) are design, model, execute, monitor, and optimize. Business process modeling primarily focuses on the design and modeling stages, creating the visual foundation for the full lifecycle.
What is the difference between business process modeling and business process mapping?
The difference between business process modeling and business process mapping is depth. Process mapping captures the basic flow of steps in a workflow, while modeling adds data about resources, decision points, exceptions, and performance metrics to enable analysis and optimization.
Is business process modeling outdated?
Business process modeling remains highly relevant today. With 43% of organizations now using AI in BPM and the process automation market projected to reach $33.4 billion by 2032, modeling has become more relevant as the foundation for AI-driven process orchestration and continuous improvement.
How does AI improve business process modeling?
AI improves business process modeling by automating process discovery through event log analysis, identifying optimization opportunities through pattern recognition, and enabling real-time monitoring with autonomous agents that flag deviations from the designed model.
What should I look for in business process modeling software?
Look for business process modeling software that offers visual process design, no-code automation, real-time dashboards, team collaboration features, and integrations with your existing technology stack. The platform should scale from simple flowcharts to complex cross-department workflows.