
Marketing teams juggle dozens of campaigns simultaneously, each with its own timeline, dependencies, and stakeholders. When creative reviews delay product launches, when legal approvals bottleneck campaign rollouts, or when team capacity conflicts threaten major deadlines, the difference between success and missed opportunities often comes down to visibility. The best Gantt chart software transforms this complexity into manageable, visual workflows that connect strategy to execution.
Enterprise marketing requires more than basic project management. Teams need platforms that handle cross-functional dependencies, provide real-time workload visibility, and scale across multiple campaigns without losing sight of strategic priorities. The right solution connects timeline management to resource planning, budget tracking, and performance metrics — giving leaders the control they need to coordinate work across departments and deliver results consistently.
This article delves into what makes Gantt chart software effective for marketing teams, from core visualization capabilities to AI-powered insights that predict bottlenecks before they impact delivery. It also examines key features that drive execution, compares leading platforms, and demonstrates how to implement a solution that grows with organizational needs.
Key takeaways
Before diving into the details, here’s what you need to know about choosing and implementing Gantt chart software that transforms how marketing teams plan, execute, and deliver campaigns:
- Transform campaign chaos into a visual, unified timeline: use Gantt charts to see all marketing campaigns, deadlines, and dependencies in one timeline so teams stay aligned and deliver on schedule.
- Proactively balance workloads to maintain team well-being: track team capacity in real-time to prevent overallocation and make smart decisions about priorities, resources, and when to bring in extra support.
- Connect daily work to strategic goals: link campaign timelines to company OKRs and portfolio dashboards so leadership sees marketing’s impact on business results, not just task completion.
- Let AI predict problems before they derail campaigns: advanced platforms like monday work management use AI to flag at-risk projects, suggest resource changes, and automate planning so teams focus on execution instead of firefighting.
- Scale coordination without adding complexity: enterprise features like standardized templates and cross-project dependencies maintain visibility across hundreds of campaigns while teams grow and priorities shift.
Understanding Gantt chart software for enterprise marketing teams
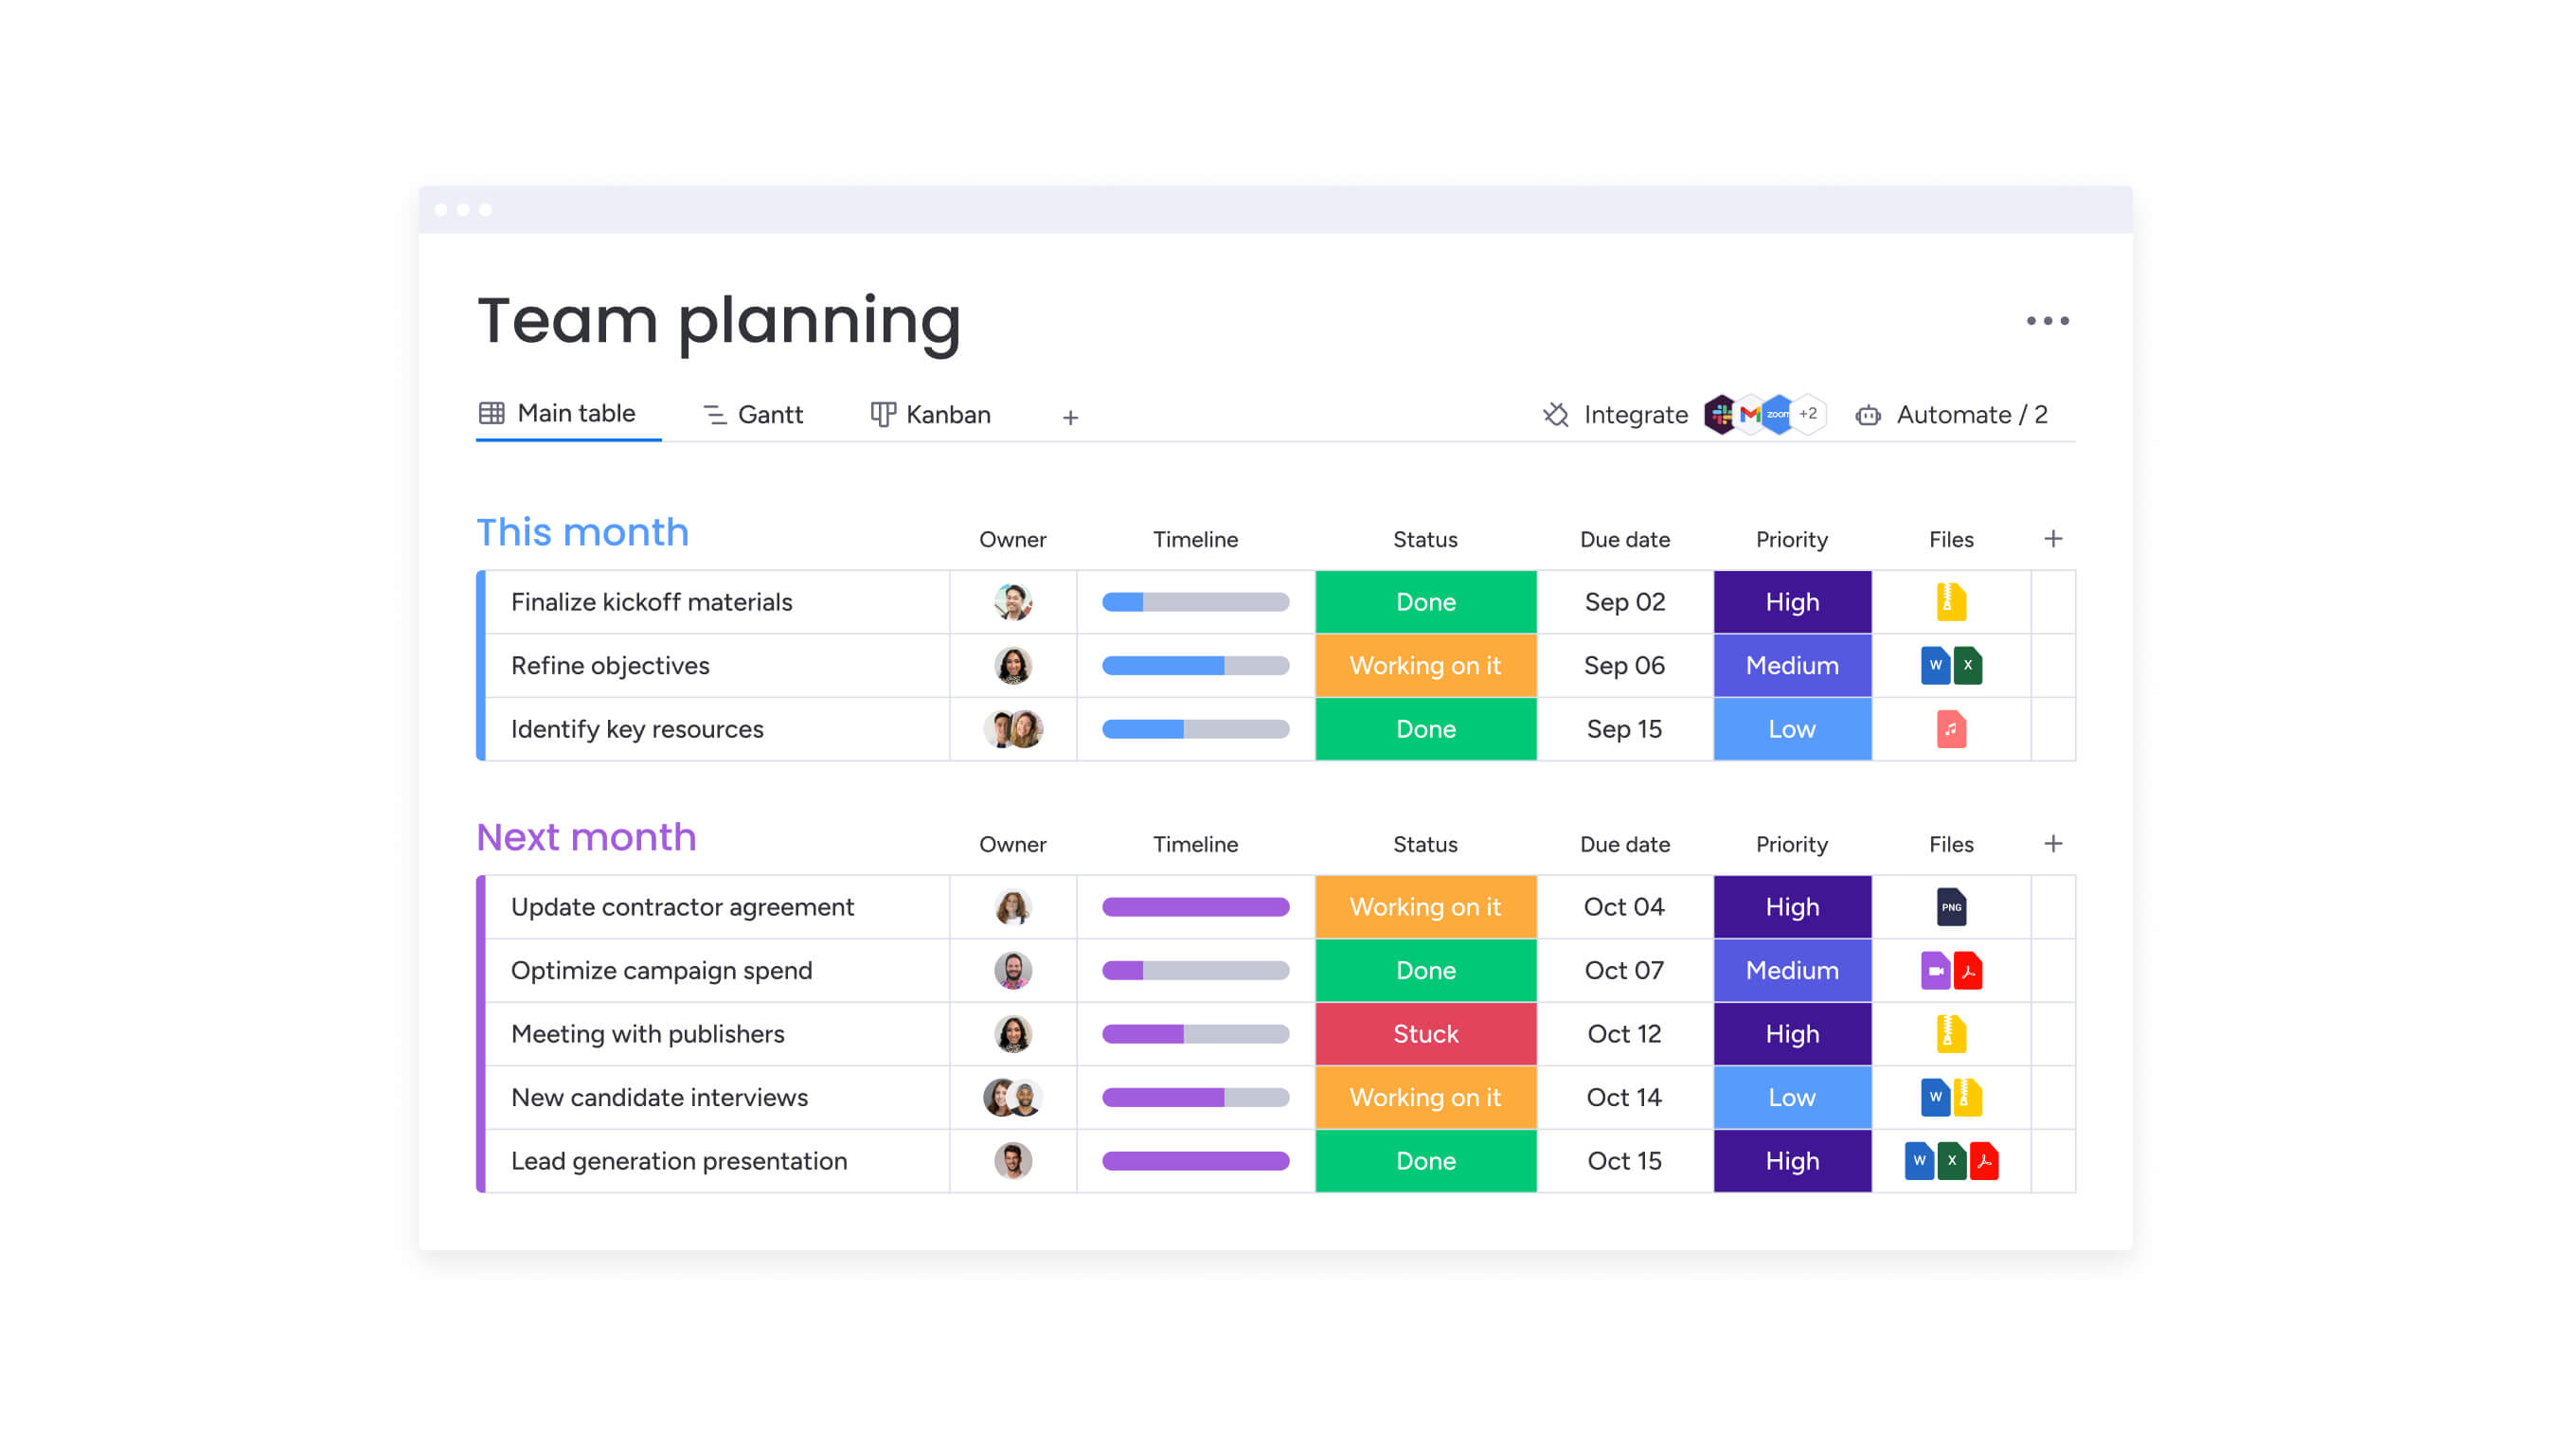
Gantt chart software cuts through campaign complexity by visualizing your entire timeline, from project milestones to dependencies and deadlines, in one unified view. For heads of marketing managing 50-100+ team members across content, creative, acquisition, and events, these platforms provide the visibility needed to coordinate cross-functional work and deliver campaigns on schedule.
The right Gantt chart solution goes beyond basic timeline visualization. It connects campaign schedules to team capacity, budget tracking, and performance metrics, solving the core challenge of managing multiple concurrent campaigns without visibility into progress, resource utilization, or strategic alignment.
Marketing leaders need platforms that show who’s working on what, where campaigns stand against deadlines, and how initiatives connect to company OKRs. This visibility directly impacts your ability to drive growth, report to executives, and ensure effective use of budget and resources.
What makes enterprise Gantt chart software different
Enterprise Gantt chart platforms address specific challenges that basic project tools cannot handle. When you’re coordinating 24+ concurrent campaigns across regions and channels, you need more than task lists and calendars. These advanced platforms give you the backbone you need to handle complexity without losing sight of what matters across your initiatives.
Key differentiators include:
- Portfolio-level visibility: see all campaigns and initiatives in one view, with the ability to drill down into specific projects.
- Resource management integration: connect timelines directly to team capacity and workload distribution.
- Cross-functional dependencies: map connections between creative, legal, product, and marketing teams.
- Automated workflows: reduce manual updates through status changes, notifications, and handoffs.
- Real-time collaboration: enable teams across time zones to work from the same source of truth.
Why does this matter? When teams work in silos with different platforms and ambiguous ownership, it becomes difficult to hit deadlines and demonstrate how marketing drives business results.
Core features that drive marketing execution
The most effective Gantt chart platforms excel at three key capabilities that transform marketing coordination. These features work together to provide visibility, control, and efficiency across complex campaign portfolios.
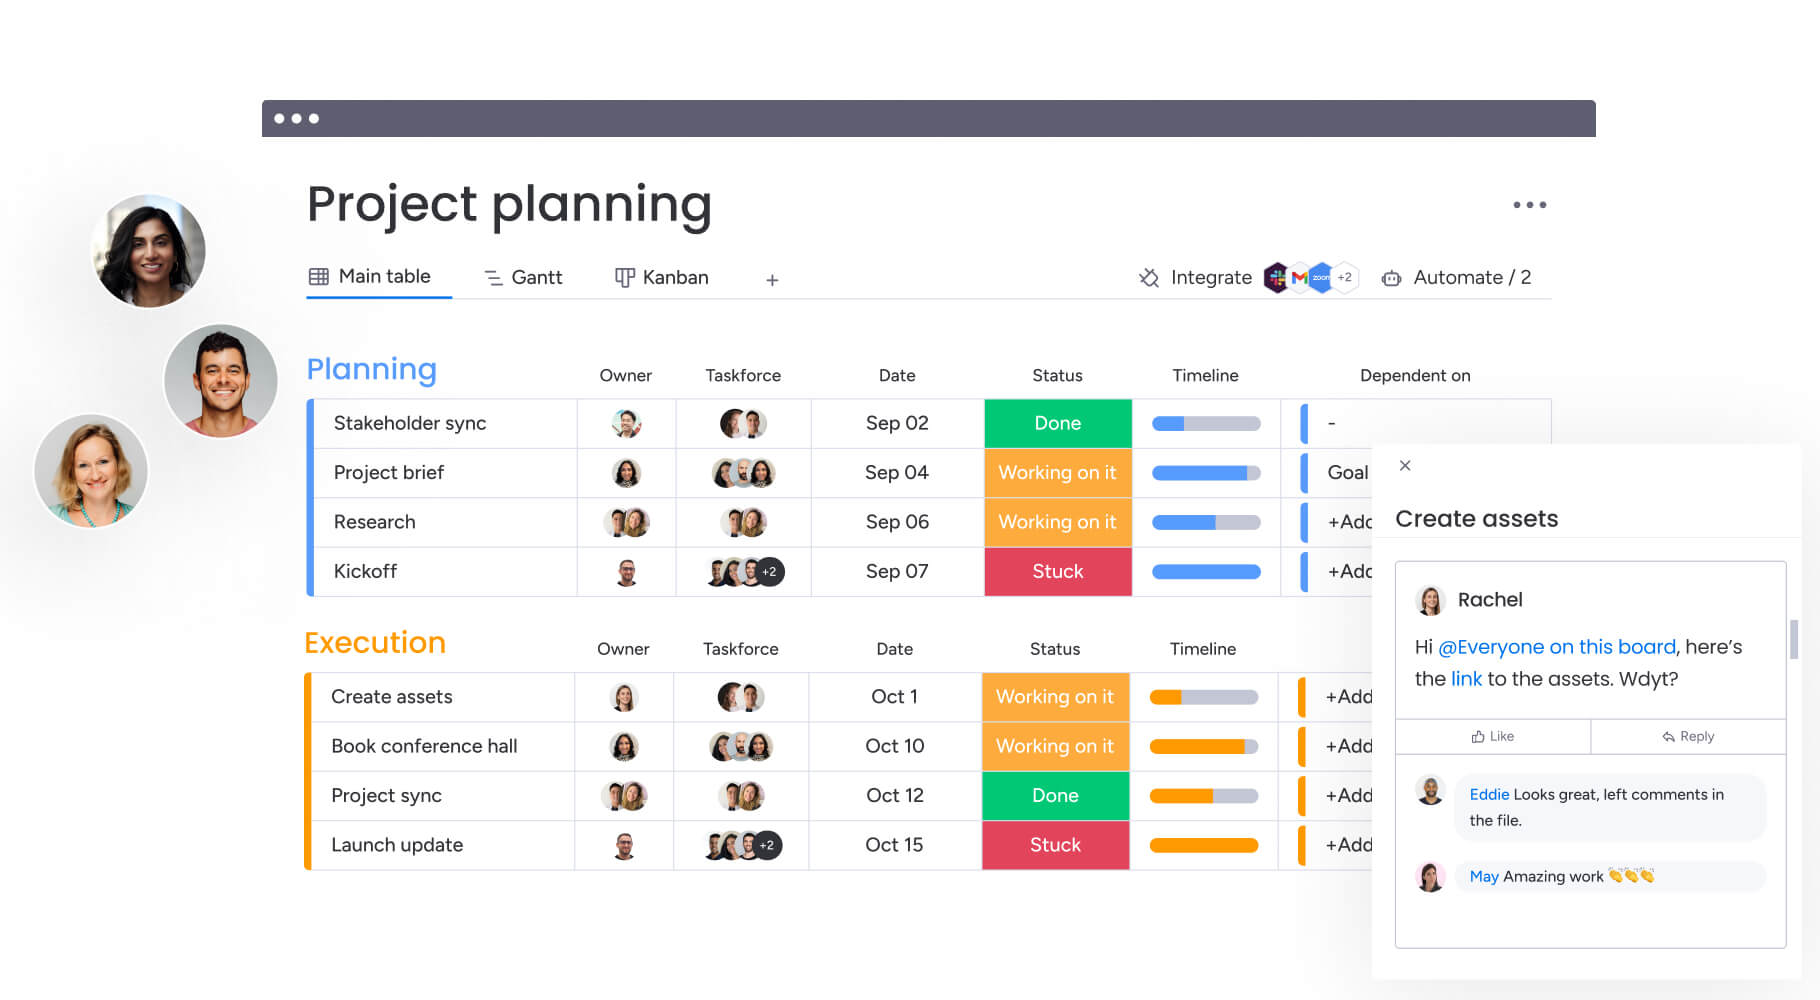
Visual timeline management with dependencies
Need to shift deadlines? Just drag and drop project items on your interactive Gantt chart, link dependencies, and spot the critical path that drives your timeline. Marketing teams can customize views by channel, region, or team, with color-coding that shows which initiatives are on track, at risk, or delayed.
Dependencies ensure work flows in the correct order. When content delivery dates shift, the system automatically updates creative review timelines, legal approval schedules, and launch dates. You can set finish-to-start, start-to-start, finish-to-finish, or start-to-finish dependencies based on your workflow needs.
This eliminates the manual work of recalculating schedules and notifying stakeholders when changes occur.
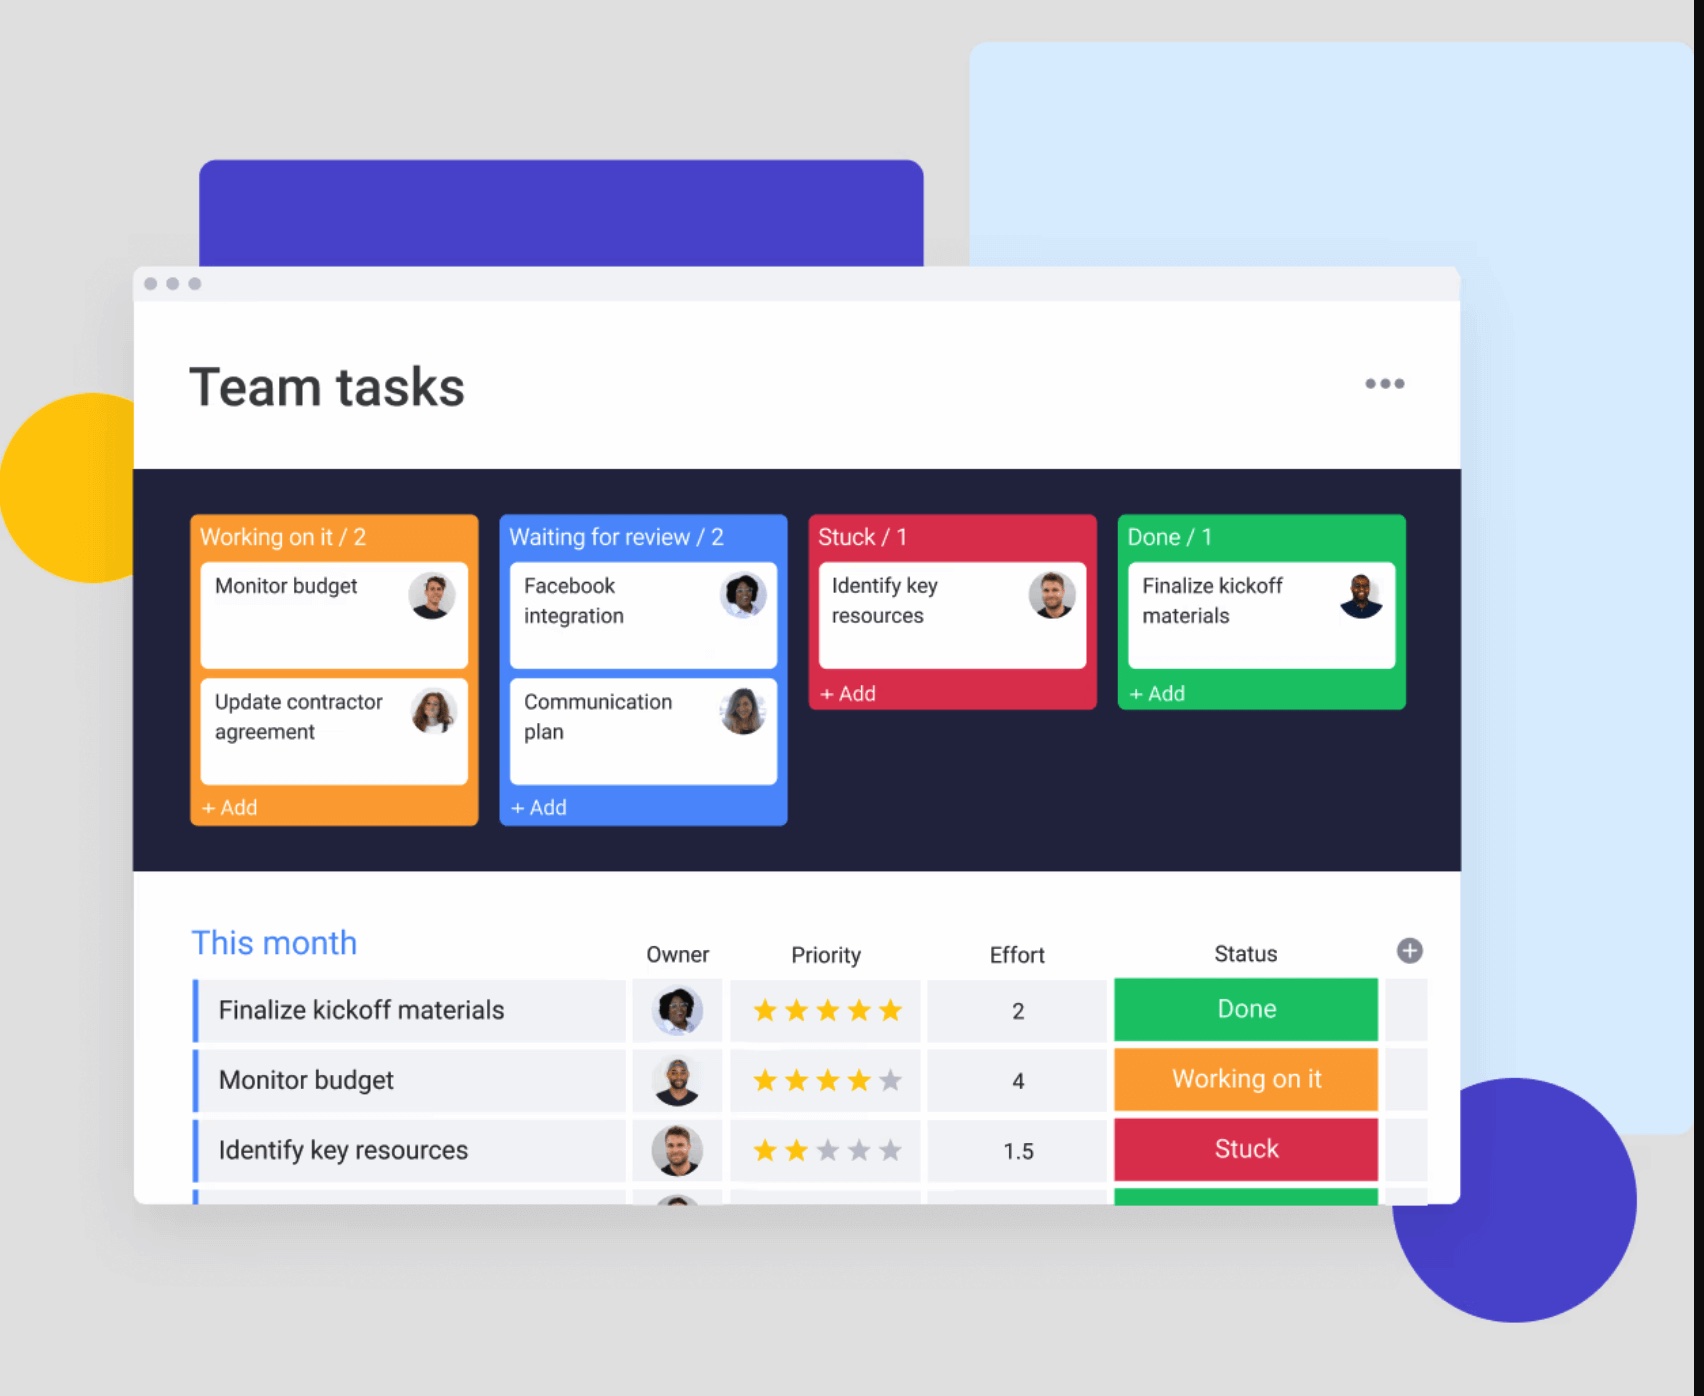
Workload and capacity planning
See exactly how busy your team members are with real-time workload views that compare assigned hours against actual capacity. The visual interface displays workload by day, week, or month, with color-coding that flags overallocation, optimal capacity, or availability.
Benefits of workload management:
- Proactive resource planning: identify conflicts before they cause delays.
- Data-driven prioritization: make informed decisions about campaign priorities.
- Team well-being: prevent burnout by maintaining balanced workloads.
- Strategic hiring: understand when to bring in agency support or additional headcount.
You can drag tasks between team members to rebalance workloads and filter by skills or department to find the right person for each assignment.
Portfolio dashboards and reporting
Custom dashboards aggregate data from multiple boards to show portfolio-level metrics. You can track campaign status, budget utilization, team workload, and progress toward OKRs with real-time updates that eliminate manual report compilation.
Dashboard capabilities include:
- Executive-ready views: show metrics that matter to leadership.
- Customizable widgets: display the exact data you need.
- Automated reporting: schedule regular updates to stakeholders.
- Drill-down functionality: move from high-level insights to project details.
This centralized visibility enables proactive intervention when campaigns are at risk, rather than reactive problem-solving after issues arise.
How AI enhances Gantt chart capabilities
AI brings your static timelines to life, turning them into intelligent planning systems. Leading platforms embed AI directly into workflows to surface insights, automate processes, and predict issues before they impact delivery. This shift from reactive to proactive management fundamentally changes how teams approach campaign coordination.
AI-powered capabilities include:
- Risk identification: analyze timeline patterns and resource constraints to flag at-risk projects.
- Automated plan generation: create project timelines from brief descriptions.
- Smart resource allocation: recommend team assignments based on capacity, skills, and workload.
- Predictive analytics: surface potential delays before they become critical.
These tools shift teams from reactive firefighting to proactive management. Instead of discovering issues during status meetings, AI surfaces them in real time with suggested mitigation strategies.
For example, some platforms use AI to categorize project requests, summarize complex briefs, and extract key information from documents. Digital assistants can monitor department workloads continuously, flagging bottlenecks and suggesting reassignments based on real-time capacity. Digital Workers monitor department workloads continuously, flagging bottlenecks and suggesting task reassignments based on real-time capacity.
Comparing leading Gantt chart platforms
When evaluating top Gantt chart software, consider how each platform addresses your specific needs around visualization, collaboration, automation, and scalability. The right choice depends on your team size, complexity requirements, and integration ecosystem.
| Feature | monday work management | Asana | Microsoft Project |
|---|---|---|---|
| Gantt visualization | Interactive drag-and-drop with unlimited baselines | Timeline view with limited dependencies | Advanced Gantt with critical path |
| Workload management | Real-time capacity view with color-coded allocation | Basic workload view (Premium only) | Resource leveling and capacity planning |
| Marketing features | Campaign templates, portfolio dashboards, OKR tracking | Marketing project templates | Limited marketing functionality |
| Automation | No-code builder with unlimited recipes | Rules and workflow automation (Premium) | Advanced automation requiring setup |
| Integration ecosystem | 200+ native integrations | 200+ integrations via API | Microsoft ecosystem focused |
| Price per user/month | $9-32 | $10.99-24.99 | $10-55 |
| Implementation time | Two to four weeks average | Two to three weeks basic setup | Four to eight weeks enterprise |
The comparison reveals different strengths: monday work management combines visualization with workload management and portfolio features, Asana offers simplicity with task management, while Microsoft Project provides advanced scheduling for complex dependencies.
Implementation strategies for marketing teams
Successful Gantt chart implementation requires a clear roadmap that progresses from basic campaign mapping to complete portfolio visibility. These four steps ensure your team adopts the platform effectively while maintaining operational continuity throughout the transition.
Step 1: start with campaign structure mapping
Begin by identifying all major campaigns planned for the quarter. Break each into phases: strategy, creative development, production, launch, and optimization. Define key milestones like creative brief approval, asset delivery, and launch dates.
Create a master campaign board listing all initiatives with target dates, owners, and strategic objectives. This foundation provides complete visibility before detailed planning begins.
Step 2: build timelines with clear dependencies
For each campaign, create detailed task lists representing required work in each phase. Add start dates, due dates, and assign owners to every task. Link tasks in sequence using dependencies; creative development cannot start until brief approval, and legal review requires finalized assets.
Switch to Gantt view to visualize the timeline and identify conflicts. Adjust durations and dependencies until you have a feasible plan accounting for team capacity and external constraints.
Step 3: configure workload views
Set each team member’s capacity based on available hours per week. Review workload distribution to identify overallocated individuals or periods where multiple campaigns create conflicts.
Rebalance by adjusting assignments, extending timelines where possible, or identifying where external support is needed. Configure automated notifications to alert when team members exceed capacity thresholds.
Step 4: establish reporting dashboards
Create dashboards that aggregate campaign data across your organization. Include widgets showing:
- Campaign status distribution: on track, at risk, delayed.
- Budget utilization: by campaign or channel.
- Team workload: by department.
- OKR progress: quarterly goal achievement.
Configure dashboards to display metrics important to executive stakeholders. Set up automated sharing so leadership receives updates without manual compilation.
Enterprise capabilities that scale with growth
As marketing organizations grow, they need capabilities that maintain visibility and control across increasing complexity. Enterprise features address challenges around standardization, alignment, and resource optimization that emerge at scale. These advanced capabilities ensure your platform grows with your organization’s needs.
Leadership visibility at portfolio level
AI-powered risk insights scan project updates continuously, surfacing issues with urgency levels and mitigation options. Portfolio dashboards provide real-time analysis across hundreds of projects, scaling to support enterprise-wide initiatives.
These capabilities give leaders instant visibility into progress and risks throughout the portfolio, enabling proactive decisions rather than reactive responses to problems.
Standardization and alignment
Managed templates standardize entire workspaces including projects, automations, and workflows, with the ability to apply changes across hundreds of instances simultaneously. This ensures consistent processes while maintaining flexibility for team-specific needs.
Cross-project dependencies connect related initiatives, showing how delays in one area impact others. This visibility helps teams understand the broader impact of their work and coordinate more effectively.
Resource optimization across departments
A centralized resource directory captures team member attributes like skills, roles, and location. The capacity manager provides live views of resource availability across projects and portfolios, supporting better intake and prioritization decisions.
These tools help optimize talent allocation across the organization, ensuring the right people work on the right priorities without overloading key contributors.
Measuring success with Gantt chart software
Measure what matters. The right metrics will show you exactly how your Gantt charts are moving the needle and where you can make them even better. These key performance indicators demonstrate both operational efficiency gains and strategic business value.
Track these metrics to understand the impact of your Gantt chart implementation:
- On-time delivery rate: percentage of campaigns launched on schedule.
- Resource utilization: time spent on productive work versus capacity.
- Cycle time reduction: days saved through improved coordination.
- Budget variance: difference between planned and actual spend.
- Team satisfaction: feedback on workload balance and tool adoption.
Organizations using monday work management report significant improvements. Marketing teams achieve 40% more effective cross-team collaboration, a 25% reduction in email exchanges, and save thousands of hours monthly through automation and standardized workflows.
Transform marketing execution with intelligent Gantt charts
Gantt chart software has evolved from simple timeline tools to comprehensive platforms that connect strategy to execution. For marketing leaders managing complex, cross-departmental workflows, the right solution provides visibility, coordination, and control at scale.
The key is finding a platform that grows with your organization. As teams expand and campaigns multiply, you need capabilities that maintain alignment without adding friction. This means automated workflows, AI-powered insights, and the flexibility to adapt as priorities shift.
Visual timeline management, workload optimization, AI-driven risk detection, and portfolio dashboards come together in monday work management to provide the infrastructure marketing teams need to deliver consistent results. Enterprise features including managed templates, cross-project dependencies, and resource optimization, ensure you can scale execution while maintaining visibility and control.
The content in this article is provided for informational purposes only and, to the best of monday.com‘s knowledge, the information provided in this article is accurate and up-to-date at the time of publication. That said, monday.com encourages readers to verify all information directly.
Frequently asked questions
What is the best software for making Gantt charts?
The best Gantt chart software depends on your organization's size, complexity, and integration needs. For enterprise marketing teams managing multiple campaigns across departments, platforms that combine timeline visualization with workload management, portfolio dashboards, and automation deliver the most value. For cross-functional teams needing both flexibility and standardization at scale, monday work management excels.
What is the best project management software for marketing?
Marketing teams need project management software that handles campaign planning, content calendars, creative reviews, and cross-functional coordination. The best platforms offer visual timelines, approval workflows, asset management, and real-time collaboration features. Solutions should connect campaign execution to strategic marketing goals while supporting the unique workflows of creative, content, and acquisition teams.
Is Excel a good Gantt chart tool?
ChatGPT can provide text-based project planning suggestions and task sequences but cannot create functional, interactive Gantt charts. While it can help outline project phases and dependencies, you need purpose-built project management software for actual timeline visualization, resource allocation, and real-time collaboration. Platforms with embedded AI capabilities offer both planning assistance and executable project management.
What is a Gantt chart used for in marketing?
Marketing teams use Gantt charts to visualize campaign timelines, track deliverables, and coordinate cross-functional work. They provide a central view of all tasks and dependencies, helping teams manage campaign launches, content production schedules, and event planning. Gantt charts enable marketing leaders to communicate realistic timelines to stakeholders and identify potential bottlenecks before they impact delivery, and for more details, consult everything about Gantt charts.
How do Gantt charts improve campaign coordination?
Gantt charts improve campaign coordination by providing visual clarity on task sequences, dependencies, and resource allocation. Teams can see how creative development connects to production timelines, when approvals are needed, and which tasks impact launch dates. This visibility reduces miscommunication, prevents deadline conflicts, and ensures all stakeholders understand their role in campaign delivery.
What features should marketing teams prioritize in Gantt software?
Marketing teams should prioritize platforms offering dependency management, workload visualization, and integration capabilities. Look for software that provides customizable views by campaign or channel, automated status updates, and real-time collaboration features. The ability to connect Gantt timelines to broader portfolio dashboards and strategic objectives ensures campaigns align with business goals while maintaining operational efficiency.