

When sprint planning starts to feel more like guesswork than strategy, it’s a clear sign the team is operating without enough visibility. Without reliable measures of output, project forecasts rely on hope instead of data, leading to friction between engineering, product, and leadership. The solution is to replace uncertainty with predictability, and that begins with one key metric.
Agile velocity provides that clarity. It measures how much work a team completes in a sprint, turning subjective estimates into concrete data. By tracking velocity, teams can establish a sustainable pace, set expectations with stakeholders, and commit to delivery with greater confidence.
This guide explains how to make agile velocity work for your team. It covers how to calculate it accurately, how to apply it for realistic forecasting, and how to avoid the common pitfalls that can distort results. By the end, you’ll see how this single metric can improve team performance and transform goals into measurable outcomes.
Try monday dev for freeKey takeaways
- Velocity measures story points per sprint, not hours worked: use it to forecast timelines and set realistic commitments based on actual delivery rates.
- Track velocity across three to five sprints: single sprint data fluctuates too much to serve as a reliable basis for planning.
- Never compare velocity between teams or use it for individual reviews: differences in story point scales and contexts make such comparisons meaningless.
- Focus on sustainable pace rather than speed: twenty well-delivered story points are more valuable than thirty rushed ones that cause burnout and defects.
- monday dev automates velocity tracking and adds AI-powered insights: this removes manual effort while surfacing performance patterns and actionable recommendations.
What is velocity in Agile?
Agile velocity is the amount of work a development team completes in a sprint, measured in story points. In practice, it shows how many user stories are taken from start to finish within the sprint timeframe.
Story points are not tied to hours. They capture the relative complexity of work, factoring in effort, technical challenges, and uncertainty. By measuring progress through agile velocity instead of time estimates, teams can plan more realistically and deliver at a sustainable pace.
How Agile velocity works
Velocity acts like a speedometer for your team, showing how quickly completed features are being delivered to customers.
Only work that is fully finished counts toward agile velocity. A user story that is 90% complete still contributes zero points. Consistent agile testing reinforces this standard by ensuring quality is met before a story is considered done, keeping measurements accurate and encouraging teams to follow through to completion.
Why development teams track velocity
Teams track velocity to predict when projects will finish and plan realistic sprint commitments. For example, when you know your team’s development velocity is 20 story points per sprint, you can forecast delivery dates and set stakeholder expectations accurately.
Velocity also reveals team health, making it one of the key agile metrics that highlight productivity trends. Sudden drops might signal blockers or technical debt. Steady velocity shows a team working sustainably.
Sprint velocity vs team velocity
Velocity can be viewed at two different levels: the output of a single sprint or the average performance of a team over time. Both perspectives are useful, but they serve different purposes in planning and forecasting.
Sprint velocity:
- Single sprint focus: Measures one sprint’s completed points.
- Variable nature: Changes based on holidays, sick days, or sprint challenges.
- Immediate planning: Helps plan your very next sprint.
Team velocity:
- Historical average: Calculated across multiple sprints.
- Stability indicator: Shows your team’s typical delivery rate.
- Long-term forecasting: Predicts project completion dates.
How to calculate Agile velocity
Agile velocity is only useful if it’s measured consistently. That means starting with a shared definition of what “done” really means. Velocity counts completed work, not tasks that are nearly finished, so clarity here is critical. Once that agreement is in place, the calculation itself is simple.
The velocity formula:
Velocity = Total Story Points of Completed User Stories ÷ Number of Sprints
This formula provides the foundation, but applying it in practice requires a step-by-step approach to ensure accuracy and consistency.
Step 1: Complete your sprint
First, identify which user stories are truly done. “Done” means tested, approved, and ready to ship — not just code complete.
Review each story against your definition of done. If it’s missing any criteria, it doesn’t count toward velocity.
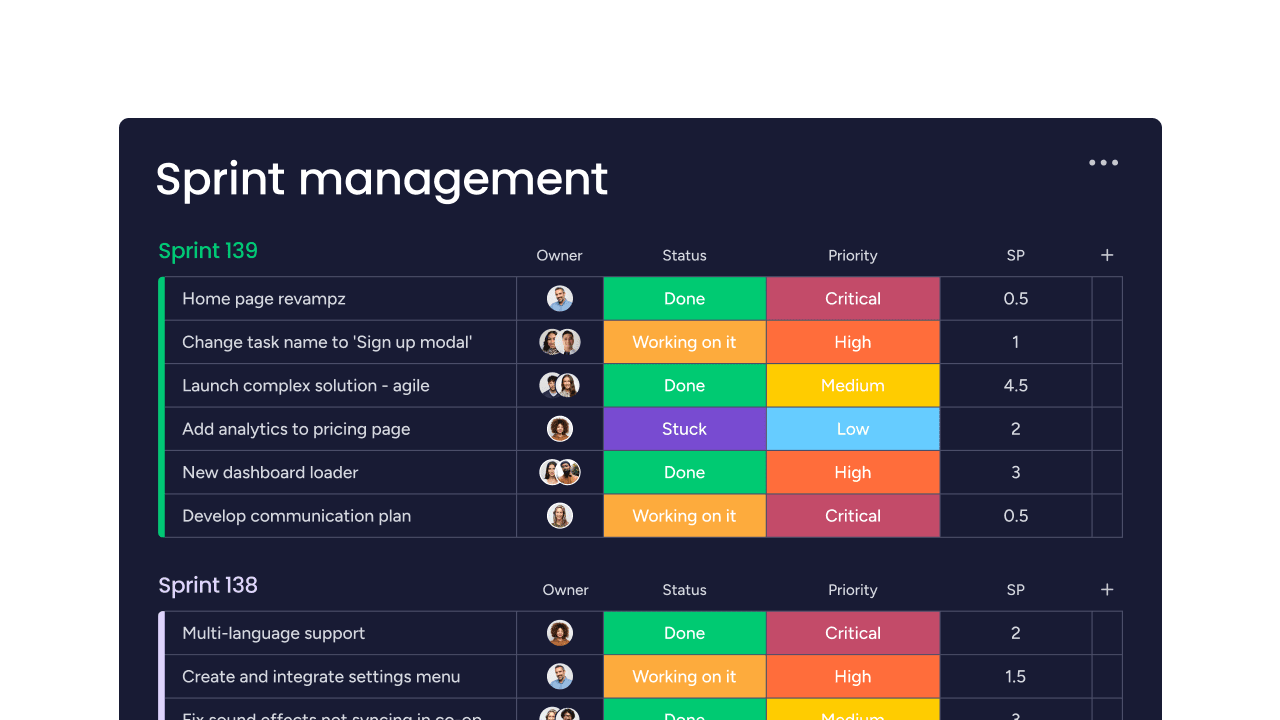
Step 2: Total completed story points
Add up the story points from all completed user stories. If you finished stories worth eight, five, three, and two points, your sprint velocity is 18.
Keep a record of which stories contributed to each sprint’s velocity. This helps you spot patterns later.
Step 3: Calculate average velocity
Average velocity emerges after several sprints. Most teams need three to five sprints to establish a reliable baseline.
Add your last few sprint velocities and divide by the number of sprints. If your last four sprints delivered 18, 22, 16, and 20 points, your average velocity is 19 points.
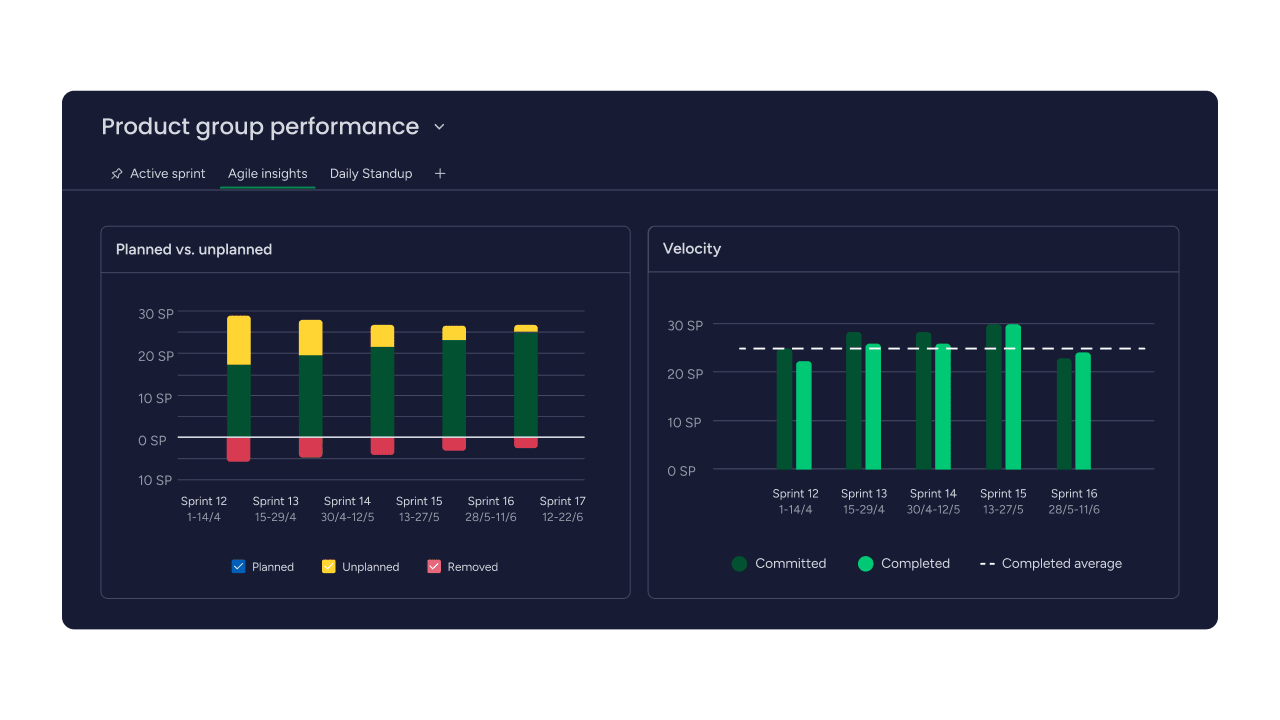
Velocity charts and visualization
Velocity charts plot your sprint performance over time. The x-axis shows sprint numbers, while the y-axis displays story points completed. Alongside velocity charts, Agile burndown charts can also help teams track progress daily.
These visual tools help you spot trends instantly. Is velocity climbing? Dropping? Staying steady? Charts make patterns obvious that numbers alone might hide.
Try monday dev
Benefits of velocity in Agile development
Velocity transforms guesswork into data-driven planning. Here’s how it can help drastically improve your development process:
Accurate sprint planning
Historical velocity prevents overcommitment. When you know your team averages 20 points per sprint, you won’t plan for 35.
This accuracy reduces sprint failures and team burnout. Your team delivers what they promise, building trust with stakeholders.
Reliable project forecasting
Need to know when a project will finish? Divide remaining story points by average velocity.
If you have 100 points left and average 20 points per sprint, expect 5 more sprints. Simple math replaces wishful thinking.
Team performance insights
Velocity trends reveal hidden problems before they explode, and this clarity is critical, as employees who understand how their success is measured are twice as likely to feel motivated. Declining velocity might indicate:
- Technical debt: Code quality issues slowing development. A 2024 study from Cornell University confirms that technical debt leads to significant consequences, including reduced productivity, system degradation, and increased maintenance costs.
- Team morale: Burnout or disengagement affecting productivity.
- Process problems: Inefficient workflows creating bottlenecks.
AI-powered analytics in monday dev bring these patterns to the surface automatically, highlighting anomalies early so teams can take action before they become bigger issues.
Data-driven resource allocation
Velocity data guides staffing decisions objectively. When velocity consistently falls short of targets, you have evidence for additional resources.
Conversely, teams with rising velocity might handle increased scope. Numbers replace gut feelings in resource planning.
Common velocity tracking pitfalls
Velocity is a powerful metric for planning and forecasting, but it is also one of the most misunderstood. When misused, it can create false signals, damage team morale, and even slow delivery instead of improving it.
The key is to treat velocity as a guide for sustainable planning, not as a scoreboard. Understanding the most common pitfalls helps teams avoid misinterpretation and keep velocity aligned with agile values.
Comparing different teams
Never compare Team A’s velocity to Team B’s velocity. Each team has its own story point scale and context.
One team’s five-point story might be another team’s eight-pointer. These differences make cross-team comparisons meaningless.
Treating velocity as individual performance
Velocity measures team output, not individual productivity. Using it for performance reviews destroys collaboration.
Software development requires teamwork, one of the core agile values. The developer who helps others debug contributes to velocity even without closing their own stories.
Ignoring context and external factors
Raw velocity numbers rarely tell the whole story. A team’s output can fluctuate for reasons that have little to do with performance, such as:
- Team changes: new members ramping up on the codebase.
- External dependencies: waiting on other teams or systems to deliver.
- Unplanned work: production issues or urgent fixes pulling time away from sprint goals.
Tracking these factors alongside velocity is essential for drawing accurate conclusions. With its ability to connect velocity data to dependencies, unplanned work, and team changes, monday dev provides the context leaders need to make fair assessments. This holistic view not only prevents misinterpretation but also strengthens the foundation for a successful agile transformation.
Prioritizing speed over value delivery
Chasing higher velocity often backfires. Teams might split stories unnecessarily or skip quality practices to inflate numbers.
Focus on sustainable pace and valuable features, a guiding principle in agile product management. For example, 20 high-quality story points beat 30 rushed points every time.
Velocity vs capacity in Agile
Velocity and capacity are closely related, but they serve different purposes. Velocity shows how much work a team typically delivers, while capacity reflects how much the team can take on in a specific sprint. Understanding the distinction — and when to use each — is key to creating accurate plans and sustainable commitments.
What is team capacity?
Capacity measures available work hours in an upcoming sprint. It accounts for vacations, meetings, and other time commitments.
While velocity looks backward at what you accomplished, capacity looks forward at what time you have available. This distinction is crucial: velocity helps you forecast based on past performance, while capacity helps you plan based on future availability.
When to use each metric
| Metric | Best used for | Time frame | Measurement unit |
|---|---|---|---|
| Velocity | Sprint planning and project forecasting | Historical performance | Story points |
| Capacity | Resource planning and workload management | Upcoming sprint availability | Hours or days |
Combining velocity and capacity
High-performing teams rely on both metrics together. Capacity shows how much time is available, while velocity reflects how much work the team usually delivers within that time.
When capacity drops — for example, during a holiday sprint — velocity will likely decrease as well. Using both measures side by side helps teams set realistic expectations and avoid overcommitting.
Try monday dev5 best practices for improving sprint velocity
Want to boost velocity sustainably? These practices deliver lasting improvements without sacrificing quality.
1. Maintain stable team composition
Team changes almost always disrupt velocity, since new members need time to get familiar with the codebase, processes, and domain. To minimize the impact:
- Keep teams intact whenever possible to preserve consistency and momentum.
- Plan overlap between departing and arriving members so knowledge is transferred smoothly.
- Support onboarding with clear documentation and mentoring to reduce the learning curve.
A stable team creates a more predictable velocity and makes forecasting far more reliable.
2. Refine story point estimation
Poor estimates disrupt velocity and make planning unpredictable. Research from the International Society of Six Sigma Professionals shows that structured velocity tracking can improve estimation accuracy by about 40%, creating a stronger foundation for any agile transformation.
Teams can use agile estimation techniques such as planning poker to align on effort, while AI capabilities in monday dev build on this by analyzing historical estimates and suggesting point values. The result is less guesswork and more consistent delivery.
3. Limit work in progress
Starting too many tasks often means finishing none of them. Setting work-in-progress (WIP) limits keeps the team focused on completing stories rather than spreading effort too thin.
With fewer items in play, team members naturally collaborate to finish what’s already started instead of opening new work. This focus leads to steadier flow and more predictable velocity.
4. Address technical debt proactively
Technical debt is velocity’s silent killer. Each sprint gets harder as code quality degrades.
Allocate sprint capacity for refactoring and improvements. Short-term velocity might dip, but long-term sustainability improves dramatically.
5. Embrace continuous improvement
Every retrospective is a velocity improvement opportunity, which is why many Scrum teams rely on scrum metrics to refine their processes. What slowed you down? What could work more smoothly?
Turn insights into experiments. Try new approaches, measure results, and keep what works.
How to use velocity for sprint planning
Velocity turns sprint planning from guesswork into a data-driven process. By grounding commitments in past performance, teams can forecast more accurately, set realistic expectations with stakeholders, and adjust plans when circumstances change. Done well, velocity becomes the foundation for sprint planning that is both predictable and sustainable.
Forecasting future sprints
Start with your average velocity as a planning baseline. If you average 20 points, plan for approximately 20 points next sprint.
Adjust for known factors. Team member on vacation? Plan for slightly less. Extra focused time available? Maybe plan one or two points more.
Managing stakeholder expectations
Velocity-based forecasts help build trust with stakeholders by replacing guesswork with data. To keep expectations realistic and confidence high:
- Use velocity data to back your estimates — saying “five more sprints” carries weight when past performance supports it.
- Share velocity charts in updates — visual proof of consistent delivery reassures even the most anxious executives.
- Highlight trends, not just numbers — showing stability or improvement over time builds credibility.
Adjusting for team changes
Changes in team composition have a direct impact on velocity. Planning realistically during these transitions prevents overcommitment:
- Account for onboarding time — expect 50–70% of normal velocity while new members ramp up.
- Recognize the wider impact of departures — losing one person often affects knowledge, workflows, and team dynamics.
- Reassess velocity after transitions — allow a few sprints for the team to stabilize before treating new numbers as a baseline.
How monday dev transforms velocity tracking
Manual velocity tracking often results in inconsistent data, outdated reports, and unnecessary overhead. With automation, real-time dashboards, and AI-driven insights built in, monday dev turns tracking into a seamless process. Teams get accurate data, actionable recommendations, and visibility that scales from individual squads to the entire organization.
Automated velocity calculations
Spreadsheets and manual counting slow teams down and often lead to errors. Automation in monday dev removes the hassle by:
- Calculating velocity automatically as stories are completed.
- Providing built-in sprint widgets that track completion rates in real time.
- Updating progress instantly as items move to “Done,” so there’s no need to wait until the sprint ends for accurate numbers.
Real-time sprint dashboards
- Visual dashboards that combine velocity trends, sprint progress, and forecasts in a single view.
- Sprint performance widgets with burndown charts displayed alongside velocity metrics, giving stakeholders answers at a glance.
- Customizable views for different audiences — executives see high-level summaries while teams dig into details with Kanban boards and list views.
AI-powered velocity insights
With 86% of IT professionals already using AI, these tools are becoming essential for analyzing velocity patterns and surfacing hidden insights. The AI assistant in monday dev highlights factors that affect performance, such as bottlenecks in QA or testing, and provides actionable recommendations for improvement.
Automated alerts notify teams when velocity deviates from normal patterns. With corrective actions tailored to the workflow, issues can be addressed before they escalate and put delivery at risk.
Cross-team velocity visibility
Portfolio views in monday dev show velocity across multiple teams without inappropriate comparisons. The multi-team dashboard features let you spot organization-wide trends while respecting team contexts through customizable filters.
This visibility helps resource allocation and identifies successful practices to share between teams, with the ability to drill down into any team’s metrics for deeper understanding.
Master Agile velocity for development success
Velocity mastery transforms unpredictable development into reliable delivery, making it a foundational practice in agile project management. But remember — velocity is a planning aid, not a performance target.
Focus on sustainable pace, quality delivery, and continuous improvement: core agile principles. Let velocity guide your decisions without becoming enslaved to the numbers.
monday dev makes velocity tracking effortless while providing insights that improve your entire development process. From automated calculations to AI-powered recommendations, it handles the mechanics so you can focus on building great software.
Try monday dev free for 14 daysFrequently asked questions
How does agile velocity work in distributed development teams?
Agile velocity works the same way in distributed teams as it does in co-located ones: it measures the number of story points completed per sprint, regardless of where team members are located. Remote teams may see fluctuations in velocity at first while they establish communication rhythms and collaboration practices, but performance typically stabilizes once those patterns are in place.
Can agile velocity predict business value delivery accurately?
Agile velocity predicts delivery timelines but not business value, since story points measure work complexity rather than customer impact. Teams must combine velocity data with value-based prioritization to ensure high-velocity delivery focuses on meaningful business outcomes.
What is the ideal velocity range for a development team?
There is no ideal velocity range since story point scales vary between teams and velocity depends on team size, experience, and project complexity. The ideal velocity is one that remains consistent over time, enabling reliable planning and sustainable team performance.
How many sprints does it take to establish reliable velocity baselines?
Teams typically need three to five completed sprints to establish reliable velocity baselines that account for normal variation patterns. New teams or teams with significant changes may require additional sprints to achieve velocity stability for accurate forecasting.
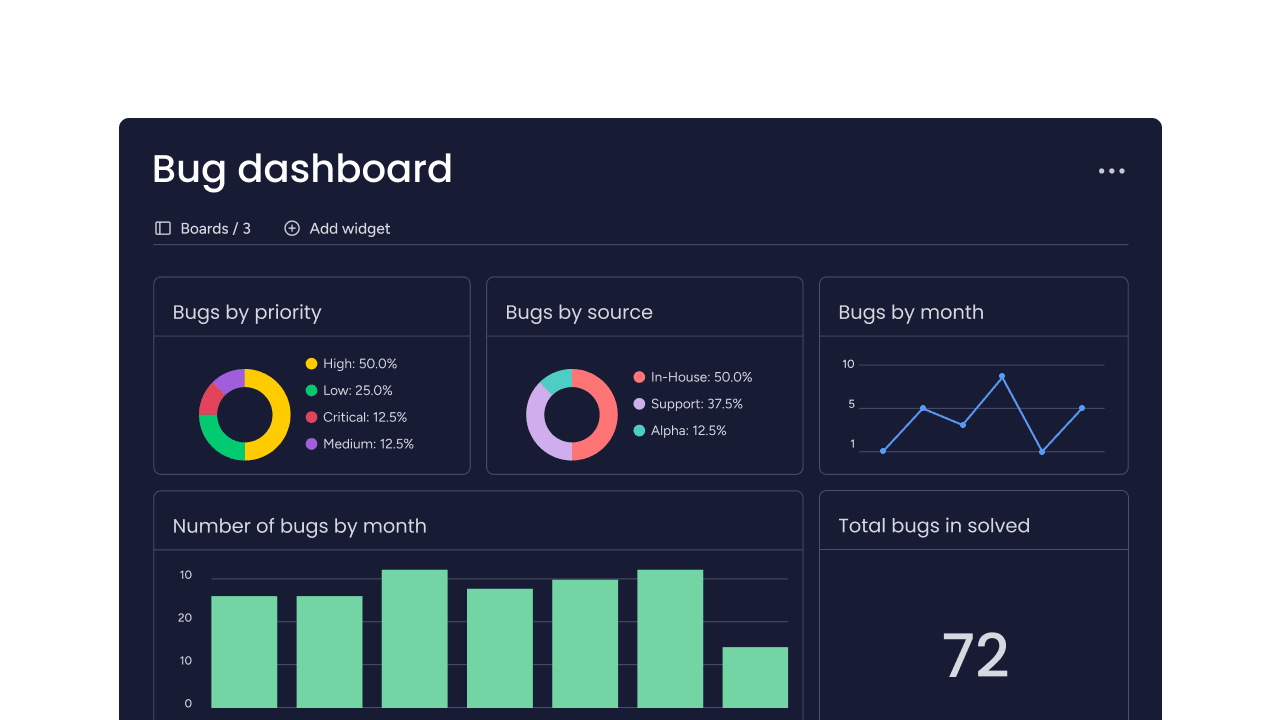
Should bug fixes be included in velocity calculations?
Bug fixes should be included in velocity calculations if they are estimated with story points and tracked as user stories during sprint planning. However, unplanned production fixes that interrupt sprint work should be tracked separately to maintain velocity measurement accuracy.
How can AI improve velocity tracking and forecasting accuracy?
AI improves velocity tracking by analyzing historical patterns to identify trends, predict velocity fluctuations based on team changes, and recommend optimal story point loads for upcoming sprints. AI-powered platforms like monday dev provide automated insights that help teams optimize their velocity without manual analysis overhead.