Budgets rarely fail because of one big mistake. More often, things start to drift. A project runs slightly over, a hire costs more than expected, or a campaign stretches longer than planned. Individually, none of it feels urgent, but over time the gaps add up, and suddenly the numbers no longer reflect reality.
The real issue isn’t the plan itself, it’s the lack of structure behind it. When budgets live in static spreadsheets or disconnected reports, it becomes difficult to track how decisions affect overall spend, spot issues early, or adjust with confidence.
Budget formulas change that. They create a consistent way to plan, track, and adapt as work moves forward, giving leaders a clearer view of costs, performance, and trade-offs in real time.
This article breaks down the formulas that actually matter in day-to-day operations, from core budget calculations and personnel cost modeling to variance tracking and ROI analysis. It also looks at how teams use platforms like monday work management to automate these calculations and keep financial data connected to the work driving it.
Key takeaways
- Build formulas that scale with your organization: Start with basic operating budgets and variance calculations, then layer in ROI analysis and resource allocation models as your financial planning matures.
- Calculate true personnel costs beyond base salaries: Include benefits loading (25-40%), overhead allocation, and equipment costs to avoid immediate budget deficits when hiring new team members.
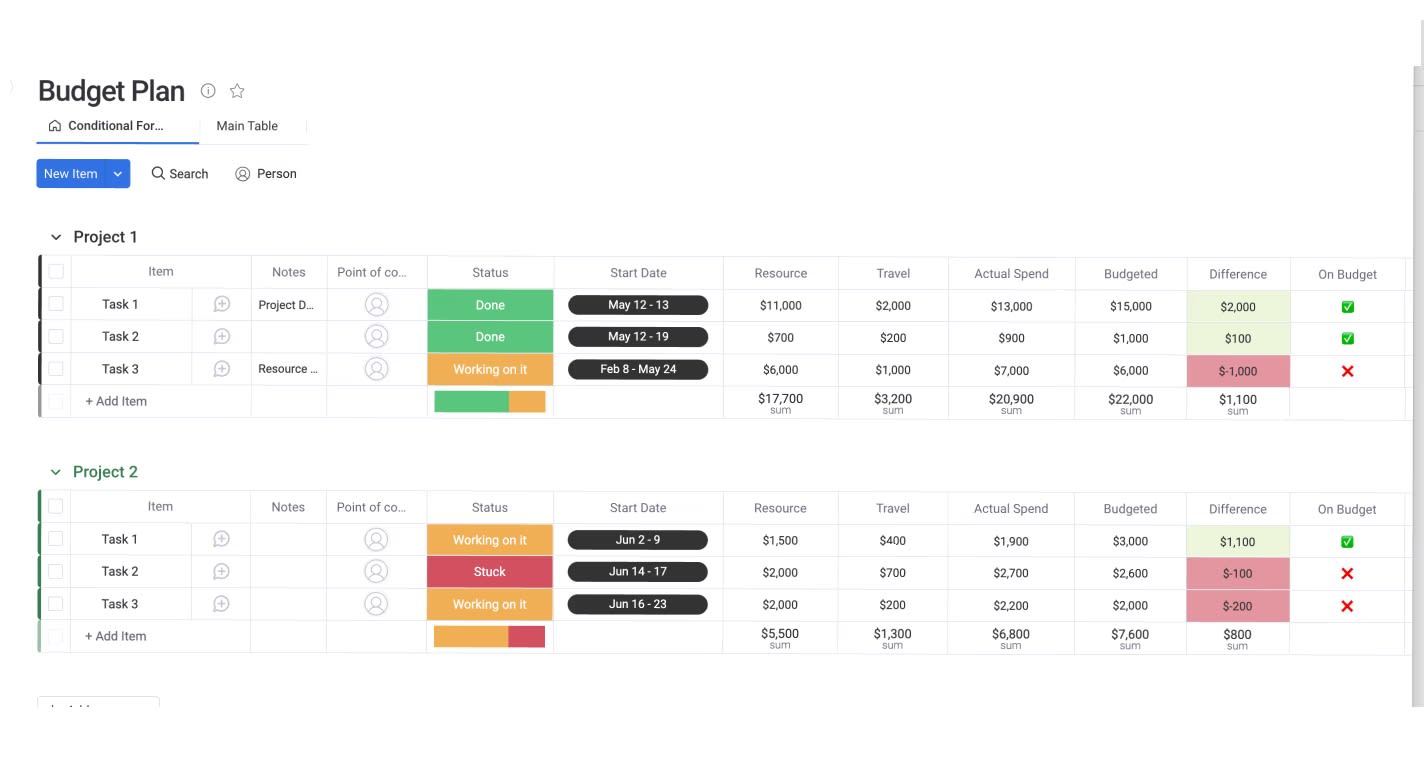
- Transform static budgets into real-time financial dashboards: monday work management’s Formula Columns automatically recalculate budgets as project status updates, eliminating manual data entry and providing instant visibility into spending patterns.
- Use variance analysis to catch problems early: Track percentage differences between planned and actual spending to identify operational drifts before they become budget crises requiring executive intervention.
- Apply weighted priority formulas for fair resource distribution: Remove departmental politics from budget allocation by using objective scoring criteria that align funding with strategic organizational goals.
What are budget formulas and why do leaders rely on them?

Budget formulas are standardized calculations that help you plan spending, track performance, and spot when things go sideways. They connect financial variables like revenue, fixed costs, and expenses to predict outcomes and measure efficiency. If you’re not in finance, these formulas turn budget management from a checkbox exercise into real control over projects and resources.
Unlike simple expense tracking, budget formulas create predictable frameworks for decision-making. They answer the questions that matter: Can we afford this? Where should money go next quarter? How much cushion do we need for surprises?
Formula budgeting vs manual calculations
Manual budgeting works for a while. Early on, a few spreadsheets and quick calculations feel flexible enough to keep things moving. As the organization grows, though, that flexibility starts to turn into risk. More data, more people editing files, and more moving parts make it harder to trust the numbers or keep everything in sync.
That’s where formula-based budgeting starts to separate itself. Instead of recalculating figures every time something changes, the logic is built in upfront, so updates happen automatically and consistently across the entire budget.
The difference becomes much clearer at scale:
| Aspect | Manual calculation | Formula-based approach |
|---|---|---|
| Accuracy | High error risk from typos and broken links | Validated logic with consistent precision |
| Time efficiency | Requires recalculation for every change | Updates automatically when variables shift |
| Scalability | Breaks down with complex datasets | Handles large datasets without performance lag |
| Consistency | Varies by user preference | Standardized across the organization |
| Auditability | Difficult to trace logic flow | Transparent data lineage and calculation steps |
Once budgets reach a certain level of complexity, manual methods stop being practical. Teams using sophisticated solutions such as monday work management automate these calculations so budgets stay accurate, up to date, and visible across departments without constant manual work.
Strategic benefits of formula-based planning
Formula-based budgeting delivers advantages that extend beyond the finance team, directly impacting your organization’s ability to execute strategy effectively. The result? More accurate financial planning and seamless operations you can actually measure.
- Predictable forecasting: Historical trends help predict future spending, so you’re not caught off guard by shortfalls or sitting on unused budget at year-end. You’ll see needs coming months ahead instead of scrambling to fill budget gaps.
- Risk mitigation: Contingency variables built into calculation models automatically buffer against market volatility and operational delays. Maintain control by addressing small deviations before they impact the budget.
- Resource optimization: Math-based allocation sends money to high-priority projects based on objective criteria. Data wins over politics and departmental lobbying.
- Strategic alignment: Unified formulas get everyone speaking the same financial language. Team budgets roll up cleanly to support company goals, creating transparency from executives to project teams.
Essential components of business budget formulas
Know the building blocks and you can troubleshoot errors and refine your models as you go. Every solid formula needs four components working together to produce accurate projections.
- Variables are the inputs that change regularly — units sold, hours worked, or material costs. In systems like monday work management, these pull automatically from your boards — no manual entry needed.
- Constants remain stable over specific periods. Think rent, software subscriptions, or salaried headcount. They’re the stable anchors that keep calculations predictable.
- Assumptions fill gaps when actual data isn’t available. Projected inflation rates or expected market growth fall into this category. Label them clearly so everyone knows what’s fact and what’s projection.
- Calculation logic defines how variables and constants interact to produce your final budget figure. How you structure the math determines whether your numbers are accurate and reliable.
Unlike simple expense tracking, budget formulas create predictable frameworks for decision-making. They answer the questions that matter: Can we afford this? Where should money go next quarter? How much cushion do we need for surprises?
7 fundamental budget formulas for organizational success
These formulas start with basic totals and build to complex liquidity assessments — giving you a complete picture of whether your business can survive and thrive. Each builds on the last, creating a system that grows with your organization.
1. Total operating budget formula
The total operating budget aggregates all anticipated costs for a specific period. It’s your baseline for comparing what you planned to spend against what you actually spent.
Formula: Total Operating Budget = Fixed Costs + Variable Costs + Contingency Reserve
Consider a software development team calculating their Q1 budget:
- Fixed Costs (salaries, licenses): $150,000.
- Variable Costs (cloud usage, contractors): $30,000.
- Contingency Reserve (10% of total): $18,000.
- Total: $198,000.
This formula builds in a safety buffer so small overages don’t need executive sign-off or stall projects.
2. Percentage-based allocation formula
This formula splits budget pools across departments based on priority, taking subjectivity out of the equation.
Formula: Department Allocation = (Department Priority Score / Total Priority Points) × Total Budget
An organization with a $1M innovation fund and three departments demonstrates this approach:
- Department A (Score 50): (50/100) × $1M = $500,000.
- Department B (Score 30): (30/100) × $1M = $300,000.
- Department C (Score 20): (20/100) × $1M = $200,000.
Priority scores come from objective criteria like ROI, strategic fit, and urgency, not who has the loudest voice.
3. Unit cost calculation formula
Unit cost analysis shows how efficiently you’re producing or delivering services. It’s traditionally a manufacturing metric, but it works for knowledge work too: cost per support ticket or feature shipped.
Formula: Unit Cost = Total Production Costs / Number of Units Produced
A marketing team spending $50,000 on a campaign that generates 250 qualified leads calculates: $50,000 / 250 = $200 per lead. Track it over time and you’ll see whether changes actually improve efficiency or just add complexity.
4. Break-even analysis formula
Break-even shows the minimum performance you need to cover costs. For service businesses, that means billable hours or projects needed to keep the lights on.
Formula: Break-Even Point = Fixed Costs / (Revenue per Unit – Variable Cost per Unit)
A consulting firm using a project budget template with $100,000 in monthly fixed costs charges $300 per hour with $100 variable cost per hour for their break-even calculation. Their calculation: $100,000 / ($300 – $100) = 500 billable hours required monthly. Use this to set minimum sales targets and figure out capacity needs.
5. Growth rate projection formula
This formula measures how fast you’re growing or shrinking, so you can project historical trends into future budgets.
Formula: Growth Rate = ((Current Period Value – Previous Period Value) / Previous Period Value) × 100
Q1 revenue of $1M growing to $1.2M in Q2 shows: (($1.2M – $1M) / $1M) × 100 = 20% growth rate. If growth stays consistent, bump up Q3 variable expenses to match demand.
6. Cash flow coverage formula
Profitability doesn’t equal liquidity. This formula makes sure you have enough cash to pay debts and cover operations.
Formula: Cash Flow Coverage = Operating Cash Flow / Total Debt Service
A company generating $500,000 in operating cash flow with $100,000 in debt payments calculates: $500,000 / $100,000 = 5.0 ratio. Ratios below 1.0 mean you can’t pay debts from operations — time to restructure the budget or find financing.
7. Working capital requirements formula
Working capital is the cash you have for day-to-day operations — basically, can you pay this month’s bills?
Formula: Working Capital = Current Assets – Current Liabilities
For example:
- Current Assets (cash, receivables): $400,000.
- Current Liabilities (payables, short-term debt): $250,000.
- Working Capital: $150,000.
Positive working capital gives you room to invest in growth. During busy seasons, you’ll need more — adjust the budget to keep cash flowing.
Personnel budget formulas that capture true costs
People costs eat up 60-80% of most operating budgets. If you only budget for base salaries, you’ll come up short — often by a lot. Accurate personnel formulas include the full cost of employment: benefits, overhead, and support infrastructure.
Base salary calculation methods
Standardize salary calculations and you’ll stay consistent across your workforce. Different employment types need different approaches to keep numbers accurate.
- Hourly employees: Annual Salary = Hourly Rate × Hours per Week × 52
Salaried exempt: Fixed annual amount divided by pay periods
Commission-based: Base Salary + (Target Sales Volume × Commission Rate)
A contractor working 20 hours weekly at $50/hour calculates to $50 × 20 × 52 = $52,000 annually. Standardize inputs and you can roll up reporting across different workforce types.
Benefits loading formula
Benefits loading adds non-salary costs like health insurance, retirement matching, and payroll taxes. Recent data shows that benefits typically add around 30% on top of wages in private industry.
Formula: Benefits Cost = Base Salary × Benefits Loading Percentage
A company with 30% benefits loading rate demonstrates this calculation:
- Employee Base Salary: $60,000.
- Benefits Cost: $60,000 × 0.30 = $18,000.
- Total Compensation: $78,000.
Loading percentages vary by region and industry, typically ranging from 25% to 40%. Ignore this and you’ll blow the budget the moment you hire someone.
Overhead allocation rate
Overhead allocation splits shared costs (rent, utilities, admin support) across employees or departments so you know true profitability.
Formula: Overhead Rate = Total Overhead Costs / Total Direct Labor Costs
With $500,000 total overhead and $2,000,000 direct labor: $500,000 / $2,000,000 = 0.25 or 25%. For every dollar spent on salary, the organization spends an additional $0.25 on support infrastructure.
Fully burdened labor cost
Looking at salary alone never tells the full story. The real cost of an employee includes benefits, overhead, and the tools they need to do their job. Without factoring those in, budgets almost always come up short, especially as teams scale.
The fully burdened labor cost brings all of that together into a single number. It gives a more accurate view of what each hire actually costs the business and makes planning far more reliable.
Here’s how that typically breaks down:
| Component | Cost |
|---|---|
| Base salary | $100,000 |
| Benefits (30%) | $30,000 |
| Overhead allocation (25%) | $25,000 |
| Equipment/training | $5,000 |
| Total fully burdened cost | $160,000 |
This is the number that matters when making hiring decisions, setting project budgets, or pricing services. Teams using monday work management track these inputs automatically, so totals stay accurate without needing to recalculate everything manually.
Try monday work managementStandardize salary calculations and you’ll stay consistent across your workforce. Different employment types need different approaches to keep numbers accurate.
Budget variance formulas for proactive management
Variance analysis turns budgets from static documents into active management tools. Calculate the gap between planned and actual performance, and you’ll gain the foresight to keep projects on track. Think of these formulas as your early warning system:
Standard variance percentage
This formula standardizes the magnitude of budget misses, allowing comparison across different line items.
Formula: Variance Percentage = ((Actual – Budget) / Budget) × 100
Consider this travel budget example:
- Budgeted Travel: $10,000.
- Actual Travel: $12,000.
- Calculation: (($12,000 – $10,000) / $10,000) × 100 = +20% unfavorable variance.
Negative variance in revenue is unfavorable, while negative variance in expenses is favorable. Organizations typically set thresholds where variance becomes actionable without investigation.
Volume-adjusted variance
Standard variance misleads when production volume changes. This formula isolates cost efficiency from volume fluctuations.
Formula: Volume-Adjusted Variance = Actual Costs – (Budget Cost per Unit × Actual Volume)
Your team budgeted $10/unit for 1,000 units ($10,000 total) but spent $12,000 for 1,200 units. Standard variance shows $2,000 overage, but volume-adjusted calculation reveals: $12,000 – ($10 × 1,200) = $0. The team spent more because they produced more — efficiency remained exactly on budget.
Efficiency index formula
The efficiency index measures operational productivity by comparing standard hours allowed against actual hours worked.
Formula: Efficiency Index = (Standard Hours × Standard Rate) / (Actual Hours × Actual Rate)
A project estimated at 100 hours took 120 hours. Assuming equal rates: 100 / 120 = 0.83 or 83% efficiency. Indices below 1.0 indicate lower efficiency than planned, signaling need for process improvement or training.
Rolling forecast accuracy
This metric evaluates your budgeting process reliability, building stakeholder trust over time.
Formula: Forecast Accuracy = one – (|Actual – Forecast| / Actual)
With $90,000 forecast and $100,000 actual: one – (|$100k – $90k| / $100k) = one – 0.10 = 90% accuracy. Tracking this metric helps refine assumptions. Accuracy typically improves as forecast horizons shorten.
ROI formulas that demonstrate strategic value
ROI formulas provide evidence to justify budget requests and validate past expenditures. They shift conversations from cost to value creation, helping leaders make data-driven investment decisions that align with organizational priorities.
Basic return on investment
The classic ROI formula measures investment efficiency relative to cost.
Formula: ROI = (Gain from Investment – Cost of Investment) / Cost of Investment × 100
An automated marketing platform costing $20,000 generates $100,000 in additional sales: ($100,000 – $20,000) / $20,000 × 100 = 400% ROI. Gains include both financial returns and operational benefits like hours saved multiplied by hourly rates.
Net present value calculation
NPV accounts for time value of money — a dollar today worth more than a dollar next year.
Formula: NPV = Σ(Cash Flow / (one + Discount Rate)^Period) – Initial Investment
An investment requiring $100,000 today returns $40,000 annually for three years. Using 10% discount rate, future cash flows discount to present value. When summed present values exceed $100,000, NPV is positive and the project is financially viable.
Payback period analysis
This formula calculates time to recoup initial capital outlay, critical for managing liquidity risk.
Formula: Payback Period = Initial Investment / Annual Cash Flow
A new machine costing $50,000 saves $10,000 yearly in labor: $50,000 / $10,000 = five years. Shorter payback periods are preferred in volatile markets, while longer periods are acceptable for strategic infrastructure.
Benefit-cost ratio formula
BCR compares present value of benefits to costs, particularly useful when comparing projects of different sizes.
Formula: Benefit-Cost Ratio = Present Value of Benefits / Present Value of Costs
Project A costs $1M and returns $1.5M (BCR 1.5). Project B costs $100k and returns $200k (BCR 2.0). Although Project A returns more total dollars, Project B uses capital more efficiently.
Try monday work managementResource allocation formulas across teams
Allocating budget across teams is where things often get complicated. Multiple projects compete for the same resources, and without a clear framework, decisions can start to feel inconsistent or reactive.
Structured allocation formulas help bring clarity to that process. They define how resources should be distributed based on priority, capacity, and usage, so teams know what to expect and leaders can justify decisions with confidence.
The following formulas show the most common ways organizations approach this, from priority-based distribution to capacity planning and shared cost allocation.
Weighted priority distribution
This method assigns resources based on project alignment with organizational goals.
Formula: Resource Allocation = (Project Weight × Available Resources) / Sum of All Project Weights
Three projects compete for ten developers:
- Project A (Strategic Criticality High, Weight five).
- Project B (Maintenance Medium, Weight three).
- Project C (Experimental Low, Weight two).
- Total Weight: 10.
- Project A Allocation: (five × ten) / ten = five Developers.
Stakeholders agree on weighting criteria upfront, making final allocation objective and defensible.
Capacity-based assignment formula
This formula ensures budget allocations match actual team availability and skill level.
Formula: Team Allocation = (Team Capacity × Utilization Rate) / Total Required Capacity × Total Budget
A team has 1,000 hours capacity with 80% realistic utilization (accounting for meetings/admin): 800 effective hours. If the project requires 1,600 total hours, this team handles 50% of work and receives 50% of labor budget.
Cross-functional cost sharing
Shared resources like IT infrastructure must be allocated fairly across departments to reflect true operating costs.
Formula: Shared Cost Allocation = (Department Usage / Total Usage) × Total Shared Cost
An enterprise software license costs $100,000:
- Sales Department: 60 users.
- Marketing Department: 40 users.
- Total Users: 100.
- Sales Allocation: (60/100) × $100,000 = $60,000.
Allocation bases vary by cost type: headcount for HR, square footage for facilities, or revenue for branding expenses.
Automated budget formulas for real-time insights
Moving formulas from static spreadsheets into dynamic workflows ensures calculations happen instantly as work progresses. This provides real-time visibility into financial health across the organization, enabling faster decision-making and more accurate forecasting.
Dynamic calculation setup
Automated environments allow set-and-forget formula structures. When variables change — project status updates, contractor hours logged — linked formulas recalculate automatically across the entire portfolio.
Teams using intelligent platforms like monday work management can configure Formula Columns that update instantly when sub-item expenses are added. This eliminates manual data aggregation and cell referencing, ensuring budgets reflect current reality without constant maintenance.
Formula-triggered notifications
Automation transforms formulas into active monitoring systems. Leaders configure logic rules that trigger alerts based on calculation results.
Logic example: IF(Variance Percentage > 10%, “Notify Director”, “No Action”)
A project manager receives instant notification when specific line items exceed allocated budget by defined thresholds. This enables immediate corrective action — pausing spend or reallocating funds — rather than waiting for month-end reconciliation reports.
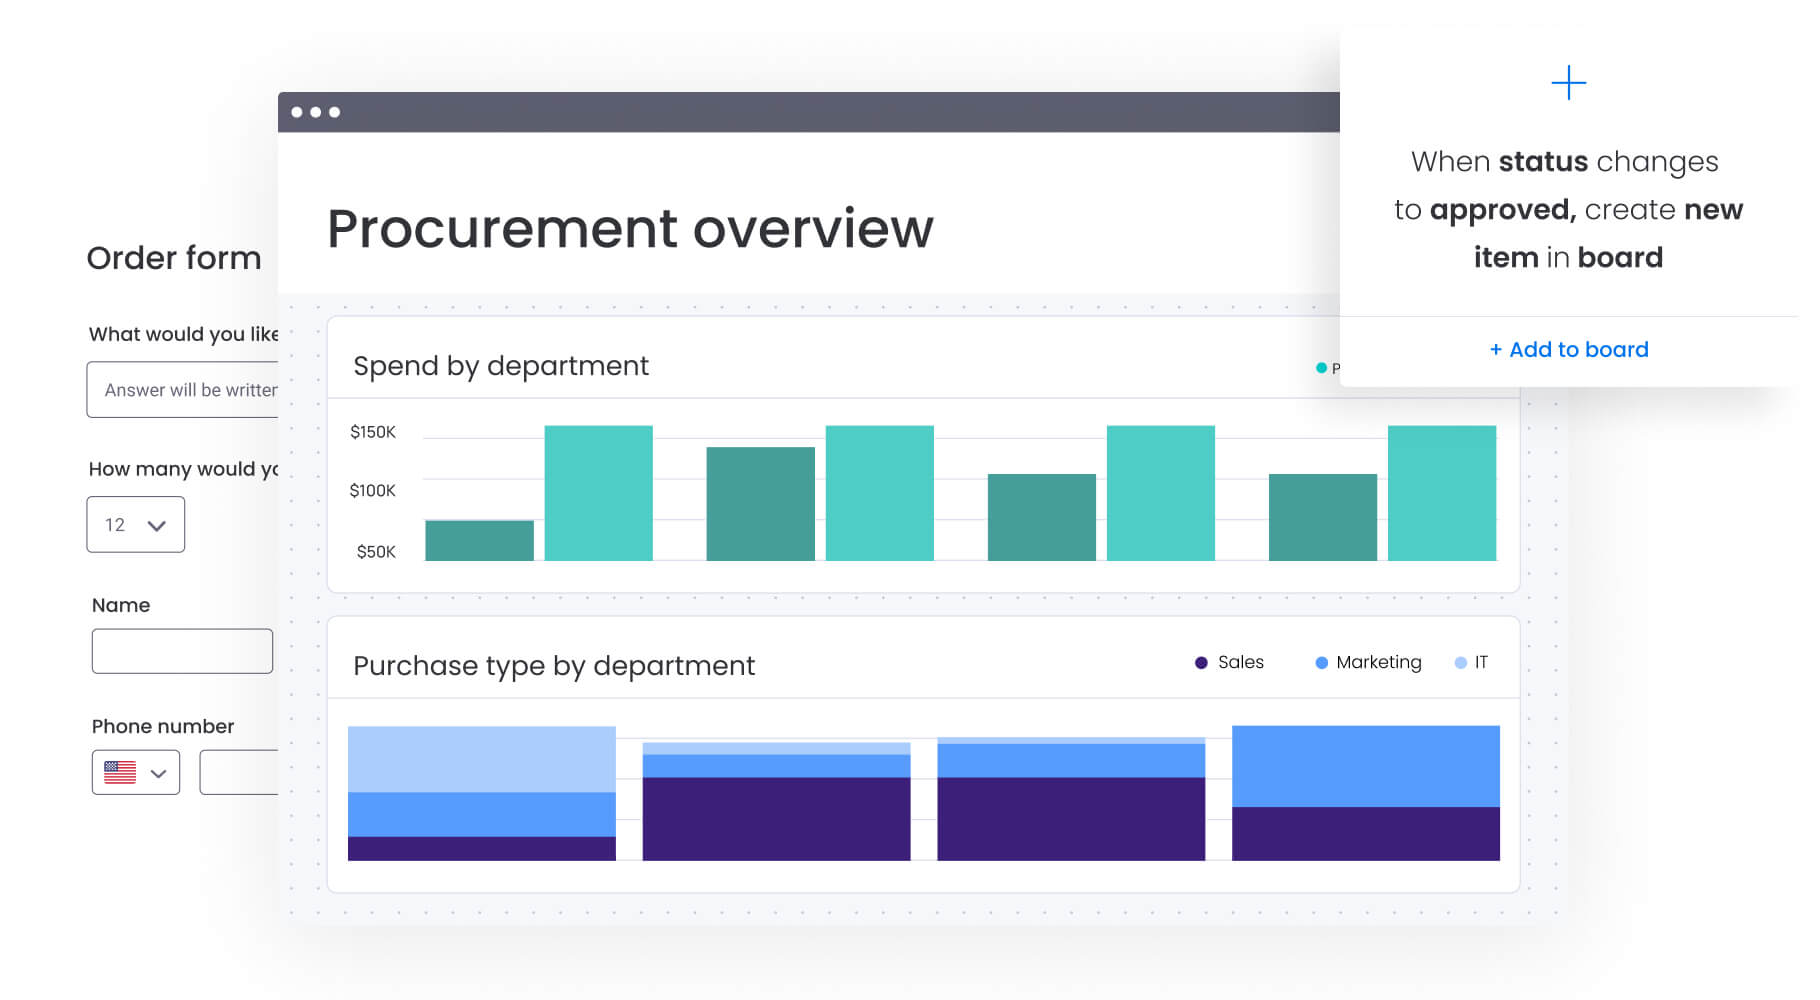
Multi-department formula integration
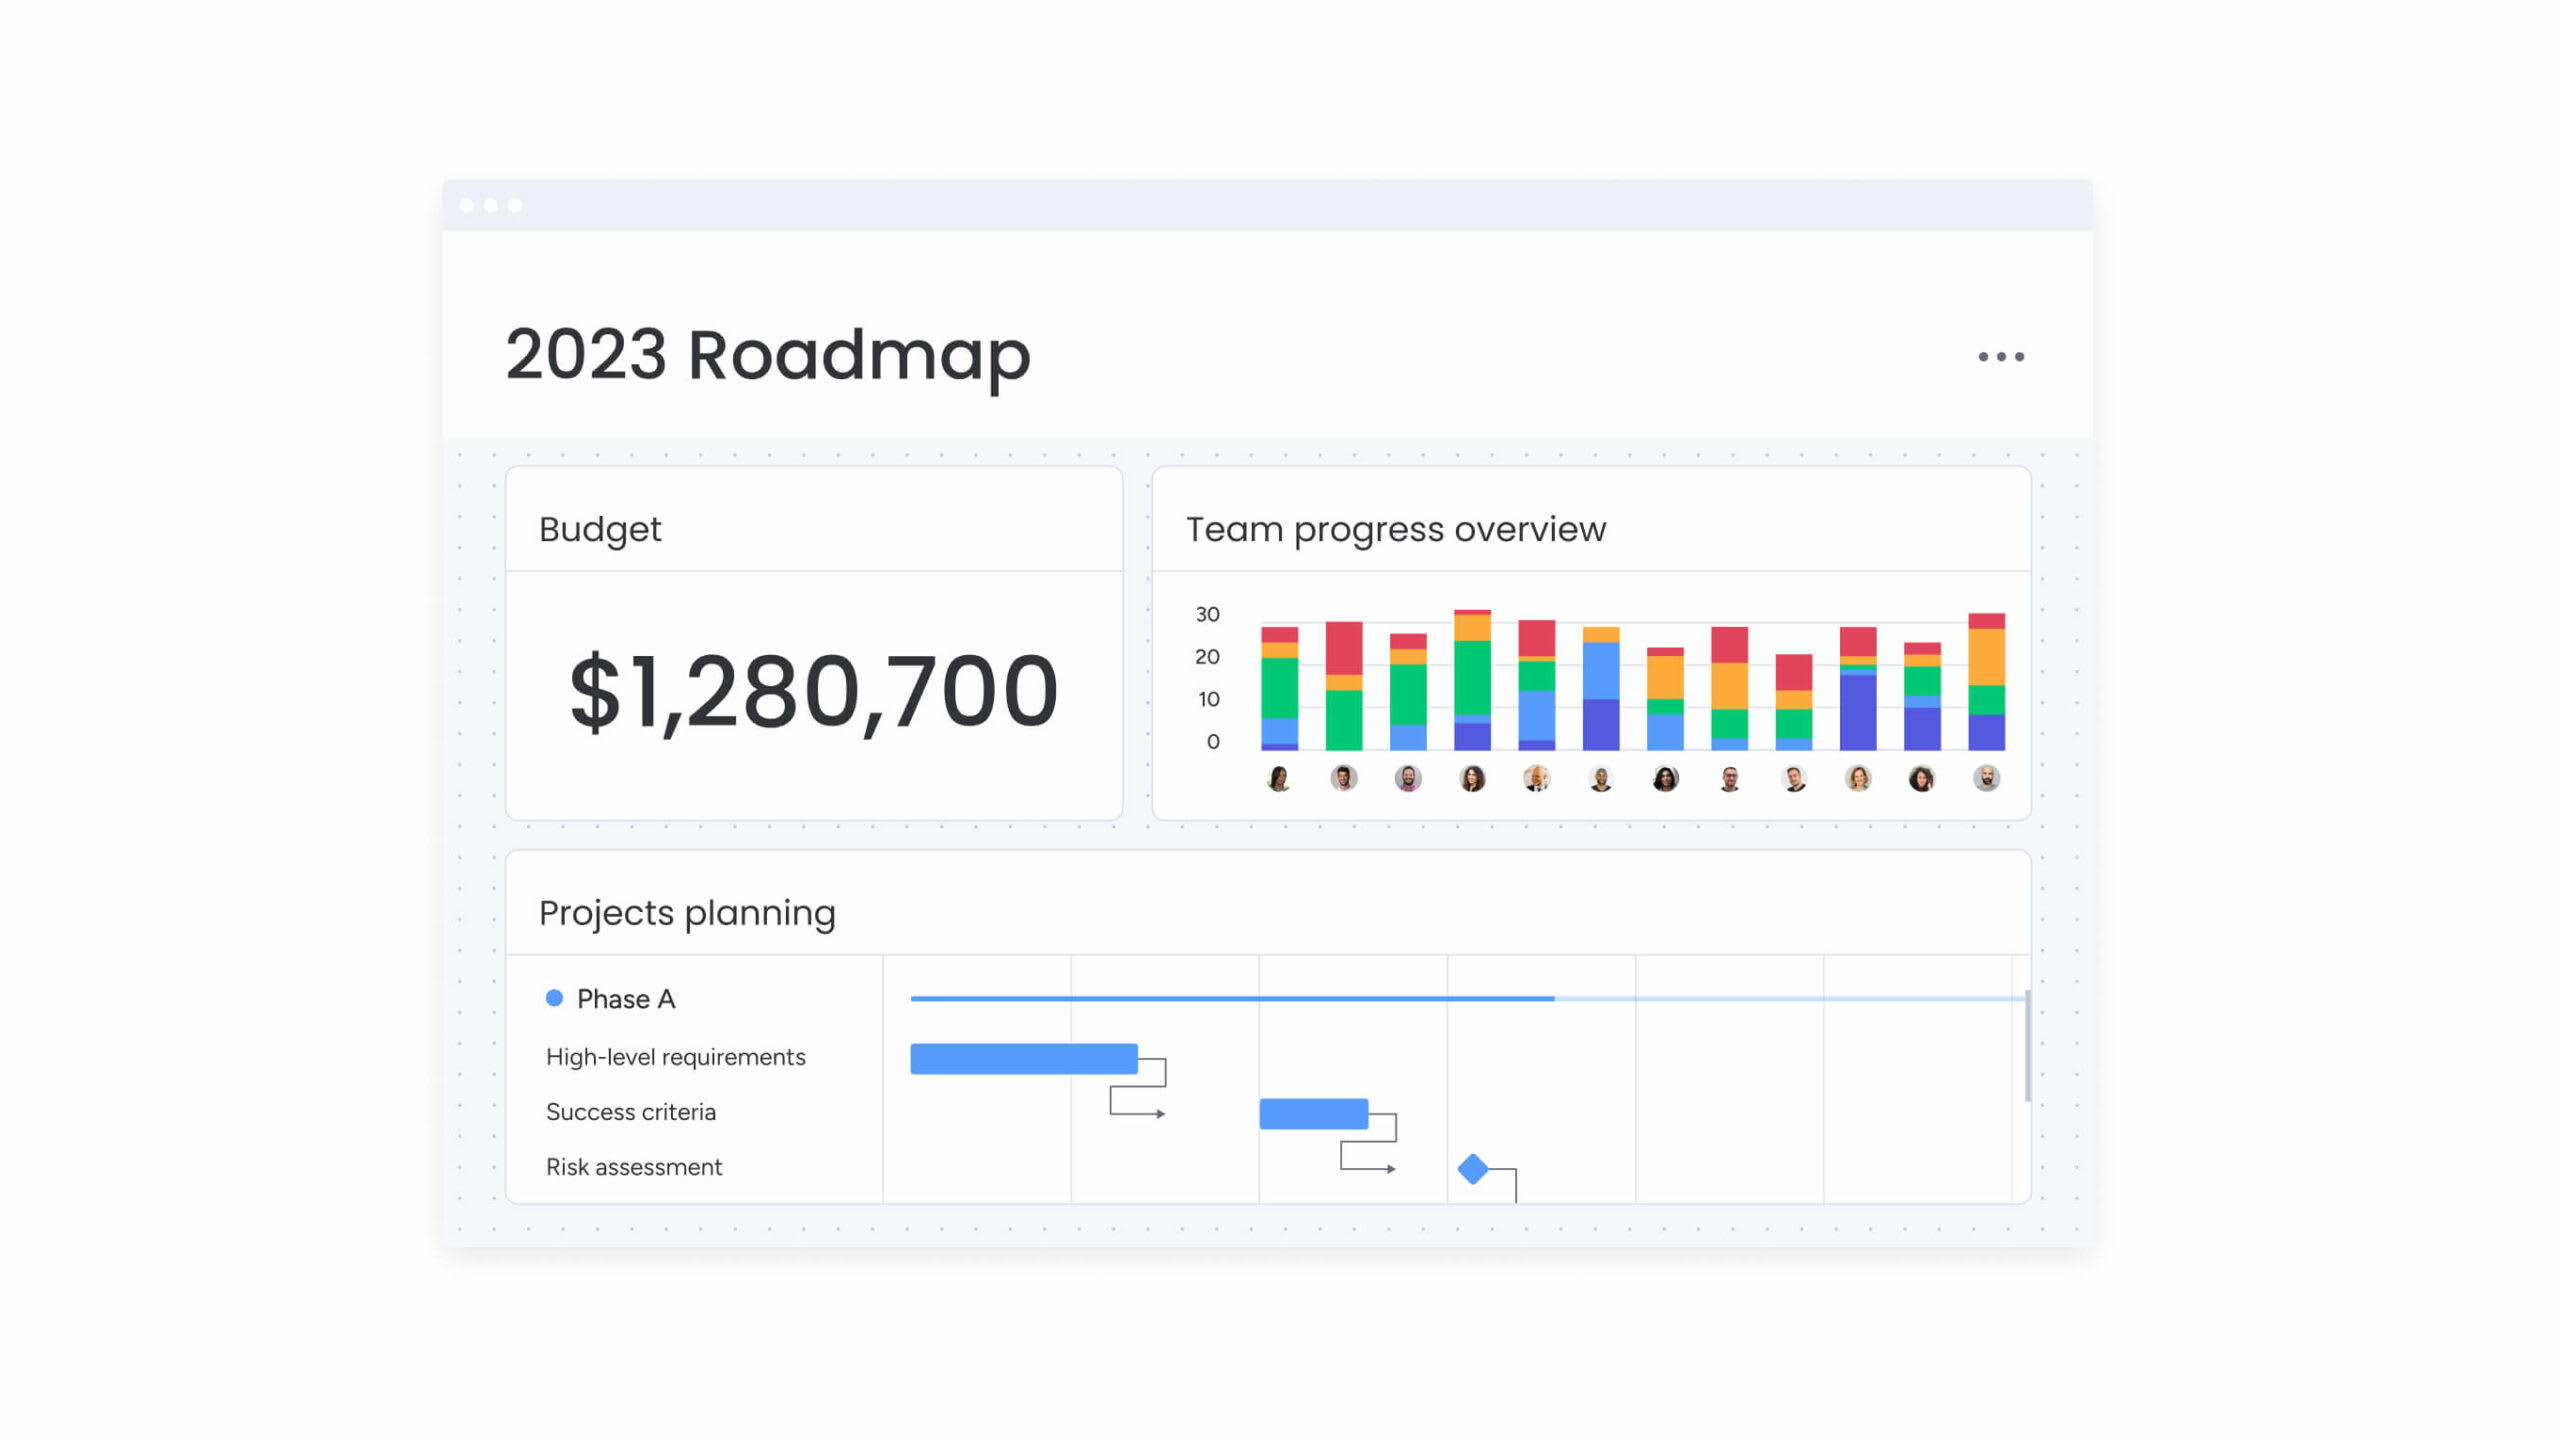
Advanced automation connects disparate budget sheets into unified views. Formulas pull data from marketing, sales, and IT boards into master executive dashboards.
This integration ensures budget cuts in one department automatically reflect in organization-wide rolling forecasts, maintaining data consistency without manual copy-pasting. Teams leverage monday work management dashboards to display live high-level project data for insights on budget, goals, schedules, and resources — all updating in real time.
Try monday work management
AI-enhanced formulas for predictive budget accuracy
Traditional budget formulas tell you what’s already happened or what should happen based on fixed assumptions. That works to a point, but it leaves little room for anticipating how things actually unfold in real conditions.
AI adds a forward-looking layer. By analyzing historical data, trends, and patterns across projects, it helps surface risks earlier and refine forecasts so budgets reflect what’s likely to happen, not just what was planned.
Predictive spend forecasting
AI algorithms analyze historical spending patterns, seasonality, and project velocity to predict future costs with higher accuracy than linear formulas. Instead of assuming flat burn rates, AI detects that Q4 expenses typically spike 15% and adjusts forecasts accordingly.
This predictive capability allows leaders to secure necessary budget approvals months in advance.
Risk-adjusted budget buffers
Standard contingency formulas apply flat percentages regardless of project risk. AI enhances this by calculating dynamic buffers based on project complexity, team experience, and historical variance data.
A high-risk R&D project might receive 25% buffer while routine maintenance gets 5%, resulting in more efficient capital deployment. monday work management’s Portfolio Risk Insights scans all project boards, flagging potential risks by severity so leaders spot critical issues immediately.
Anomaly detection calculations
AI monitors budget formulas continuously to identify outliers. When a vendor invoice appears 300% higher than historical average for that service, the system flags the anomaly for review before payment authorization.
This proactive detection prevents errors and fraud from impacting the bottom line, keeping budgets on track without manual oversight.
“monday.com has been a life-changer. It gives us transparency, accountability, and a centralized place to manage projects across the globe".
Kendra Seier | Project Manager“monday.com is the link that holds our business together — connecting our support office and stores with the visibility to move fast, stay consistent, and understand the impact on revenue.”
Duncan McHugh | Chief Operations OfficerBuild a budgeting system that keeps up with your work now
Budget formulas are only as useful as the systems they live in. When they sit in static spreadsheets, they quickly fall out of sync with what’s actually happening across projects, and the visibility they’re supposed to provide starts to fade.
monday work management connects those formulas directly to execution. Instead of updating numbers after the fact, calculations happen automatically as work progresses. Expenses, timelines, and resource changes feed into the same system, so financial data stays current without constant manual input.
That shift changes how teams manage budgets:
- Formulas stay connected to work: Updates to tasks, timelines, or costs immediately reflect in budget calculations.
- Automation reduces manual effort: No need to rebuild spreadsheets or chase down updates across teams.
- AI supports decision-making: AI Blocks categorize expenses, highlight risks, and surface insights without extra analysis.
- Visibility scales across teams: Leaders see high-level performance, while teams focus on the details relevant to them.
The difference becomes clear when comparing how budgeting operates day to day:
| Feature | Traditional spreadsheets | monday work management |
|---|---|---|
| Real-time updates | Requires manual entry/refresh | Updates instantly with work progress |
| Automation | Limited macros/scripts | Native no-code automation triggers |
| Collaboration | Risk of version conflict | Contextual communication on budget items |
| AI integration | Requires external plugins | Built-in AI for analysis and prediction |
| Scalability | Performance degrades with size | Enterprise-grade scale and security |
| Visualizations | Static charts | Interactive drill-down dashboards |
What matters most is what this enables. Budgeting becomes something teams can actively manage, not something they review after the fact. Decisions happen faster, trade-offs are clearer, and financial planning stays aligned with the work driving results.
That’s the real advantage of formula-based budgeting done right.
Try monday work managementFrequently asked questions
What is the 70/20/10 rule budget?
The 70/20/ten rule budget is an allocation framework that dedicates 70% of resources to core operations, 20% to optimizing existing systems, and 10% to high-risk experiments or disruptive initiatives. This framework ensures stability while maintaining room for innovation and growth.
What is the formula to calculate a budget?
The fundamental formula to calculate a budget is Total Budget = Fixed Costs + Variable Costs + Contingency Reserve. This calculation ensures all known expenses are covered while maintaining a safety buffer for unexpected costs or opportunities.
What are the 7 basic Excel formulas?
The seven most common Excel formulas for budgeting are SUM for totaling, AVERAGE for mean cost, IF for conditional logic, VLOOKUP/XLOOKUP for finding data, MIN/MAX for identifying ranges, and COUNT for tallying items. These form the foundation of spreadsheet-based budget management.
What is a good budget formula?
A good budget formula is accurate, scalable, and transparent. It relies on verifiable data inputs and remains simple enough for stakeholders to understand the logic behind calculations while providing actionable insights for decision-making.
How do you calculate budget variance percentage?
To calculate budget variance percentage, you use the formula ((Actual Spend - Budgeted Amount) / Budgeted Amount) × 100. Positive results indicate overspending while negative results show underspending, helping teams identify areas needing attention.
What is zero-based budgeting formula?
Zero-based budgeting doesn't use a specific formula to roll over previous budgets. Instead, it starts every period at zero, requiring leaders to justify every dollar of expense as if it were a new cost, ensuring resources align with current priorities.