
Imagine a sales team closing 100 new customers last quarter, only to find that 40 have vanished just three months later. This scenario plays out across revenue teams everywhere, yet most organizations only realize there is a problem when it is too late to intervene.
User retention metrics change this dynamic by revealing which customers stay engaged and which warning signs predict an impending departure. By tracking everything from basic retention rate to sophisticated predictive scores, revenue leaders gain the visibility needed to protect existing income while identifying new expansion opportunities.
The following analysis explores the ten essential user retention metrics every revenue team should track in 2026, ranging from foundational churn measurements to advanced predictive indicators. We will examine how these metrics reveal different aspects of customer behavior and how centralized platforms can automate tracking across your entire customer base.
Key takeaways
- Track the metrics that predict revenue loss: start with customer retention rate and churn rate to see who’s leaving, then add customer lifetime value to understand the real financial impact of each lost relationship.
- Focus on expansion revenue, not just keeping customers: net revenue retention above 100% means your existing customers are spending more even when some leave; this drives sustainable growth faster than acquiring new customers.
- Spot at-risk customers before they disappear: use predictive retention scores and activation rates to identify warning signs like declining usage or feature abandonment, giving you time to intervene.
- Centralize retention tracking with a unified platform: unify all customer data, interactions, and retention metrics in one place with automated dashboards and AI-powered alerts provided by solutions like monday CRM that notify your team when customers show churn warning signs.
- Build your measurement program gradually: start with two to three core metrics you can act on immediately, establish baselines, then add sophisticated tracking as your team develops expertise and systems.
What are user retention metrics?
User retention metrics provide a clear answer to a fundamental question: are your customers sticking around or walking away? Acting as a comprehensive health monitor, these indicators reveal when users disengage, reduce activity, or deepen their product adoption. By identifying these shifts early, revenue teams can intervene with at-risk accounts before churn occurs and revenue is lost.
For revenue leaders, these metrics directly address the core pillars of business stability: predictable revenue, sustainable growth, and efficient resource allocation. Gaining total clarity on customer behavior allows teams to refine forecasts and move into strategic planning with data-backed confidence.
The real cost of losing customers
Losing customers costs far more than the immediate revenue loss. Customer acquisition cost (CAC) represents the sales, marketing, and onboarding investment required to win each customer. When they leave, that entire investment vanishes.
If a customer costs $500 to acquire but only pays $100 monthly for three months, the result is a $200 net loss. Furthermore, churn eliminates several long-term revenue drivers:
- Referral potential: missed opportunities for word-of-mouth recommendations to new prospects.
- Case study value: missing testimonials and success stories for marketing.
- Expansion revenue: lost upsell and cross-sell opportunities.
- Long-term growth: a customer who would have upgraded to a $300 monthly plan after one year represents $2,400 in lost annual revenue.
Retention metrics identify at-risk customers before they churn, creating opportunities for proactive intervention that saves both the relationship and the revenue.
User retention vs customer retention
While often used interchangeably, these two concepts measure different facets of a relationship. Understanding the distinction provides a more complete picture of business health.
- User retention: focuses on product usage and engagement behaviors — how often someone logs in, which features they use, how many actions they complete, and whether their activity levels increase or decrease over time.
- Customer retention: focuses on the business relationship itself — whether customers continue paying, renew contracts, maintain their accounts, or expand their spending.
These metrics can diverge in revealing ways:
- Subscription without engagement: a customer might retain their subscription (positive customer retention) but rarely use the product (poor user retention), signaling future churn risk despite current revenue.
- Engagement without revenue: a user might engage heavily with a free product (strong user retention) without converting to paid status (no customer retention).
10 essential retention metrics to track
The following metrics provide comprehensive visibility into customer behavior and business health. Each reveals different aspects of your retention performance, from basic customer counts to predictive risk scoring.
1. Customer retention rate
This foundational metric calculates the percentage of customers who remain active over a specific period. It is the most direct way to see if you are maintaining your base.
The retention rate formula:
((Customers at End of Period – New Customers During Period) / Customers at Start of Period) × 100.
- Example calculation: a business starting January with 1,000 customers, acquiring 200 new customers, and ending with 1,100 total customers calculates: ((1,100 – 200) / 1,000) × 100 = 90% retention rate.
| Industry | Annual retention rate | Key retention factors |
|---|---|---|
| SaaS | 85-95% | Product stickiness, workflow integration, switching costs |
| E-commerce | 20-30% | Purchase frequency, brand loyalty, price sensitivity |
| Telecommunications | 75-85% | Contract terms, service quality, network effects |
| Banking | 80-90% | Relationship depth, account complexity, trust factors |
2. Churn rate
Churn rate measures the percentage of customers who stop using your product during a specific time period — essentially the inverse of retention rate. Many businesses prefer tracking churn because it highlights the problem directly, making losses more visible and urgent.
The churn rate formula:
(Customers Lost During Period / Customers at Start of Period) × 100.
Two types of churn require different solutions:
- Voluntary churn: customers actively cancel due to dissatisfaction, lack of value perception, or competitive alternatives.
- Involuntary churn: customers leave through failed payments, expired credit cards, or administrative oversights.
Revenue vs user churn impact:
A business losing 10 small customers at $50 monthly experiences 10% user churn but only $500 in revenue churn. Losing one large customer at $5,000 monthly represents just 1% user churn but $5,000 in revenue churn — ten times the financial impact.
3. Customer lifetime value (CLV)
CLV represents the total revenue expected from a customer throughout their entire relationship. This helps teams determine how much they can afford to spend on acquisition while remaining profitable.
The CLV formula:
(Average Purchase Value × Purchase Frequency × Customer Lifespan)
- Example calculation: a customer spending $100 per purchase, making 2 purchases monthly, and remaining active for 24 months generates: $100 × 2 × 24 = $4,800 in total lifetime value.
CLV drives critical business decisions across multiple functions:
- Marketing teams: use CLV to determine acceptable customer acquisition costs.
- Customer success teams: prioritize high-CLV customers for white-glove service.
- Product teams: weight feature requests from high-CLV segments more heavily.
A 3:1 CLV to CAC ratio serves as the gold standard for sustainable growth. For example, a business with a $3,000 CLV can afford up to $1,000 in acquisition costs while maintaining healthy unit economics. Research indicates that companies employing sophisticated pricing and packaging strategies achieve roughly 16 percentage points higher NRR than those using basic practices, proving that strategic pricing directly amplifies long-term customer value.
4. Net revenue retention (NRR)
NRR measures the revenue retained from existing customers, including upsells and cross-sells. An NRR above 100% means your current customers are growing your business even without new acquisitions.
Let’s look at a tale of two companies with dramatically different retention stories:
- Company A: retains 90% of customers at $100 monthly each. Starting with 1,000 customers and $100,000 MRR, they end the year with 900 customers and $90,000 MRR.
- Company B: retains only 80% of customers, but remaining customers expand spending by 50%. Starting with 1,000 customers and $100,000 MRR, they end with 800 customers but $120,000 MRR.
Company B’s superior NRR (120% vs 90%) indicates healthier growth despite losing more customers. Expansion revenue comes through three primary mechanisms:
- Upsell revenue: customers upgrade to higher-tier plans.
- Cross-sell revenue: customers purchase additional products.
- Usage expansion: revenue increases from consumption-based pricing.
5. Monthly recurring revenue retention
MRR retention measures the percentage of monthly recurring revenue retained from one month to the next, excluding new customer revenue. This granular metric provides faster feedback loops than annual measurements.
The net MRR retention formula:
((MRR at Start – MRR Churn + Expansion MRR) / MRR at Start) × 100
- Example calculation: starting MRR of $100,000, losing $7,000 to churn and downgrades, but gaining $5,000 in expansion revenue: (($100,000 – $7,000 + $5,000) / $100,000) × 100 = 98% net MRR retention.
Effective MRR tracking requires multiple analytical views:
- Monthly trends: reveal seasonal patterns and concerning declines.
- Cohort tracking: shows how each customer group’s retention evolves.
- Segment breakdown: compares retention across plan types and company sizes.
6. Daily, weekly, and monthly active users
Active user metrics measure unique user engagement within specific time periods — daily (DAU), weekly (WAU), or monthly (MAU). The ratios between these metrics reveal engagement depth and product stickiness.
DAU/MAU ratio shows what percentage of monthly users engage daily. Different ratio ranges indicate varying engagement levels:
- 20%+ DAU/MAU: high engagement — users find daily value.
- 10-20% DAU/MAU: moderate engagement — regular but not essential usage.
- Less than 10% DAU/MAU: low engagement — occasional usage indicating retention risk.
The appropriate activity metric depends on your product’s natural usage patterns. CRM systems benefit from daily tracking because users should engage every workday. Project management platforms fit weekly cycles. Financial software often has monthly patterns tied to business cycles.
7. Repeat purchase rate
Repeat purchase rate measures the percentage of customers who make more than one purchase within a specific time period. This metric particularly matters for e-commerce and transactional businesses where customers make discrete purchase decisions.
The formula:
(Customers Who Made Multiple Purchases / Total Customers) × 100
- Example calculation: an online retailer tracking 10,000 customers over 90 days, with 3,000 making two or more purchases: (3,000 / 10,000) × 100 = 30% repeat purchase rate.
Strategies to increase repeat purchase rates focus on creating compelling reasons to return:
- Timing optimization: use purchase history to trigger outreach at optimal windows.
- Personalized recommendations: suggest relevant products based on past purchases.
- Post-purchase engagement: maintain relationships between purchases with valuable content.
8. Activation rate
Activation rate measures the percentage of new users who reach their “Aha!” moment—the specific milestone where they first experience your product’s core value. While acquisition is just a sign-up, activation proves utility; users who hit this mark are significantly more likely to become long-term, loyal advocates.
Research shows that companies with sophisticated adoption journeys achieve roughly a about a seven-percentage-point higher NRR than those with basic approaches. This gap highlights the direct correlation between a strong start and long-term revenue.
Finding your activation moment requires analyzing behavior patterns:
- Correlation analysis: compare the specific actions taken by long-term users against those who churned early.
- User interviews: ask successful customers exactly when they realized the product was essential to their workflow.
- Time-to-value tracking: measure the speed at which users reach their first milestone; a shorter path typically leads to higher retention.
Industry benchmarks for activation:
- Social media: reaching a threshold of 10 connections within the first week.
- Project management: launching the first collaborative team board.
- CRM systems: adding 20 contacts and logging the first deal.
9. Feature adoption rate
Feature adoption rate measures the percentage of users actively using specific product features. Users who adopt more features typically show higher retention rates because they’ve integrated the product more deeply into their workflows.
Analyzing adoption patterns reveals which capabilities drive long-term success:
- Feature correlation: compare retention rates between feature adopters and non-adopters.
- Adoption patterns: group users by feature usage and compare retention rates.
- Stickiness factors: identify features that create switching barriers.
How features create stickiness:
- Data accumulation: valuable data sets that are difficult to migrate.
- Workflow integration: embedded daily processes.
- Network effects: connections with other users.
10. Predictive retention score
Predictive retention score calculates the probability that a customer will remain active based on behavior patterns and usage data. Scores typically range from 0-100, with higher scores indicating higher retention likelihood.
AI and machine learning analyze multiple data points simultaneously to predict churn risk:
- Behavioral patterns: changes in login frequency or feature usage.
- Usage trends: whether activity increases, remains stable, or declines.
- Support interactions: frequency and sentiment of customer service contacts.
| Warning signal | Risk level | Intervention priority |
|---|---|---|
| 50%+ usage decline | High | Immediate outreach |
| Feature abandonment | Medium | Proactive engagement |
| Support escalation | High | Executive involvement |
| Payment friction | Medium | Billing support |
How monday CRM transforms retention tracking
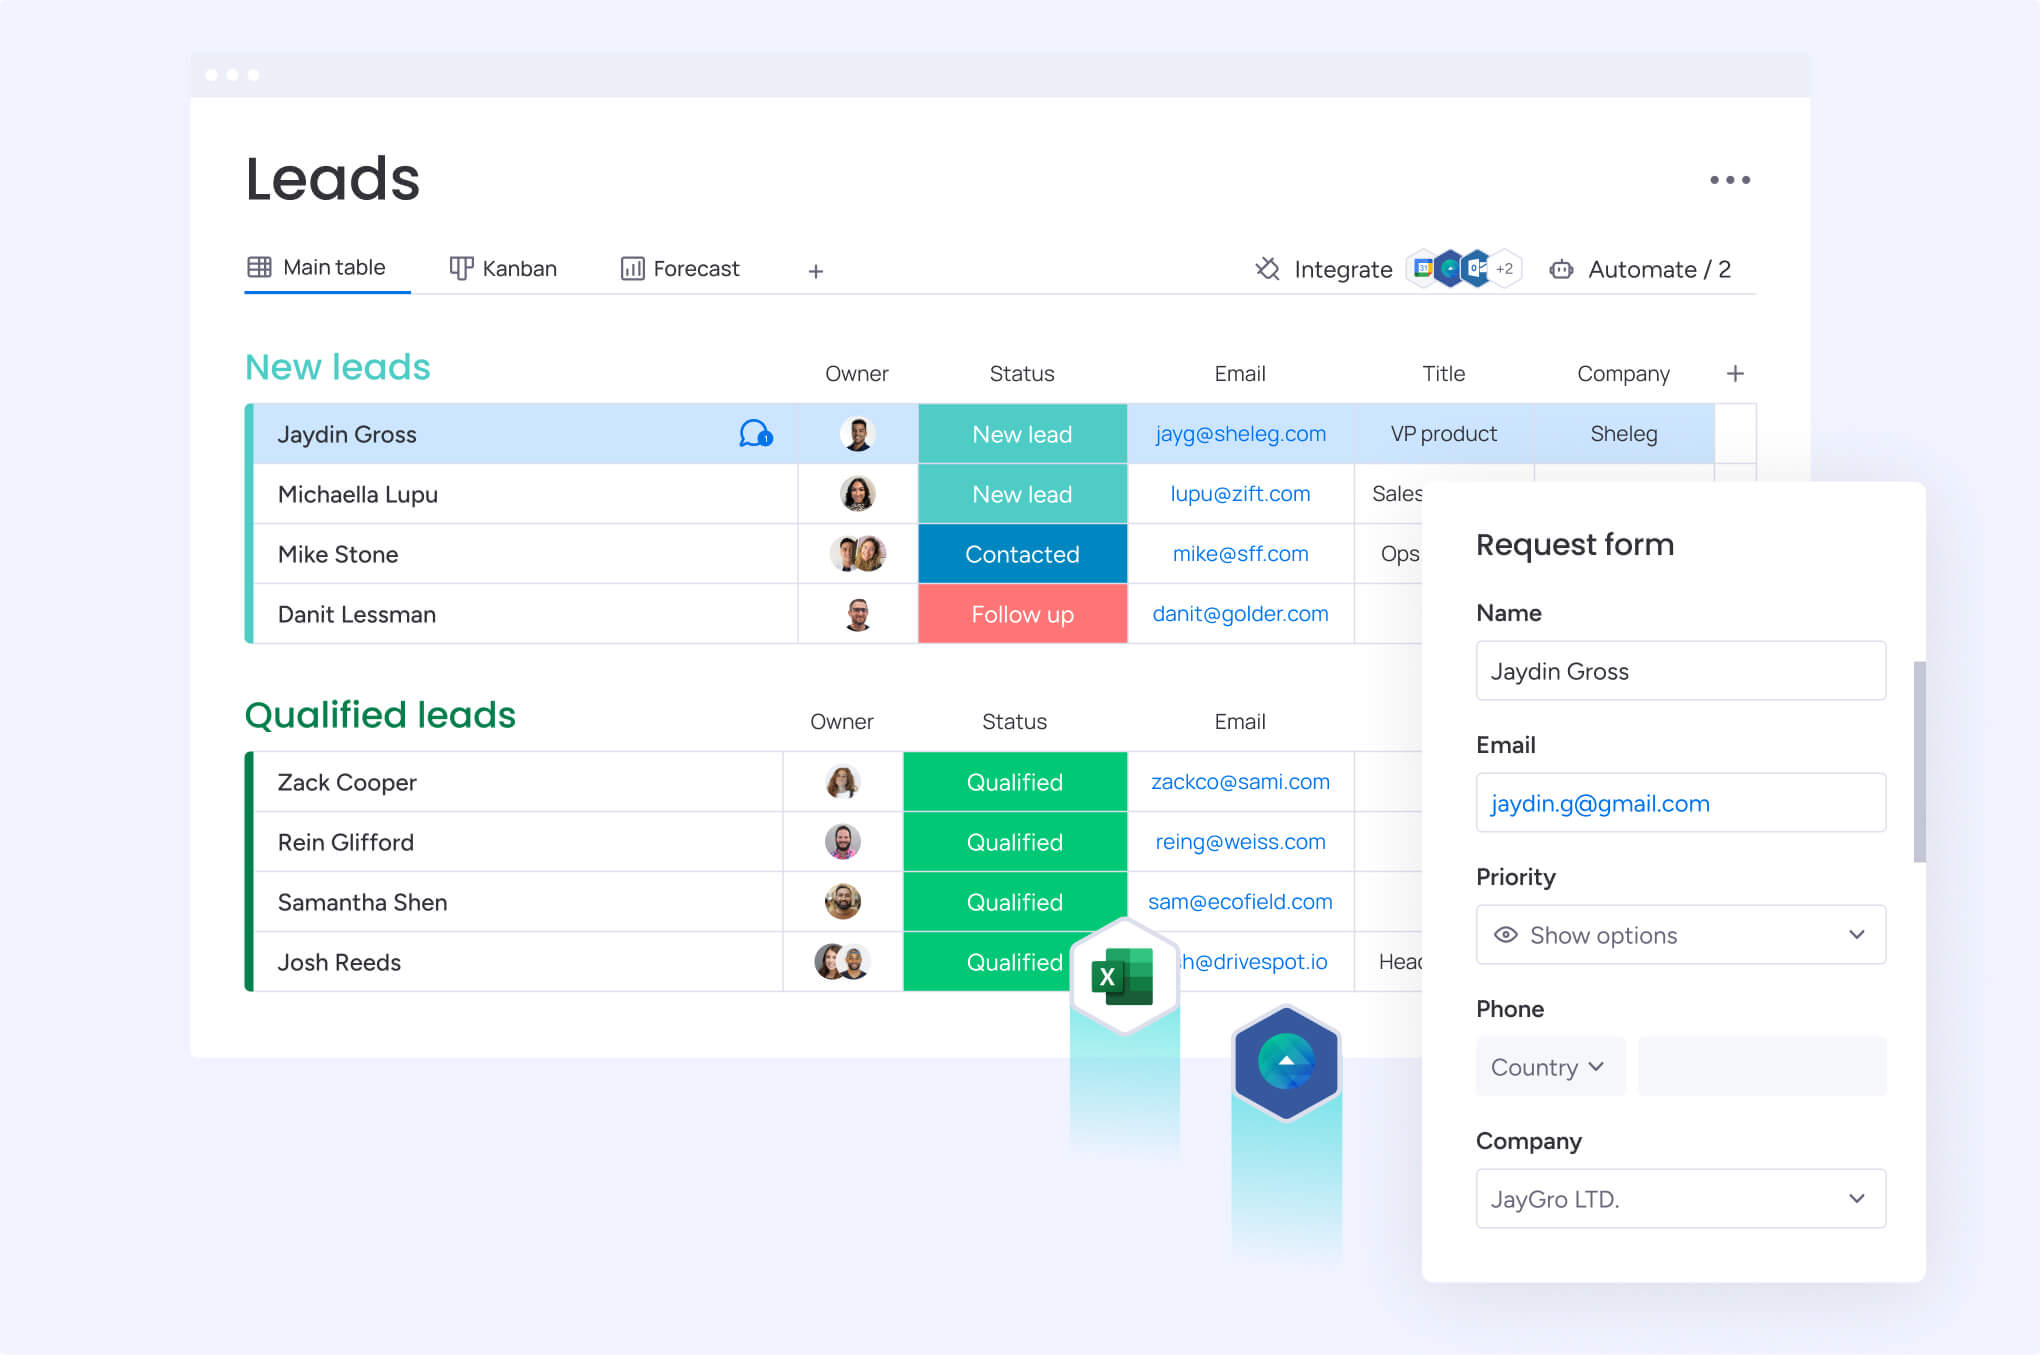
Revenue teams using monday CRM centralize all customer data and interactions in one platform, eliminating the need to switch between multiple platforms or manually combine data from different sources. The platform adapts to different business models and retention tracking needs, whether managing simple customer lists or complex enterprise relationships.
The unified data model connects sales activities, customer communications, support interactions, and product usage in a single view. Sales teams see support ticket history, customer success teams access sales notes, and executives view complete customer timelines without requesting reports from multiple departments.
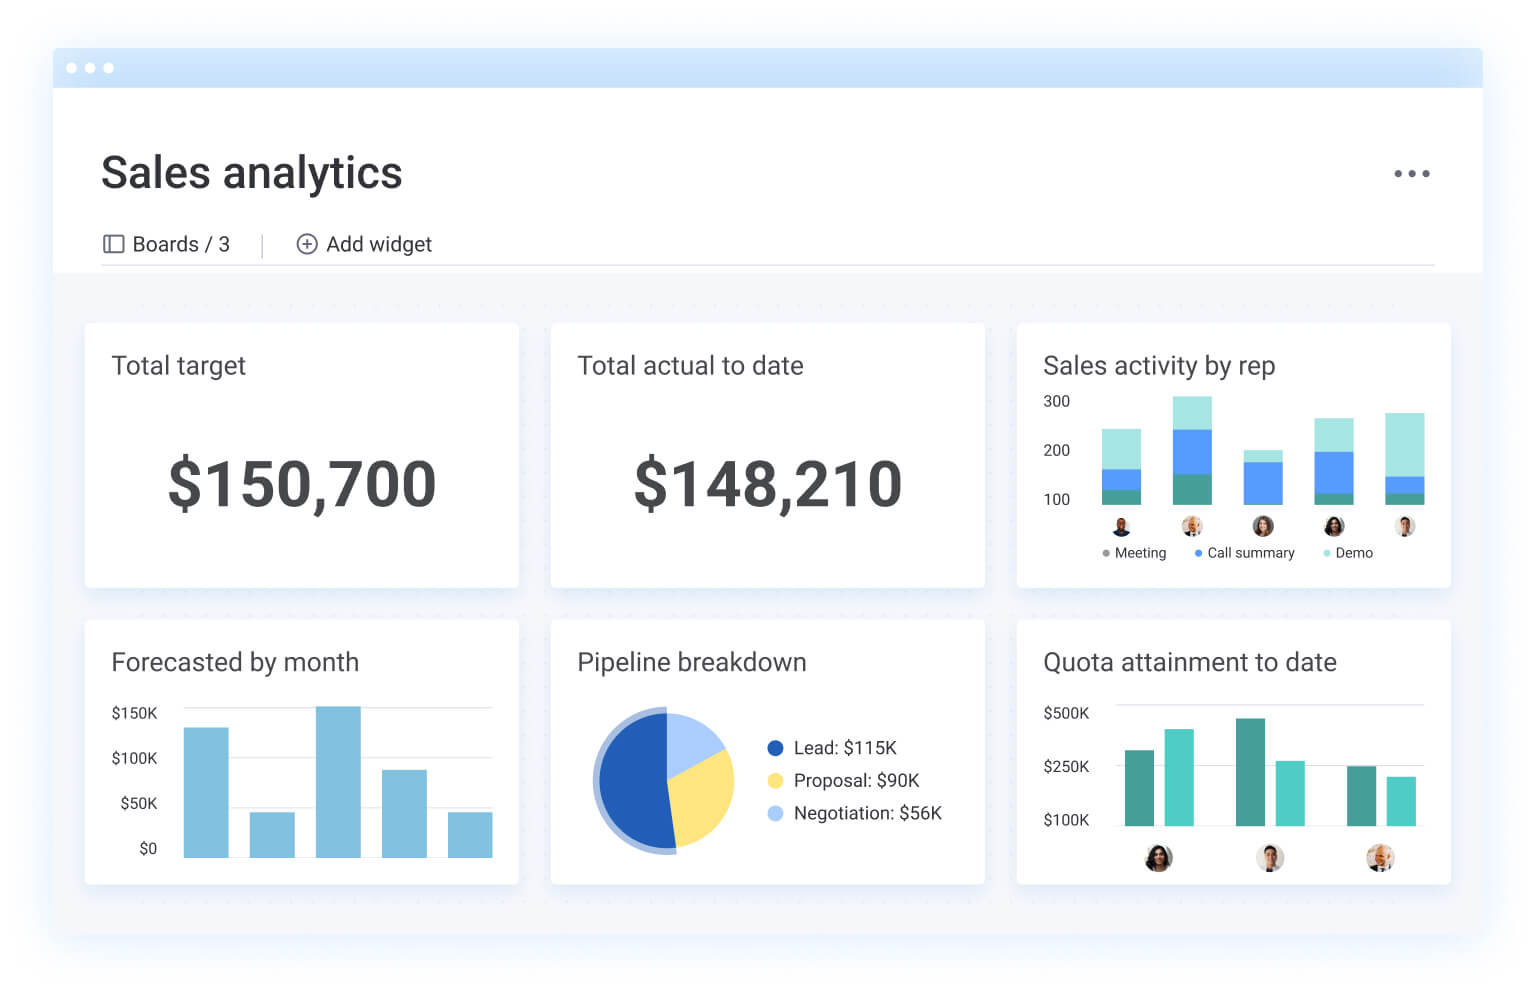
1. Automated retention dashboards
The platform enables teams to establish visibility through real-time metric widgets that display retention rates, churn metrics, and feature adoption. Since these widgets update automatically as new data flows into the system, leadership maintains an always-current view of performance. Additionally, dashboards can be customized by role:
- Executives: monitor high-level retention trends and their direct revenue impact.
- Sales managers: track team-specific performance and identify at-risk accounts.
- Customer success teams: access granular health scores and engagement depth.
This automated data refresh removes the burden of manual reporting; for instance, a customer logging their first deal immediately updates the activation rate calculations across the entire organization.
2. Smart retention alerts
To ensure teams can act on data, the platform features automated alert systems that trigger when metrics cross critical thresholds. These “early warning” notifications allow for intervention before problems become irreversible:
- Churn warning triggers: identify risks automatically, such as a customer whose usage declines by 40% in a two-week period or a user who has been inactive for 14 days.
- Metric threshold alerts: notify stakeholders immediately if monthly retention drops below a set target or if MRR retention declines significantly.
- Automated workflow assignment: translate alerts into action by automatically assigning at-risk customers to success representatives based on territory, account ownership, or contract value.
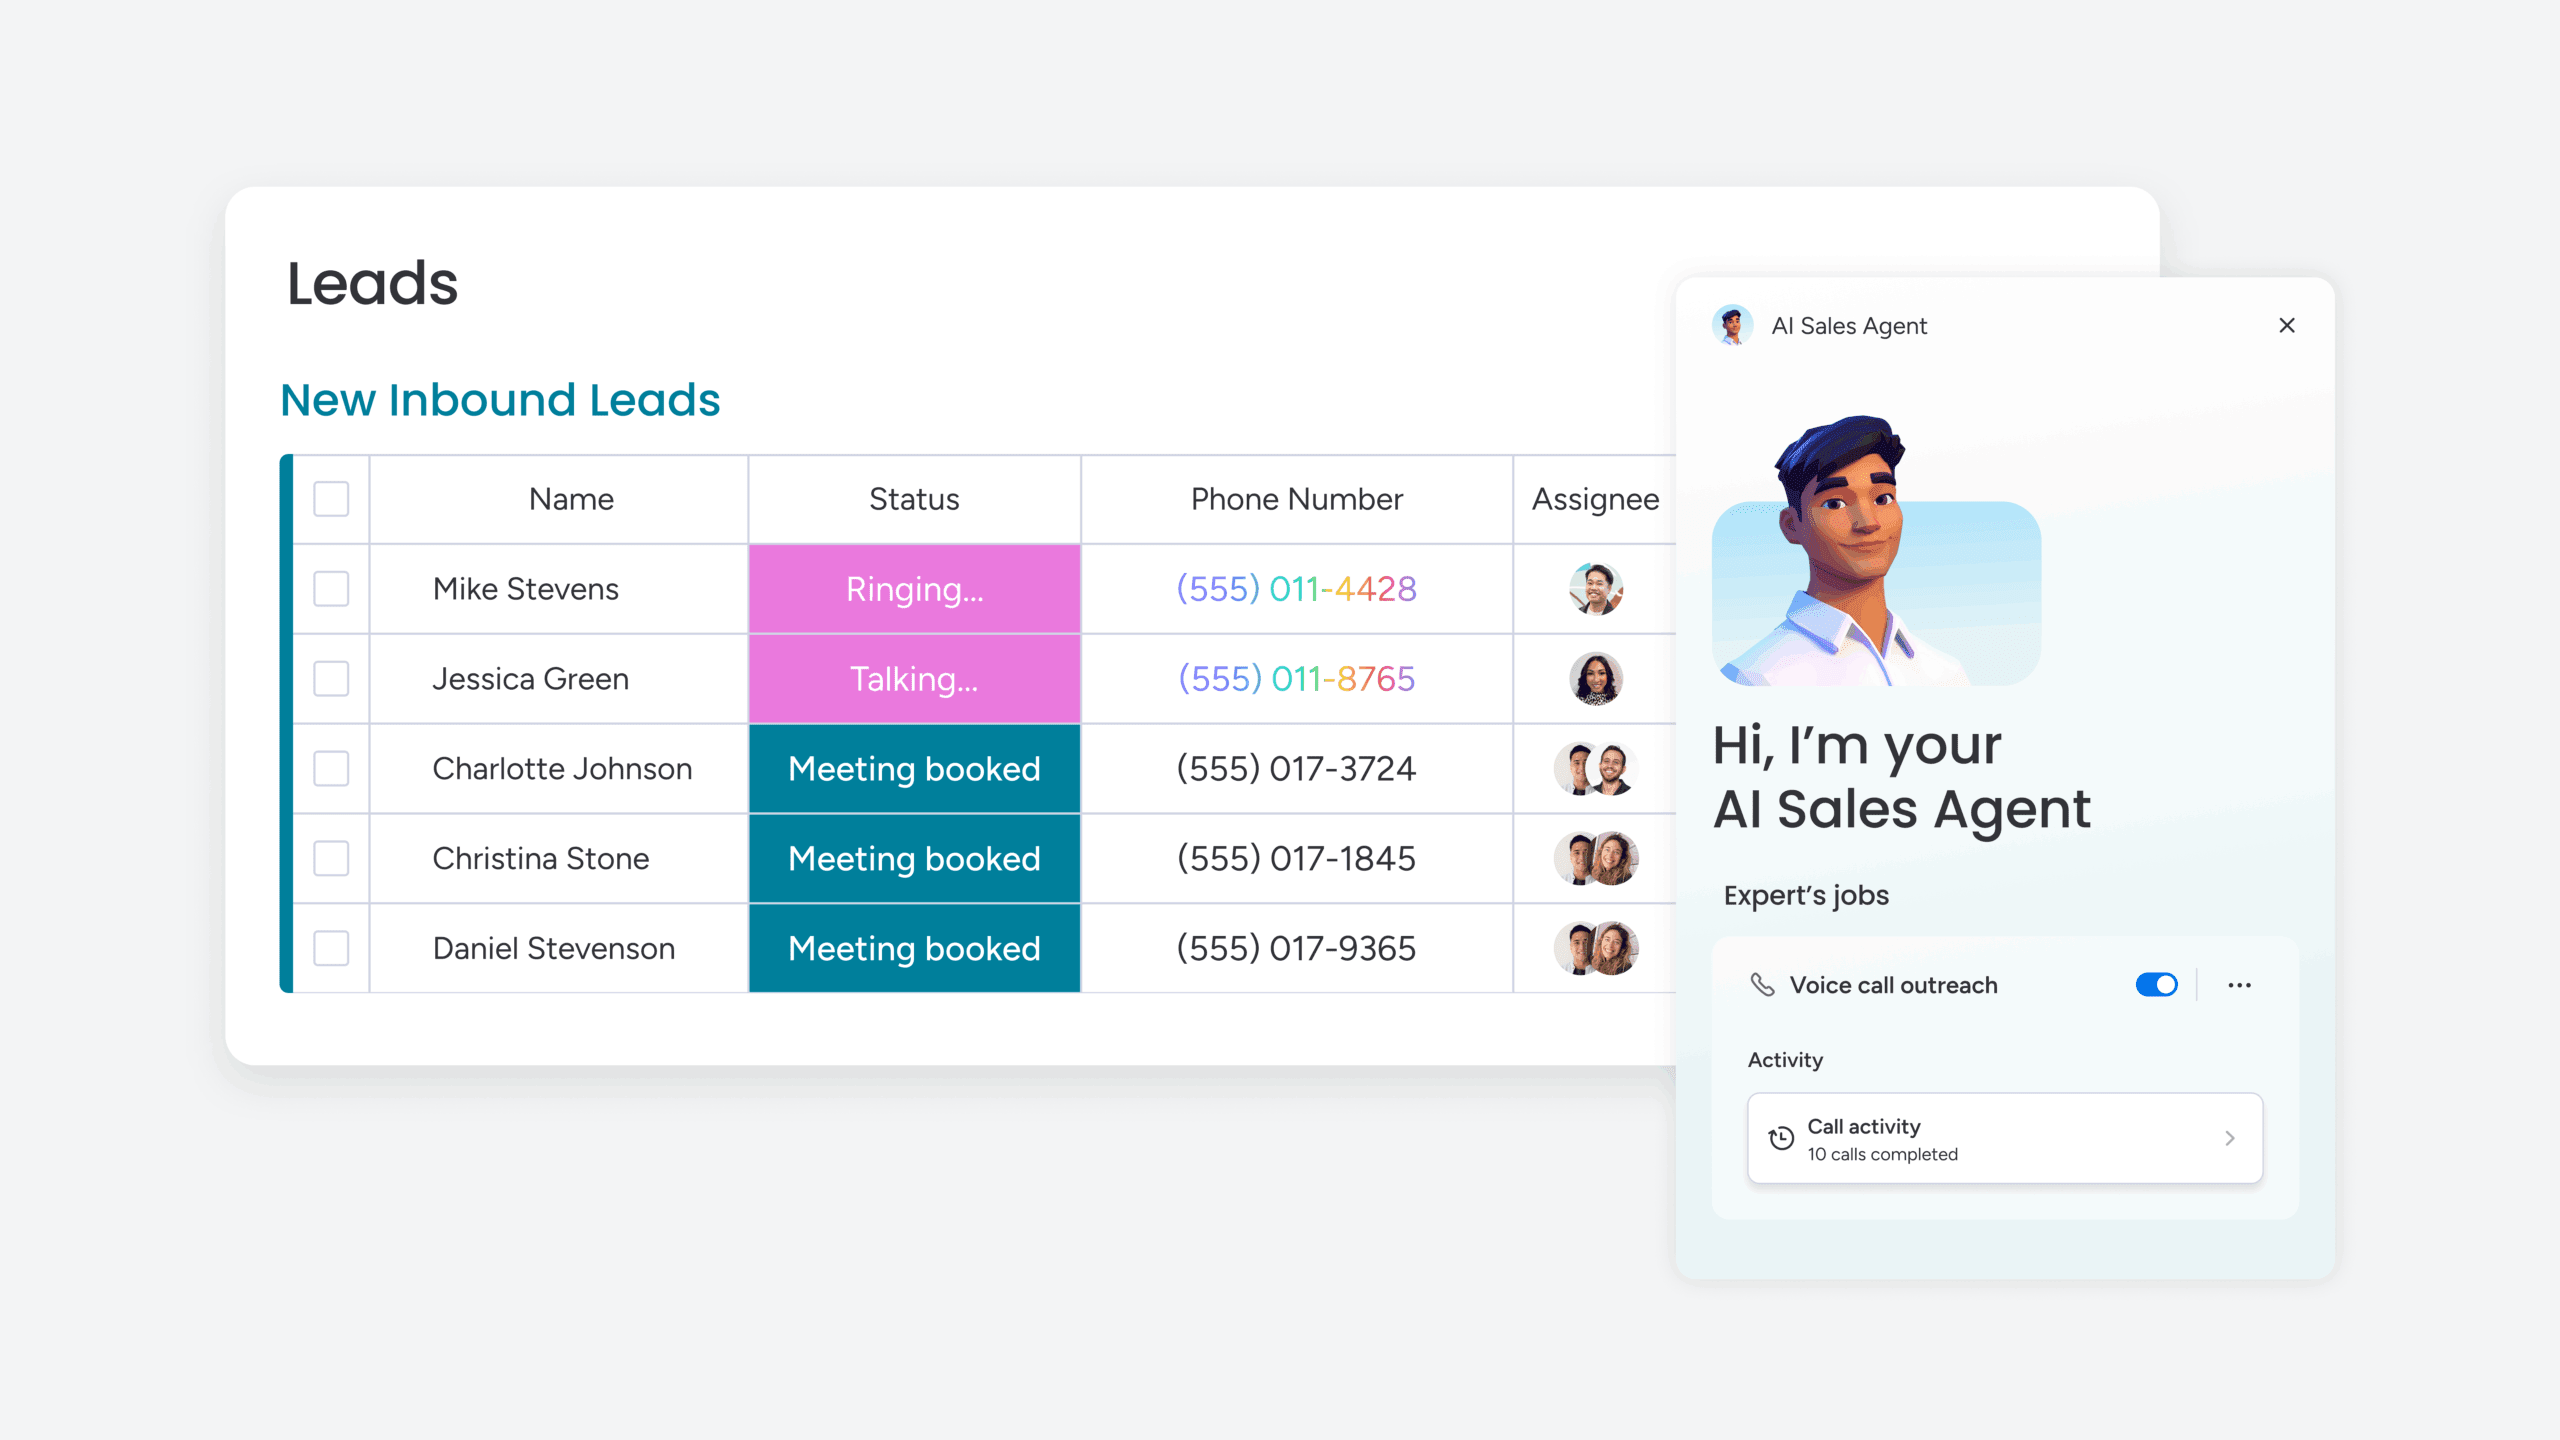
3. AI for retention insights
Beyond manual tracking, monday CRM uses integrated AI to detect patterns that human analysis might miss. By analyzing customer communications, the AI identifies retention risks and summarizes interactions:
- Timeline summary: creates clear summaries of all communication events, including emails, calls, meetings, and notes. Sales and support teams can instantly understand customer history, saving valuable time.
- Sentiment detection: flags negative or at-risk language in customer communication. When AI spots concerning patterns in emails, it alerts your team before customers decide to leave.
- Automated email composition: helps teams respond quickly to at-risk customers. AI drafts personalized re-engagement emails based on customer history and interaction patterns.
4. Unified sales and success data
The platform’s integrated timeline displays every customer interaction chronologically, from the first sales call to the latest support ticket. This alignment bridges the gap between departments and provides several cross-team benefits:
- Closing the feedback loop: customer success managers can see the original sales promises to ensure expectations are met.
- Proactive renewals: sales reps can view support issues that might complicate upcoming renewal conversations.
- Contextual collaboration: teams can @mention colleagues directly within the customer record to resolve risks or share feature updates.
Build your retention measurement strategy
Attempting to track all ten metrics simultaneously often leads to complexity overload. Instead, a more effective approach is to start small and scale gradually. By focusing first on the basics that align with your immediate goals and available data, you can build your “tracking muscles” as your team’s expertise and systems become more sophisticated.
To ensure a successful rollout, consider your current business stage:
- For new businesses: begin with basic retention rate and churn rate to establish baseline measurements. These metrics require minimal setup — simply tracking how many customers remain active month over month.
- For growing businesses: add customer lifetime value and activation rate to optimize acquisition and onboarding investments. CLV determines appropriate customer acquisition spending, while the activation rate reveals whether new customers experience value quickly enough.
- For mature businesses: implement predictive retention scores and advanced segmentation for proactive management. Historical data enables sophisticated prediction models that identify at-risk customers before they churn.
Build your retention measurement program incrementally:
- Choose 2-3 core metrics: aligned with immediate goals.
- Establish baseline measurements: using existing data.
- Set achievable improvement targets: to create momentum.
- Review metrics regularly: on consistent schedules.
- Add sophisticated metrics gradually: as capabilities mature.
The key is to prioritize metrics you can act on immediately. Teams that try to implement a full-scale measurement program overnight often abandon their efforts; those that build incrementally create a lasting culture of data-driven growth.
The content in this article is provided for informational purposes only and, to the best of monday.com’s knowledge, the information provided in this article is accurate and up-to-date at the time of publication. That said, monday.com encourages readers to verify all information directly.
Frequently asked questions
How often should I measure customer retention rate?
Customer retention measurement frequency depends on your business model and customer lifecycle. Subscription businesses benefit from monthly measurement for timely insights, while transactional businesses might measure quarterly or annually based on typical purchase cycles.
What's the difference between gross and net retention?
Gross retention measures the percentage of customers or revenue retained excluding any expansion, while net retention includes expansion revenue from existing customers. Net retention can exceed 100% when expansion revenue surpasses churn losses.
Which retention metrics matter most for SaaS businesses?
Net revenue retention, monthly recurring revenue retention, and customer lifetime value represent the most critical SaaS retention metrics. These measurements directly connect to recurring revenue models and predict sustainable growth patterns.
How do I calculate retention for different customer segments?
Apply the same retention formulas to specific customer groups rather than your entire customer base. This segmented approach reveals which customer types have the highest retention rates and lifetime value.
What's considered a good customer retention rate?
Good retention rates vary significantly by industry. SaaS businesses typically target 85-95% annual retention, while e-commerce businesses might consider 20-30% acceptable. Focus on improving your own retention trends rather than comparing to industry benchmarks.
Can I track retention without expensive analytics platforms?
Basic retention tracking starts with simple spreadsheet calculations using customer data exports. Automated platforms become essential as you scale and need real-time insights, with many CRM platforms including retention analytics as standard features.