
Your sales team just closed a $100K deal. Finance says revenue for the quarter is only up $8K. Both numbers are right, but the disconnect creates confusion across departments and makes it harder to forecast, plan, and align on what’s actually driving business growth.This gap between sales and revenue isn’t a reporting error. It’s how businesses operate. Sales captures what gets sold, while revenue reflects what gets recognized according to accounting rules and timing. Understanding the difference helps teams track the right metrics, set realistic expectations, and make decisions with the full story.
Here’s what sales revenue and total revenue actually measure, why the numbers rarely match, and how to calculate both metrics accurately. You’ll see practical examples for decision-making and discover how a unified tracking system can give your team visibility into both sales performance and overall business health with tools like monday CRM.
Key takeaways
- Track both sales and total revenue to make smarter decisions. Sales revenue shows team performance while total revenue reveals complete business health. You need both for accurate planning and forecasting.
- Expect timing differences between sales bookings and recognized revenue. A $60K annual contract booked in March only shows $2.5K in Q1 revenue, with the rest recognized monthly over time.
- Focus on net sales instead of gross bookings for real performance. Net sales removes returns and discounts to show what you actually keep.
- Use monday CRM’s custom fields and automations to track revenue recognition. Set up automated calculations for deferred revenue, recognition schedules, and real-time dashboards that connect sales activity to financial outcomes.
- Reconcile sales and revenue numbers monthly to catch discrepancies early. Regular cross-team reviews ensure everyone uses the same definitions and prevents confusion when numbers don’t match.
What is sales revenue?

Sales revenue is the income your business generates from selling products or services to customers. This is money that comes in because someone bought what you’re selling.
The calculation works like this: multiply units sold by price per unit. If you sell 100 software licenses at $500 each, your sales revenue is $50,000. For service businesses, multiply customers acquired by average contract value. Ten consulting engagements at $15,000 each equals $150,000 in sales revenue.
Sales revenue captures the following specific income types from direct customer transactions:
- Product sales: Physical goods, software licenses, or any tangible items customers purchase
- Service fees: Consulting, implementation, support, or services tied to sales transactions
- Subscription payments: Initial and recurring payments for product or service access
Sales revenue excludes other income sources. Interest on cash reserves, investment returns, rental income from property, and licensing fees from intellectual property don’t count as sales revenue. These income streams aren’t part of your core selling activities.
The term “top-line revenue” often refers to total revenue, but sales revenue typically makes up the largest chunk. When executives talk about “growing the top line,” they’re usually focused on increasing sales revenue since it directly reflects market demand and sales team performance.
What is total revenue?
Total revenue is the complete sum of all income streams your business generates. The formula: total revenue equals sales revenue plus all other revenue sources.
For businesses with diversified income, the gap between sales revenue and total revenue can hit 20% or more. A software company might generate $2M in sales revenue from new customers, plus $300K in interest from cash reserves, $150K from licensing their API to partners, and $50K from subleasing office space. Total revenue: $2.5M.
Non-sales revenue streams look different for every business. Here’s how additional income sources add to total revenue:
| Revenue stream | Description | Example |
|---|---|---|
| Interest income | Money earned from business savings accounts, CDs, or investments | $50K annually from high-yield business savings |
| Rental income | Revenue from leasing property, equipment, or assets you own | $30K/year from subleasing warehouse space |
| Licensing fees | Income from allowing others to use intellectual property or technology | $100K from licensing a proprietary algorithm |
| Investment returns | Gains from stock portfolios, bonds, or financial instruments | $75K from corporate investment portfolio |
| Partnership revenue | Referral fees, revenue-sharing arrangements, or co-marketing income | $25K from affiliate partner program |
Total revenue appears on income statements and financial reports. Investors, board members, and analysts use this number to assess overall business health. Total revenue shows how your entire business generates income, not just how well your sales team performs.
Revenue vs sales: Key differences
Sales refers to income from selling products or services to customers, while revenue encompasses all income sources including sales, interest, investments, and other streams. Sales is always a subset of total revenue. This distinction changes how you measure performance, forecast growth, and decide where to invest.
| Dimension | Sales revenue | Total revenue |
|---|---|---|
| Scope | Income from product/service sales only | All income sources combined |
| Components | Product sales, service fees, subscriptions | Sales plus interest, investments, licensing, other income |
| Team ownership | Sales and business development teams | Finance and executive leadership |
| Reporting frequency | Often tracked daily or weekly | Typically reported monthly or quarterly |
| Strategic use | Measures sales team performance and pipeline health | Measures overall business financial health |
| Forecasting role | Informs hiring, capacity planning, quota setting | Guides business strategy and cash management |
Sales teams focus on sales revenue to measure their effectiveness—quota attainment, pipeline conversion, and deal velocity all tie back to this metric. Finance teams track total revenue for accurate financial reporting, compliance, and investor relations. A CFO can’t ignore $200K in licensing income just because it didn’t come from the sales team.
Executives need both metrics to understand which growth levers work. If sales revenue stays flat but total revenue grows, you’re generating more income from non-sales sources, signaling either strategic diversification or sales performance issues needing attention.
Why sales and revenue numbers don't match
Even when sales represent 90% or more of total revenue, the numbers rarely match exactly. This isn’t a problem; it’s a reality to understand. Timing differences, adjustments, and recognition rules create natural divergence between what sales teams report and what finance records as revenue.
Three factors create this gap between sales and revenue numbers. Know these factors and you’ll avoid confusion when the numbers don’t match.
Returns and discounts impact
A gap exists between gross sales (what was initially sold) and net sales (what the business actually keeps), which is calculated as:
Net Sales = Gross Sales – Returns – Discounts – Allowances
Consider a quarter where your team books $100K in sales:
- Customers return $5K worth of products
- You offered $3K in early-payment discounts
- You provided $2K in allowances for damaged goods
- Net sales revenue: $90K
Sales teams celebrate gross bookings while finance reports net revenue. This looks like a discrepancy, but it’s just two teams measuring different things. Neither is wrong; they’re answering different questions.
High return rates or heavy discounting usually mean something’s wrong:
- Returns exceeding 5%: May indicate product quality problems or misaligned customer expectations
- Discounts eating 10% or more: Pricing strategy or sales incentives may need adjustment
Timing of revenue recognition
You recognize revenue when it’s earned, not when cash arrives or when a sale books. This timing difference creates the biggest gap between sales reports and revenue reports.
Consider a $60K annual contract signed on March 15th. Sales reports a $60K win for Q1. Finance recognizes only $2.5K in Q1 revenue (covering March 15-31), with the remaining $57.5K spread across future periods.
Here’s how timing changes what shows up in revenue reports:
- Upfront payment for future services: Customer pays $12K for annual subscription in January; revenue recognized at $1K monthly over 12 months
- Milestone-based recognition: Consulting project sold in Q1 may have revenue recognized across Q2 and Q3 as deliverables complete
- Multi-year contracts: Three-year software deal booked today gets recognized over 36 months
Revenue recognition rules like ASC 606 govern when revenue can be officially recorded. These standards ensure financial statements accurately reflect when value was delivered to customers.
Multiple revenue streams beyond sales
Businesses generate income from sources that sales teams don’t control or track. These streams can be significant, especially for mature companies with substantial assets or intellectual property.
A manufacturing company might generate $5M in product sales revenue, plus earn $200K from selling an old warehouse, $150K in interest from cash reserves, and $100K from licensing their manufacturing process. Total revenue: $5.45M, which is 9% higher than sales revenue alone.
While these streams traditionally live outside your CRM, using the right platform can help you track all revenue sources in one place. monday CRM lets you create custom fields and boards to monitor non-sales revenue alongside your core sales metrics, giving you a complete picture of business performance. This unified view helps leadership teams understand which revenue streams drive growth and make smarter strategic decisions about resource allocation.
Try monday CRMHow to calculate sales vs revenue
Both metrics use straightforward formulas. The trick is knowing what to include and what to leave out. The math is simple, but the hard part is staying consistent. Here’s how to calculate each metric and track the right numbers.
Step 1: Calculate sales revenue using your business model
Your business model determines which formula to use. For product businesses: Sales Revenue = Number of Units Sold × Price Per Unit. For service and SaaS businesses: Sales Revenue = Number of Customers × Average Contract Value.
| Business type | Calculation | Sales revenue |
|---|---|---|
| E-commerce | 500 products × $80 average price | $40,000 |
| SaaS | 25 new customers × $12,000 ACV | $300,000 |
| Consulting | 10 projects × $15,000 average fee | $150,000 |
| Manufacturing | 1,000 units × $250 per unit | $250,000 |
Sales teams typically track this gross sales figure. It shows the total value of sales transactions before returns, discounts, or revenue recognition timing adjustments.
Step 2: Calculate total revenue by aggregating all income sources
The comprehensive formula aggregates all income sources: Total Revenue = Sales Revenue + Interest Income + Investment Returns + Licensing Fees + Rental Income + Other Income.
Break down each revenue stream:
| Revenue stream | Amount |
|---|---|
| Sales revenue | $500,000 |
| Interest income | $8,000 |
| Licensing fees | $15,000 |
| Equipment rental | $5,000 |
| Total revenue | $528,000 |
You’ll see this total revenue figure on income statements and financial reports. This is the number investors care about, and the one that matters for taxes and valuation.
Step 3: Distinguish between net and gross sales
The distinction between gross and net sales matters when you’re measuring real performance. Gross Sales equals total value of all sales transactions before deductions. Net Sales equals Gross Sales minus Returns, Discounts, and Allowances.
| Line item | Amount |
|---|---|
| Gross sales | $100,000 |
| Product returns | -$4,000 |
| Early payment discounts | -$2,000 |
| Damaged goods allowances | -$1,000 |
| Net sales | $93,000 |
Net sales shows what you actually keep from sales activities. Finance teams report net sales, while sales teams celebrate gross bookings. Both numbers matter, just for different reasons.
Which metric drives stronger business decisions?
Which metric you use depends on the decision you’re making and who’s making it. Smart revenue teams don’t choose one over the other. They understand how both metrics work together and use each one where it fits.
For sales performance and compensation, use net sales revenue. It shows sales team effectiveness and customer acquisition without inflating numbers with returns or heavy discounts. Understanding sales KPIs helps teams align on the metrics that matter most for performance evaluation.
For financial health and investor reporting, total revenue tells the full story. Financial statements require capturing all income sources, and investors evaluate businesses on total revenue generation, not just sales performance.
| Decision type | Appropriate metric | Rationale |
|---|---|---|
| Evaluating sales team performance | Net sales revenue | Directly reflects sales effectiveness |
| Assessing overall profitability | Total revenue | Captures all income sources |
| Planning sales compensation | Net sales revenue | Aligns incentives with actual business impact |
| Reporting to investors or board | Total revenue | Required for accurate financial reporting |
| Forecasting cash flow | Both metrics | Sales drives future revenue; total revenue shows current income |
Revenue teams that track both metrics make stronger decisions than those who only watch one. When teams define who owns each metric and what it means, they can make smarter choices about resources, growth, and performance.
Track revenue and sales with monday CRM

With monday CRM, you can track both sales and revenue metrics in one place. Revenue teams get one system that shows how sales activity converts to recognized revenue, creating a single source of truth that connects sales activity directly to financial outcomes. Here’s how to build a unified system that provides a complete view of your revenue health.
AI-powered revenue insights
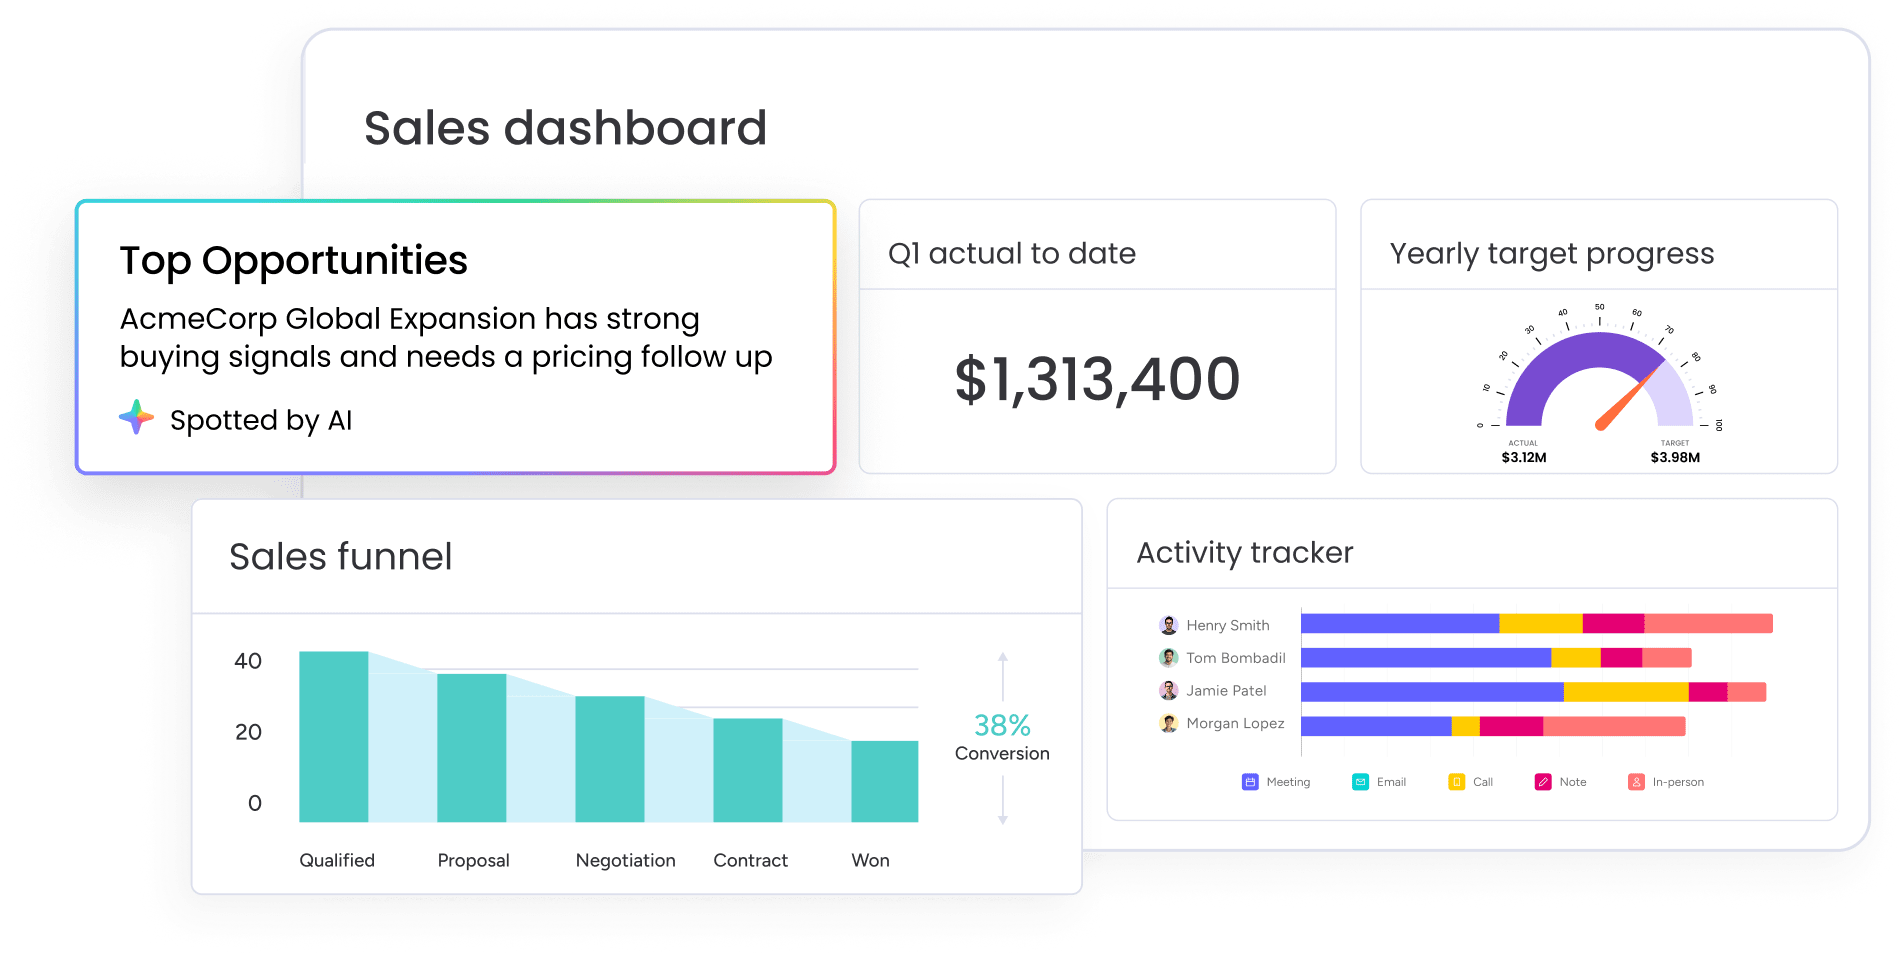
AI features analyze patterns in sales and revenue data to provide sales analytics that help you understand the gap between bookings and recognized revenue. The platform supports sales forecasting, identifies deals with recognition risks, and predicts future revenue based on current pipeline.
AI capabilities include:
- Summarizing the emails & activities timeline: Extract key revenue-related information from customer communications
- Extracting information from contracts and invoices: Automatically populate revenue fields with contract terms, payment schedules, and recognition dates
- Autofilling revenue-related fields: Reduce manual data entry by letting AI populate deferred revenue amounts and recognition periods
- Predicting revenue recognition patterns: Learn from historical deals to forecast when booked sales will convert to recognized revenue
The AI learns from past deals and applies those patterns to your current pipeline, which means forecasts get more accurate over time. This helps finance teams anticipate revenue timing and sales teams understand how deal structure affects revenue recognition.
Custom revenue tracking fields
Teams can create custom fields to track revenue data beyond standard sales fields. These include deferred revenue amounts, revenue recognition schedules, contract terms affecting recognition, and multiple revenue stream categories.
Add custom columns to CRM boards to capture revenue-specific information:
- Revenue recognition start date: When revenue begins to be recognized
- Recognition period: Duration over which revenue spreads
- Deferred revenue balance: Amount yet to be recognized
- Revenue stream type: Category of income source
- Monthly recognition amount: Calculated monthly revenue portion
These fields use formulas to calculate values automatically, which means less manual work and more consistency across your revenue tracking. For teams managing complex sales pipeline management, custom fields ensure every deal includes the revenue data you need for accurate forecasting.
Automated revenue recognition
Automations calculate and update revenue recognition based on contract terms. Automations trigger notifications when revenue should be recognized and update deferred revenue balances automatically.
Set up automations that trigger based on dates, status changes, or conditions:
- Update multiple fields simultaneously: Ensure all revenue-related data stays current
- Send notifications to finance teams: Alert when recognition events occur
- Create records in connected financial systems: Maintain data consistency across platforms
Automations work alongside AI features to reduce manual tracking and ensure revenue recognition happens on schedule without constant oversight. This is especially valuable for account management teams tracking recurring revenue from existing customers.
Real-time revenue dashboards
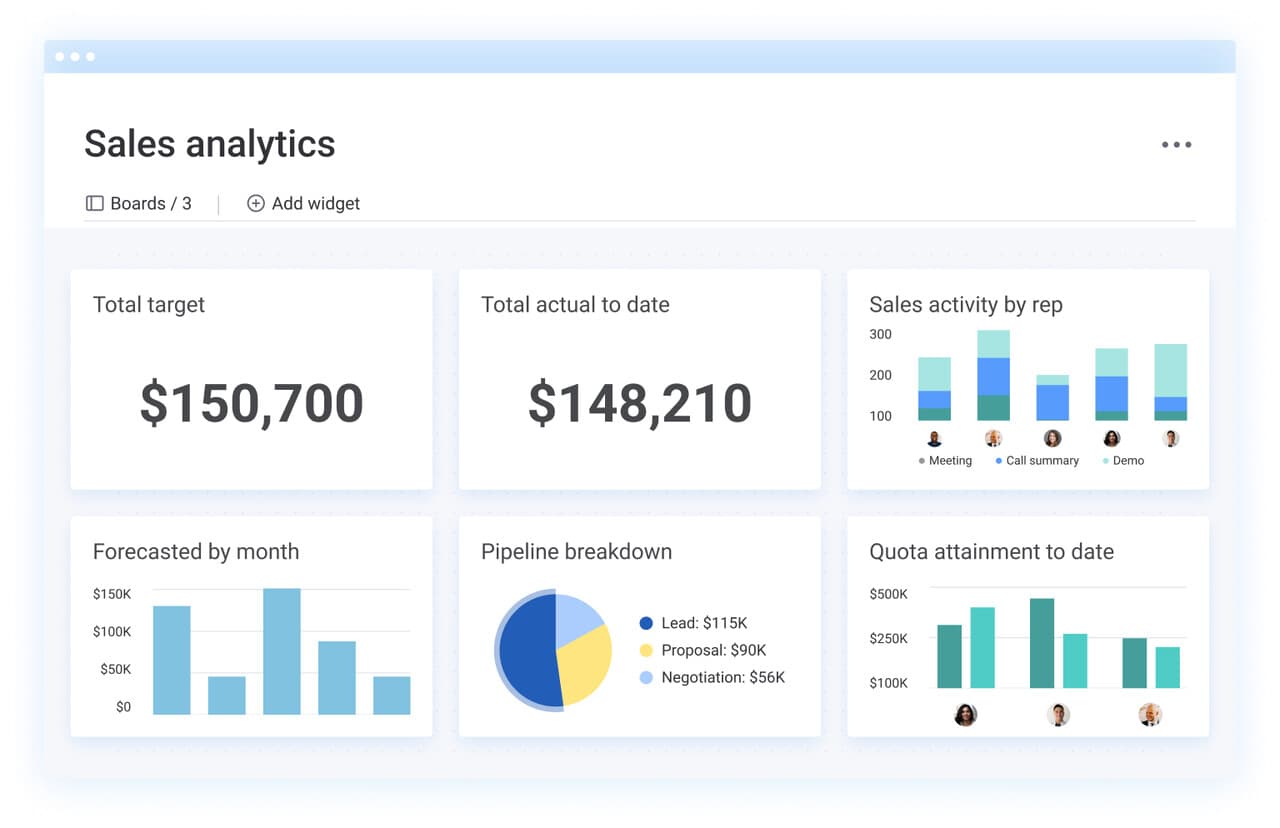
Customizable sales dashboards display both sales and revenue metrics in real-time. Drill down from high-level summaries to individual deals.
Build dashboards showing:
- Bookings vs recognized revenue: Compare by period to see timing differences
- Deferred revenue balance: Track by sales rep to understand future revenue
- Sales-to-revenue conversion: Analyze rates by deal type or customer segment
- AI-generated revenue forecasts: View predicted revenue recognition based on current pipeline and historical patterns
“With monday CRM, we’re finally able to adapt the platform to our needs — not the other way around. It gives us the flexibility to work smarter, cut costs, save time, and scale with confidence.”
Samuel Lobao | Contract Administrator & Special Projects, Strategix“Now we have a lot less data, but it’s quality data. That change allows us to use AI confidently, without second-guessing the outputs.”
Elizabeth Gerbel | CEO“Without monday CRM, we’d be chasing updates and fixing errors. Now we’re focused on growing the program — not just keeping up with it."
Quentin Williams | Head of Dropship, Freedom Furniture“There’s probably about a 70% increase in efficiency in regards to the admin tasks that were removed and automated, which is a huge win for us.“
Kyle Dorman | Department Manager - Operations, Ray White"monday CRM helps us make sure the right people have immediate visibility into the information they need so we're not wasting time."
Luca Pope | Global Client Solutions Manager at Black Mountain“In a couple of weeks, all of the team members were using monday CRM fully. The automations and the many integrations, make monday CRM the best CRM in the market right now.”
Nuno Godinho | CIO at Velv
“monday.com provides developmental flexibility, operational efficiency, and data transparency — all in one place. We became a company that moved from chasing data to leading with it.”
Hyunghan Lee | Team Lead, Sandbox Network
"monday.com brought every part of our business into one connected space. The harmony between work management and CRM has become our operating system — giving us the clarity and confidence to scale.”
Jennifer Chinburg | Executive Vice President of Corporate Development & Brand, Chinburg Properties
“We just weren’t getting value from our old CRM. With monday.com, it's a thousand times better. Our sales teams are more informed, more consistent, and far more connected."
James Arnold | Chief Operating Officer, CenversaBuild a unified revenue tracking system
Understanding the difference between sales and revenue is the foundation for smart business decisions. Successful revenue teams track both metrics, understand how they relate, and use each one where it fits. Sales revenue measures team performance and market demand, while total revenue measures overall business health. The relationship between them shows how efficiently your business converts sales activity into recognized income.
Accurate tracking needs three things working together: shared definitions, integrated systems, and regular cross-functional reviews. Teams need definitions everyone agrees on to avoid confusion when numbers don’t match. Integrated systems like monday CRM connect sales and revenue data to break down silos, while regular cross-functional reviews ensure alignment and catch gaps before they become major problems.
Try monday CRMFAQs
Is revenue and sales the same thing?
Sales revenue cannot exceed total revenue since sales is a component of total revenue. However, gross sales can temporarily appear higher than recognized revenue due to timing differences. A $100K deal booked today may only show $8K in recognized revenue this month if it's a 12-month subscription.
Is net sales the same as revenue?
Net sales is a component of revenue but not the same as total revenue. Net sales equals gross sales minus returns, discounts, and allowances. Total revenue includes all income sources beyond sales such as interest income, licensing fees, and investment returns.
What is the difference between gross sales and revenue?
Gross sales represents the total value of all sales transactions before any deductions. Revenue, specifically recognized revenue, is what the business has actually earned according to accounting rules. This includes adjustments for returns, discounts, and timing of service delivery.
How do you track deferred revenue from sales?
Track deferred revenue by recording the payment received as a liability on the balance sheet. Then systematically recognize it as revenue over the service delivery period based on contract terms. For example, recognize 1/12 of an annual subscription payment each month.
Which metric should sales teams focus on?
Sales teams should primarily focus on net sales for performance measurement and compensation. Net sales equals bookings minus returns and discounts. Teams should also maintain awareness of how their deals convert to recognized revenue since deal structure and contract terms affect when the business records that income.
How often should teams reconcile sales and revenue numbers?
Teams should reconcile sales and revenue numbers monthly at minimum, with weekly reviews during high-growth periods. This ensures discrepancies are caught early and teams maintain alignment on definitions and calculations across departments.