
While teams often measure success by what they build, the business measures success by the results. This gap between technical output and business impact creates friction, slows down decisions, and makes it difficult to prove the true value of development work. Without a shared language, engineering can feel disconnected from the company’s strategic goals.
Effective engineering metrics bridge this divide. They translate technical activity into a language everyone understands, from developers to the C-suite, creating alignment and proving how engineering drives success. This post covers how to select the right metrics for your team. We will explore the different types of metrics, from development speed to customer satisfaction, and show you how to build dashboards that turn data into action, giving you a single source of truth for engineering success.
By replacing guesswork with clear data, teams can spot bottlenecks, predict delivery more accurately, and connect their efforts directly to business goals. Having these insights in a single, flexible platform gives teams the visibility and control needed to become faster, more aligned, and more confident in their work.
Key takeaways
- Start Simple and Expand: start with three to five metrics that solve your biggest problems, then expand gradually. Too many metrics overwhelm teams and reduce focus.
- Balance speed and quality: balance speed metrics like deployment frequency with quality measures like defect rates. You need both to build sustainable, high-performing teams.
- Connect data to action: Modern solutions like monday dev connect your metrics to action in one platform, giving you real-time visibility across planning, development, and deployment without switching between different systems.
- Focus on actionable metrics: focus on actionable metrics that drive decisions (e.g., cycle time, CSAT), not vanity metrics (e.g., lines of code). If a metric doesn’t help you make choices, drop it.
- Foster a learning culture: use metrics for team learning and improvement, never for blame or punishment. A safe measurement culture drives more impactful results than surveillance approaches.
What are engineering metrics and KPIs
Engineering metrics are quantifiable measurements that track how your development team builds software. They measure everything from code quality to deployment speed, giving you concrete data about your development process.
KPIs (Key Performance Indicators) are the specific metrics that directly connect to your business goals. Think of KPIs as your north star metrics — the ones that actually matter for making strategic decisions.
Understanding the difference between metrics and KPIs
All KPIs are metrics, but not all metrics are KPIs. The difference comes down to business impact and decision-making power. Here’s what separates regular metrics from KPIs:
- Metrics: lines of code, number of commits, meeting hours.
- KPIs: deployment frequency, time to market, customer satisfaction.
Your KPIs should directly influence how you allocate resources and make strategic choices. Regular metrics provide supporting data but don’t drive major decisions.
Why data-driven development matters
Data eliminates guesswork from your development process. When you track the right metrics, you can predict delivery dates, spot problems early, and prove engineering’s value to the business.
Advanced platforms like monday dev give you this visibility without slowing down your team. You get real-time insights across your entire development workflow, helping both engineers and executives make informed decisions.
How engineering team metrics drive success
Engineering metrics transform how teams work by replacing assumptions with facts. They create accountability, drive continuous improvement, and show exactly how technical work impacts business results.
Without metrics, you’re flying blind. With them, you can spot risks before they become crises and prove engineering’s contribution to revenue, supported by AI for software engineering solutions.
Boost team productivity and velocity
Metrics reveal what’s actually slowing your team down. You might think it’s technical debt, but data could show it’s actually too many context switches or unclear requirements.
By tracking cycle time and deployment frequency in monday dev, teams identify and eliminate their biggest productivity killers. This creates compound improvements — small wins that add up to major development velocity gains over time.
Connect engineering efforts to business value
Metrics are essential for proving engineering’s worth, especially during budget discussions, as they bridge the gap between technical work and critical business outcomes:
- Speaking the executive language: showing how your work impacts the bottom line, such as through improved customer satisfaction or reduced defects, is crucial for effective communication with leadership.
- Securing resources: demonstrating this connection, like the McKinsey research showing improved customer satisfaction (60%) and reduced product defects (20-30%) through better developer productivity, secures necessary resources and recognition for your team.
- Proving worth: by quantifying impact, metrics confirm that engineering is directly driving success, transforming the perception of development from a cost center to a value generator.
Spot and fix process bottlenecks fast
Hidden inefficiencies kill productivity. Metrics make these invisible problems visible, turning vague complaints into solvable challenges.
Early detection prevents small issues from becoming major delays. Your team stays on track, and stakeholders maintain confidence in your delivery promises, ultimately streamlining product development.
5 types of metrics for engineering teams
Different Agile metrics serve different purposes. Understanding these categories helps you build a balanced measurement approach that captures the full picture of engineering performance.
Each category provides unique insights that work together to create comprehensive visibility. Balance is key — focusing on just one type creates blind spots.
1. Development speed and efficiency metrics
Speed metrics demonstrate the velocity at which the team transforms ideas into working software. These essential indicators include cycle time, deployment frequency, and lead time for changes.
Dashboards provided by platforms like monday dev track these metrics across multiple teams simultaneously. This allows management to spot which teams excel and which require support, all in real-time.
2. Code quality and reliability metrics
Quality metrics are crucial for ensuring that long-term stability isn’t sacrificed for short-term speed. They track critical indicators such as code coverage, defect rates, and technical debt accumulation.
High-quality code results in fewer emergencies and supports faster future development, helping the team maintain sustainable development practices.
3. Team collaboration and health metrics
Happy, collaborative teams build more reliable and user-centric software. These metrics measure developer satisfaction, knowledge sharing effectiveness, and team communication patterns.
Advanced solutions like monday dev help track these alongside technical metrics. This holistic view ensures you’re building both great products and sustainable teams.
4. Customer impact and satisfaction metrics
Customer metrics ensure you’re building the right things. They track feature adoption, user satisfaction, and the business impact of your releases.
These measurements keep engineering aligned with user needs rather than just completing tickets, which is crucial for Agile software development best practices.
5. Process and workflow metrics
Process metrics evaluate how well your development methodology works. They measure sprint predictability, requirements stability, and workflow efficiency, which are often called Scrum metrics in Agile environments.
Regular process optimization based on these metrics keeps your team running smoothly as you scale, especially when combined with a product prioritization framework to target the most valuable tasks first.
30 essential engineering metrics to track
The metrics outlined below will give you comprehensive visibility into your development process. Choose the ones that align with your current challenges and goals.
Remember, you don’t need to track all 30 at once: start with a few core metrics and expand as you build measurement maturity.
1. Cycle time
The time elapsed from the moment work begins on a task until it is complete. Shorter cycles mean faster feedback and quicker value delivery. (This is frequently ranked as the most useful engineering productivity metric).
2. Lead time for changes
The total time from when code is committed to when it is successfully running in production. This metric indicates how quickly features reach users.
3. Deployment frequency
How often code is successfully released to production. More frequent deployments reduce risk per deployment and accelerate learning.
4. Mean time to recovery (MTTR)
The average time required to fix a production issue or outage. Lower MTTR minimizes the business impact resulting from downtime.
5. Change failure rate
The percentage of deployments that result in a production failure or incident. Low rates indicate stable, reliable release processes.
6. Code coverage
The percentage of the codebase covered by automated tests. Good coverage is essential for catching bugs before they reach production.
7. Technical debt ratio
A measure of the effort or time needed to refactor poor-quality code. Managing this debt is vital for maintaining long-term development velocity.
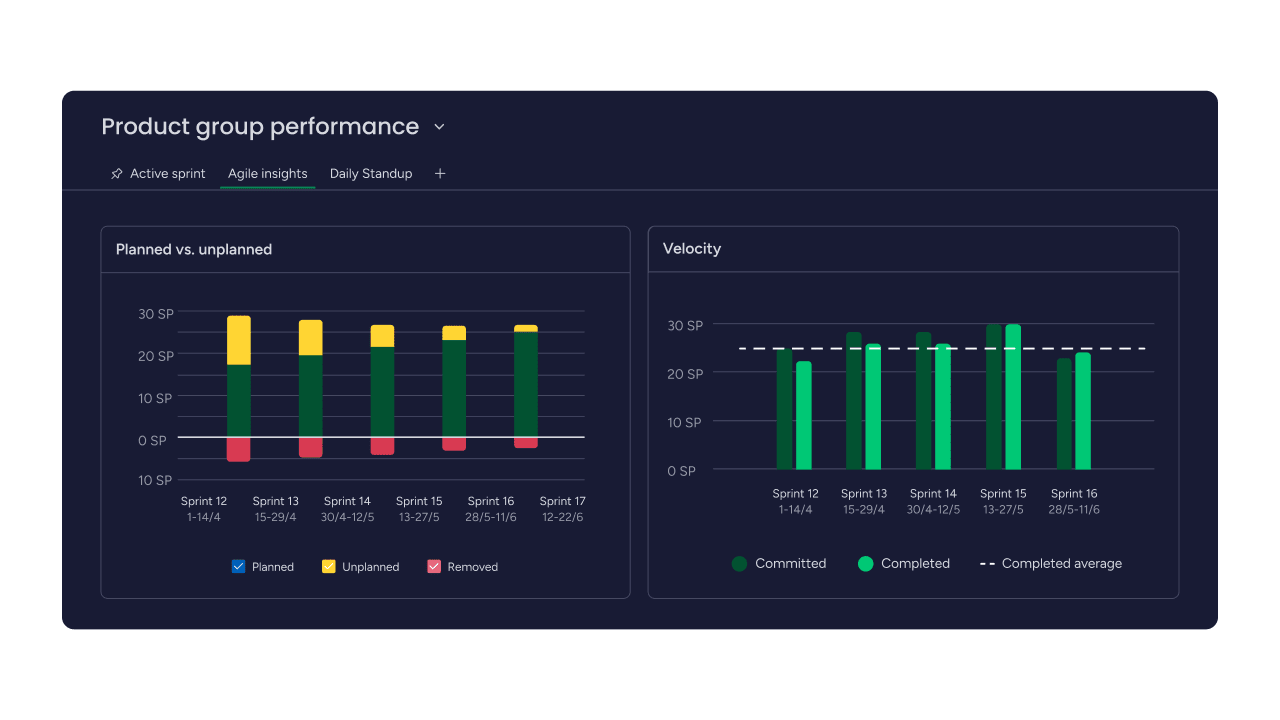
8. Sprint velocity
The total story points completed by the team within a single sprint. Stable velocity is critical for enabling accurate planning and forecasting.
9. Story points delivered
The total story points completed over an extended period. This metric shows the team’s capacity and overall throughput trends.
10. Pull request cycle time
The time elapsed from creating a Pull Request (PR) until it is merged into the main branch. Fast reviews maintain development momentum.
11. Code review velocity
The average number of code reviews completed by a developer weekly. Regular reviews efficiently spread knowledge and uphold quality standards.
12. Merge frequency
How often code is successfully merged into the main development branches. Frequent merges reduce integration conflicts and pain.
13. Defect escape rate
The ratio of bugs found in production compared to those found during testing phases. Lower rates mean highly effective quality assurance processes.
14. Production incident rate
The number of production issues or incidents that occur over a defined period. Declining rates show improving system reliability.
15. Developer experience score
An aggregate measurement of developer satisfaction, typically collected via surveys. Happy developers are generally more productive developers.
16. Team collaboration index
A measure of the effectiveness of team communication and interaction patterns. Strong collaboration consistently drives better outcomes.
17. On-call response time
The speed at which the team responds to critical production alerts. Quick responses minimize service downtime and impact.
18. Feature adoption rate
The percentage of users who utilize new features after their release. High adoption validates development priorities and investment.
19. Build success rate
The percentage of all code builds that complete without errors. High rates signal stable and reliable development practices.
20. Test automation coverage
The ratio of automated tests compared to manual tests. Greater automation accelerates releases and improves consistency.
21. API performance score
Metrics detailing API response times and error rates. Fast APIs are essential for a positive user experience.
22. System availability
The percentage of time the system is operational and accessible (uptime). High availability is necessary to maintain user trust.
23. Resource efficiency rate
A metric assessing how effectively teams utilize their time and resources (e.g., cost per feature). Efficiency maximizes the delivered value.
24. Release predictability
The accuracy of estimated release dates compared to actual delivery dates. Predictability builds crucial stakeholder confidence.
25. Requirements volatility
The frequency or scope of requirement changes during a development cycle. Stability in requirements supports efficient delivery.
26. Knowledge transfer rate
The effectiveness of sharing expertise across the team, often measured by documentation use. Good transfer reduces key person dependencies.
27. Innovation time allocation
The percentage of development time dedicated to new features and R&D versus maintenance and bug fixes. Innovation drives competitive advantage.
28. Security issue resolution time
The speed at which identified security vulnerabilities are fixed. Fast resolution minimizes risk exposure.
29. Cost per deployment
The average expense associated with each software release. Lower costs enable more frequent releases and greater agility.
30. Customer satisfaction score (CSAT)
A direct measurement of user happiness via targeted surveys. High scores validate engineering priorities and the quality of the product.
How to select metrics that matter for your team
Choosing metrics requires balancing what you need to know with what you can realistically track and act on. Start with your biggest pain points.
The best metrics directly connect to actions. If a metric doesn’t help you make decisions, it’s probably not worth tracking.
Align metrics with team objectives
Every metric should support a specific goal. Ask yourself: Will this measurement help us achieve our objectives? Can we actually influence this number?
Flexible platforms offer customizable dashboards that allow you to adjust metrics as priorities shift. For instance, solutions like monday dev ensure you are not locked into tracking the same things forever, supporting adaptability as team objectives evolve.
Balance speed and quality indicators
Speed without quality leads to technical debt. Quality without speed loses market opportunities. You need both.
Track deployment frequency alongside defect rates. Monitor cycle time while watching code coverage. This balance ensures sustainable performance.
Skip the vanity metrics trap
Vanity metrics look impressive but don’t drive improvements. They’re the empty calories of engineering measurement.
To make data-driven decisions, you must focus on metrics that lead to clear actions. Here is how to distinguish between vanity and actionable metrics:
- Vanity: lines of code, commit count, hours worked.
- Actionable: cycle time, customer satisfaction, deployment frequency.
If a metric doesn’t help you make decisions, drop it.
How to create your engineering metrics dashboard
Great dashboards turn data into decisions. They show the right information to the right people at the right time.
Design your dashboards for specific audiences. What helps a developer differs from what a VP needs to see.
Design dashboards for different stakeholders
Different roles need different views of the same data. Tailor your dashboards to support each group’s decisions and learn more in engineering management vs. project management.
| Stakeholder | Key focus | Preferred metrics |
|---|---|---|
| Developers | Daily workflow | Cycle time, PR reviews, build success |
| Engineering managers | Team health | Velocity, defects, satisfaction |
| Leadership | Business impact | Deployment frequency, CSAT, costs |
Mix real-time and trend analytics
Real-time data helps with immediate decisions. Trends guide strategic planning. You need both perspectives.
Use real-time metrics for daily standups and incident response. Review trends in sprint retrospectives and quarterly planning sessions.
Turn data into actionable insights
Raw numbers are not the same as insights. To make data meaningful, you must add context, comparisons, and recommendations.
Analytics within platforms like monday dev help teams move beyond just knowing “what happened” to determining “what should we do about it.” This crucial transformation makes metrics truly valuable and supports product differentiation by demonstrating unique technical advantages.
Try monday dev
How to roll out engineering metrics successfully
Implementing metrics is more about culture than technology. Focus on adoption and value, not just data collection.
Start small, prove value, then expand. This approach builds trust and ensures sustainable measurement practices. If you’re looking to prioritize features effectively, a kano model template can help align user satisfaction with development decisions.
Step 1: set clear measurement goals
Define what success looks like before choosing metrics. What problems are you trying to solve? What decisions do you need to make?
Clear goals prevent metric sprawl and keep everyone aligned on why you’re measuring.
Step 2: start simple and expand gradually
Pick three to five metrics that address your biggest challenges. Master these before adding more.
Early wins build confidence and demonstrate value. Teams that start simple achieve higher long-term adoption.
Step 3: ensure accurate data collection
Bad data destroys trust faster than no data. It is essential to invest in automated collection methods that minimize errors.
Integrations offered by platforms like monday dev pull data directly from your development platforms. This automation ensures consistency and saves time for your team.
Step 4: make metrics visible to everyone
Transparency drives improvement. When everyone sees the numbers, everyone contributes to making them better.
Public dashboards create shared accountability without feeling like surveillance.
Step 5: foster a learning culture
Use metrics for improvement, not punishment. Celebrate progress and treat setbacks as learning opportunities.
Safe environments encourage honest discussions about what’s working and what isn’t.
Step 6: prevent metric manipulation
Multiple complementary metrics prevent gaming. You can’t optimize one number at the expense of others.
Regular reviews ensure metrics stay relevant and resist manipulation attempts.
Step 7: iterate based on feedback
Your metrics program should evolve with your team. What matters today might not matter next quarter.
Regular retrospectives on the metrics themselves keep your measurement approach fresh and valuable.
Transform your engineering metrics with monday dev
Engineering metrics only create value when they drive action. monday dev connects measurement to execution in one unified platform, giving you the tools to track, analyze, and act on your data without friction.
Track metrics, identify improvements, and implement changes without switching contexts. This integration turns insights into results, helping your team move faster and make smarter decisions.
Key capabilities that set monday dev apart:
- Unified visibility: see everything from planning to deployment in one place, with real-time updates across sprints, backlogs, and releases.
- Custom dashboards: create role-specific views that surface relevant insights, from developer-focused cycle times to executive-level business impact metrics.
- Real-time collaboration: share data and decisions across engineering and business teams with built-in communication tools that keep everyone aligned.
- Flexible workflows: adapt to any methodology—Scrum, Kanban, or hybrid—while maintaining measurement consistency across teams.
- Seamless integrations: connect existing platforms like GitHub, GitLab, Jira, and Bitbucket for automated data collection that eliminates manual tracking.
- Sprint management: plan, track, and retrospect on sprints with built-in velocity tracking, burndown charts, and capacity planning.
- Bug and issue tracking: capture, prioritize, and resolve defects with full visibility into resolution times and defect escape rates.
- Engineering roadmap planning: visualize your product roadmap alongside metrics to ensure development priorities align with strategic goals.
- Automated reporting: generate stakeholder reports automatically, saving hours of manual work while keeping leadership informed.
- AI-powered insights: leverage AI to identify patterns, predict bottlenecks, and recommend process improvements based on your team’s data.
These features support what matters most: team ownership, cross-functional alignment, and management visibility without micromanagement. Platforms like monday dev provide the complete toolkit necessary to measure what matters and act on what the team learns.
Ready to transform how your team uses engineering metrics?
Frequently asked questions
What is the difference between engineering metrics and KPIs?
The difference between engineering metrics and KPIs is that engineering metrics are any measurable data points from your development process, while KPIs are the specific metrics that align with business goals and drive strategic decisions. All KPIs are metrics, but only metrics that influence major decisions qualify as KPIs.
How many engineering metrics should a team track?
Teams should start with three to five core metrics addressing their biggest challenges, then gradually expand as they build measurement maturity. Too many metrics overwhelm teams, while too few might miss critical insights.
Can tracking engineering metrics negatively impact team culture?
Metrics harm culture when used for blame or micromanagement but support healthy culture when focused on learning and collective improvement. The key is creating psychological safety around measurement and emphasizing process optimization over individual evaluation.
How frequently should engineering teams review their metrics?
Review operational metrics like build success daily or weekly for immediate feedback, while strategic metrics like velocity trends work best with monthly or quarterly reviews. Match review frequency to the metric's purpose and your ability to act on insights.
Which engineering metrics work best for distributed teams?
Distributed teams benefit most from collaboration metrics, outcome-based measures like deployment frequency, and asynchronous workflow indicators rather than activity tracking. Focus on results and team effectiveness, not individual presence or activity.
How do you prevent teams from gaming engineering metrics?
Prevent gaming by using multiple complementary metrics, emphasizing learning over judgment, and regularly reviewing whether metrics serve their purpose. Include developers in metric selection to build ownership and understanding of measurement goals.