
Your project plan looks solid on paper — until 3 weeks in, you discover the database team can’t start because legal is waiting on a security audit that’s stuck on vendor documentation. What looked like parallel work streams just became a bottleneck that pushes your launch back a month.
This guide shows you how to build precedence diagrams that map the logical relationships between activities, the 4 dependency types that drive project flow, and how AI turns static diagrams into living workflows that keep teams aligned from planning through delivery.
Try monday.comKey takeaways
- Create precedence diagrams to understand which activities must happen in sequence and which can run simultaneously, preventing costly delays and resource conflicts.
- Identify activities with zero schedule flexibility that directly control project completion dates, ensuring priority resources go where they matter most.
- Automated dependency detection identifies circular logic, missing relationships, and potential bottlenecks before they derail your project timeline.
- Apply finish-to-start, start-to-start, finish-to-finish, or start-to-finish relationships based on how activities actually connect in your project.
- Transform static plans into dynamic workflows that automatically update dependencies as work progresses, keeping teams aligned and notifying the right people when their activities can begin.
What is the precedence diagramming method?
At its core, the precedence diagramming method (PDM) maps out your project as a network of connected boxes (or nodes) with arrows showing which tasks depend on others. Think of it as your project’s dependency roadmap: It shows which work must happen in sequence and which can run in parallel.
Unlike Gantt charts that plot activities on a calendar, PDM zeroes in on the why behind your schedule. It reveals the underlying logic of your project, which is exactly what you need to nail down before committing to specific dates.
Born in the 1960s, PDM quickly outshined older diagramming methods and now powers virtually all project management software because it handles every type of activity relationship while revealing your project’s critical path. The method was formalized by John W. Fondahl at Stanford University, who developed it as a more flexible alternative to arrow diagramming.
Precedence diagrams vs. arrow diagramming (ADM) vs. Gantt vs. PERT charts
Several network diagrams exist for project scheduling, each with distinct characteristics. Understanding these differences helps you select the right approach for your specific project needs. The choice depends on project complexity, team preferences, and stakeholder requirements.
| Method | Key features | Best for | Primary advantage |
|---|---|---|---|
| Precedence diagramming (PDM) | Activities as nodes, arrows show dependencies | Complex projects with varied dependency types | Supports all four dependency types |
| Arrow diagramming (ADM) | Activities as arrows, nodes show events | Simple sequential projects | Simple visual structure |
| Gantt charts | Horizontal bars on a timeline | Timeline communication and progress tracking | Intuitive time visualization |
| PERT charts | Probabilistic time estimates | Projects with high uncertainty | Accounts for estimation uncertainty |
Among project network diagrams, precedence diagrams are the most flexible and widely used. Their ability to model complex dependencies, overlapping tasks, and real-world constraints makes them the standard for modern project scheduling.
For teams managing dynamic, cross-functional projects, precedence diagramming provides the clarity needed to plan realistically — and the structure required to adapt when plans change. Teams on monday.com can switch between dependency-focused views and timeline-focused Gantt views while maintaining consistent underlying data.
Key benefits of using PDM in project management
PDM delivers specific advantages that directly impact project success. Understanding these benefits helps project managers and executives justify the investment in proper dependency mapping across their organizations — particularly given that average cost overruns of about 80% and schedule delays of about 50% plague mega projects without rigorous dependency logic. The following benefits demonstrate how PDM transforms project planning from guesswork into strategic execution.
- Immediate dependency visibility: The diagram makes dependencies immediately apparent, eliminating guesswork about what can start when. When a delay hits, you can trace its impact through the network in minutes rather than hours.
- Critical path identification: PDM calculations reveal which activities directly affect your project completion date, so you know exactly where to focus management attention and where you have flexibility to adjust schedules.
- Risk identification: Dependencies often hide risks — a single point of failure affecting multiple downstream activities or circular dependencies creating logical impossibilities. PDM surfaces these issues during planning when they’re easiest to address.
- Resource conflict prevention: By showing which activities can run in parallel, PDM helps identify resource conflicts before they occur. You can see when multiple activities need the same specialist or equipment and plan accordingly.
- Enhanced communication: A well-constructed precedence diagram communicates project logic more effectively than pages of documentation. Executives see the project structure at a glance, and team members understand how their work fits into the larger effort.
When to use precedence diagramming
Not every project needs a full-blown precedence diagram. Here’s when to roll out PDM (and when a simpler approach might be more suitable):
| Scenario | When to use PDM | Example |
|---|---|---|
| Complex interdependencies | Projects with 20+ activities that depend on each other in non-obvious ways benefit from PDM’s ability to map and validate relationships | Software implementation with overlapping development, testing, training, and migration |
| Shared resource management | Helps identify scheduling conflicts and optimization opportunities across workstreams | Manufacturing projects coordinating equipment and specialists |
| Firm deadline requirements | Critical path analysis shows which activities control the timeline | Projects with contractual penalties or regulatory deadlines |
| Multi-team coordination | Creates shared understanding of how work connects across teams or locations | Construction projects with site work, fabrication, and delivery |
Key precedence diagram components
Every precedence diagram is built from 3 core elements: nodes, arrows, and duration estimates. Together, they define what work needs to happen, how it connects, and how long it takes.
Nodes (activities or tasks)
Nodes are rectangular boxes that represent individual project activities — specific pieces of work with defined start and end points. Each node contains essential information that supports scheduling and coordination.
A standard node typically includes:
- Activity name: A clear, action-oriented label (e.g., “Develop customer portal backend”)
- Duration estimate: Expected work time to complete the activity
- Early start (ES) and early finish (EF): The earliest possible start and end times
- Late start (LS) and late finish (LF): The latest allowable times without delaying the project
Each node represents a discrete work package owned by a person or team.
Arrows (dependency relationships)
Arrows connect nodes and define the logical sequence of work. They show which activities depend on others — not how long tasks take or how resources are allocated.
Arrow direction always flows from the predecessor activity to the successor activity. This direction establishes execution order and enables accurate schedule calculations. Arrows may also include lag time, representing a required delay between activities. For example, concrete may need to cure before framing can begin.
Duration estimates and time logic
Duration estimates define how long each activity takes to complete and are usually expressed in working days or hours.
It’s important to distinguish between work time and calendar time. A 5-day task may span more than 5 calendar days due to weekends, holidays, or limited availability. Reliable estimates are typically based on:
- Historical data from similar projects
- Expert judgment
- Three-point estimation (optimistic, most likely, pessimistic)
Accurate duration estimates are critical — especially for tasks on the critical path — since even small underestimations can extend the overall project timeline.
The 4 types of dependencies in PDM
Dependencies define the logical relationships between activities and form the foundation of project scheduling. PDM supports 4 dependency types, each representing a different way that activities relate to each other. Understanding when to apply each dependency type helps you create more accurate project schedules.
The following comparison provides a quick reference for choosing the right dependency relationship:
| Dependency type | Relationship | Common usage | Example |
|---|---|---|---|
| Finish-to-start (FS) | Predecessor must finish before successor starts | Most project relationships | Foundation must be complete before framing |
| Start-to-start (SS) | Predecessor must start before successor can start | Parallel activities with staggered starts | Training begins once installation starts |
| Finish-to-finish (FF) | Predecessor must finish before successor can finish | Coordinated completion points | QA finishes after development finishes |
| Start-to-finish (SF) | Predecessor must start before successor can finish | Continuous coverage scenarios | Night shift ends after day shift begins |
Although all 4 dependency types exist in precedence diagramming, finish-to-start (FS) is by far the most common in real-world project schedules. It reflects the natural flow of work — one task finishes before the next begins.
- Start-to-start (SS) and finish-to-finish (FF) dependencies are typically used when activities can overlap, such as parallel development or phased rollouts. These relationships help compress timelines but require closer coordination to avoid downstream bottlenecks.
- Start-to-finish (SF) dependencies are rare and usually appear only in specialized scenarios, such as shift handovers or system cutovers. Most teams won’t use SF relationships unless there’s a very specific operational need.
Choosing the right dependency type is less about theory and more about realism. The goal is to reflect how work actually happens — not how you wish it would.
5 steps to create a precedence diagram
Step 1: List all project activities
Start by identifying every task required to complete the project. Each activity should represent a discrete unit of work with a clear outcome and owner. If a task feels vague or too large, break it down until it’s specific and actionable.
Step 2: Define task dependencies
Next, determine how activities relate to one another. Identify which tasks must happen first, which can run in parallel, and where overlap is possible. These logical relationships form the backbone of your precedence diagram and prevent sequencing conflicts later.
Step 3: Estimate activity durations
Assign a realistic duration to each task based on historical data, expert input, or estimation techniques like 3-point estimation. Remember that duration reflects work time, not calendar days — weekends, holidays, and availability all matter when the schedule is finalized.
Step 4: Draw the network diagram
Create nodes for each activity and connect them with arrows based on the dependencies you defined. Arrows should flow from predecessor to successor, clearly showing the order in which work progresses. At this stage, focus on logic — not optimization.
Step 5: Validate and refine the diagram
Review the diagram with stakeholders to confirm assumptions, sequencing, and timing. Look for missing dependencies, unrealistic durations, or opportunities to streamline work. Once validated, the diagram can be used to calculate the critical path and build a calendar-based schedule.
Finding the critical path in your precedence diagram
Your critical path is the sequence of must-do activities that directly controls when your project will finish. These tasks have zero wiggle room — delay any one of them, and your entire project gets pushed back. That’s why finding this path is so valuable: It tells you exactly where to focus your attention.
Forward pass: Calculate early start and early finish
The forward pass calculation moves through your network diagram from start to finish. This calculation establishes the earliest possible timing for each activity. Calculation rules:
- Early start (ES): For activities with no predecessors, ES equals zero. For activities with predecessors, ES equals the maximum early finish time of all predecessor activities
- Early finish (EF): Equals ES plus duration
Continue through the network until you reach the final activity. The EF of the final activity is your project duration.
Backward pass: Determine late start and late finish
The backward pass calculation moves from finish to start. This calculation establishes the latest possible timing without extending the project. Calculation process:
- Late finish (LF): For the final activity, LF equals its EF. For activities with successors, LF equals the minimum late start time of all successor activities
- Late start (LS): Equals LF minus duration
Continue backward through the network until you reach the starting activities.
Float analysis: Identify critical activities
Float measures how much scheduling flexibility an activity has.
- Float calculation: Float = LS − ES
Activities with zero float sit on the critical path — any delay directly extends the project timeline. Activities with positive float have scheduling flexibility and can be delayed without impacting the final delivery date.
Understanding float helps project managers prioritize monitoring, allocate scarce resources effectively, and identify where schedule adjustments are possible if timelines need to be compressed.
3 ways AI transforms precedence diagram creation
AI is reinventing how we build and use precedence diagrams. Instead of static documents that quickly go stale, AI turns them into living systems that adapt as your project unfolds. The result? Dependency maps that stay accurate without the constant manual updates.
1. Automated dependency detection
AI analyzes project activities and automatically suggests logical dependencies based on patterns from similar projects. When you add an activity called “Database Migration,” AI recognizes that this typically depends on “Database Schema Design” and “Test Environment Setup” based on patterns in historical data.
AI problem identification:
- Circular dependencies: Create impossible loops in project logic
- Missing dependencies: Activities that appear to have no predecessors but logically must depend on earlier work
- Illogical relationships: Contradict standard project flow patterns
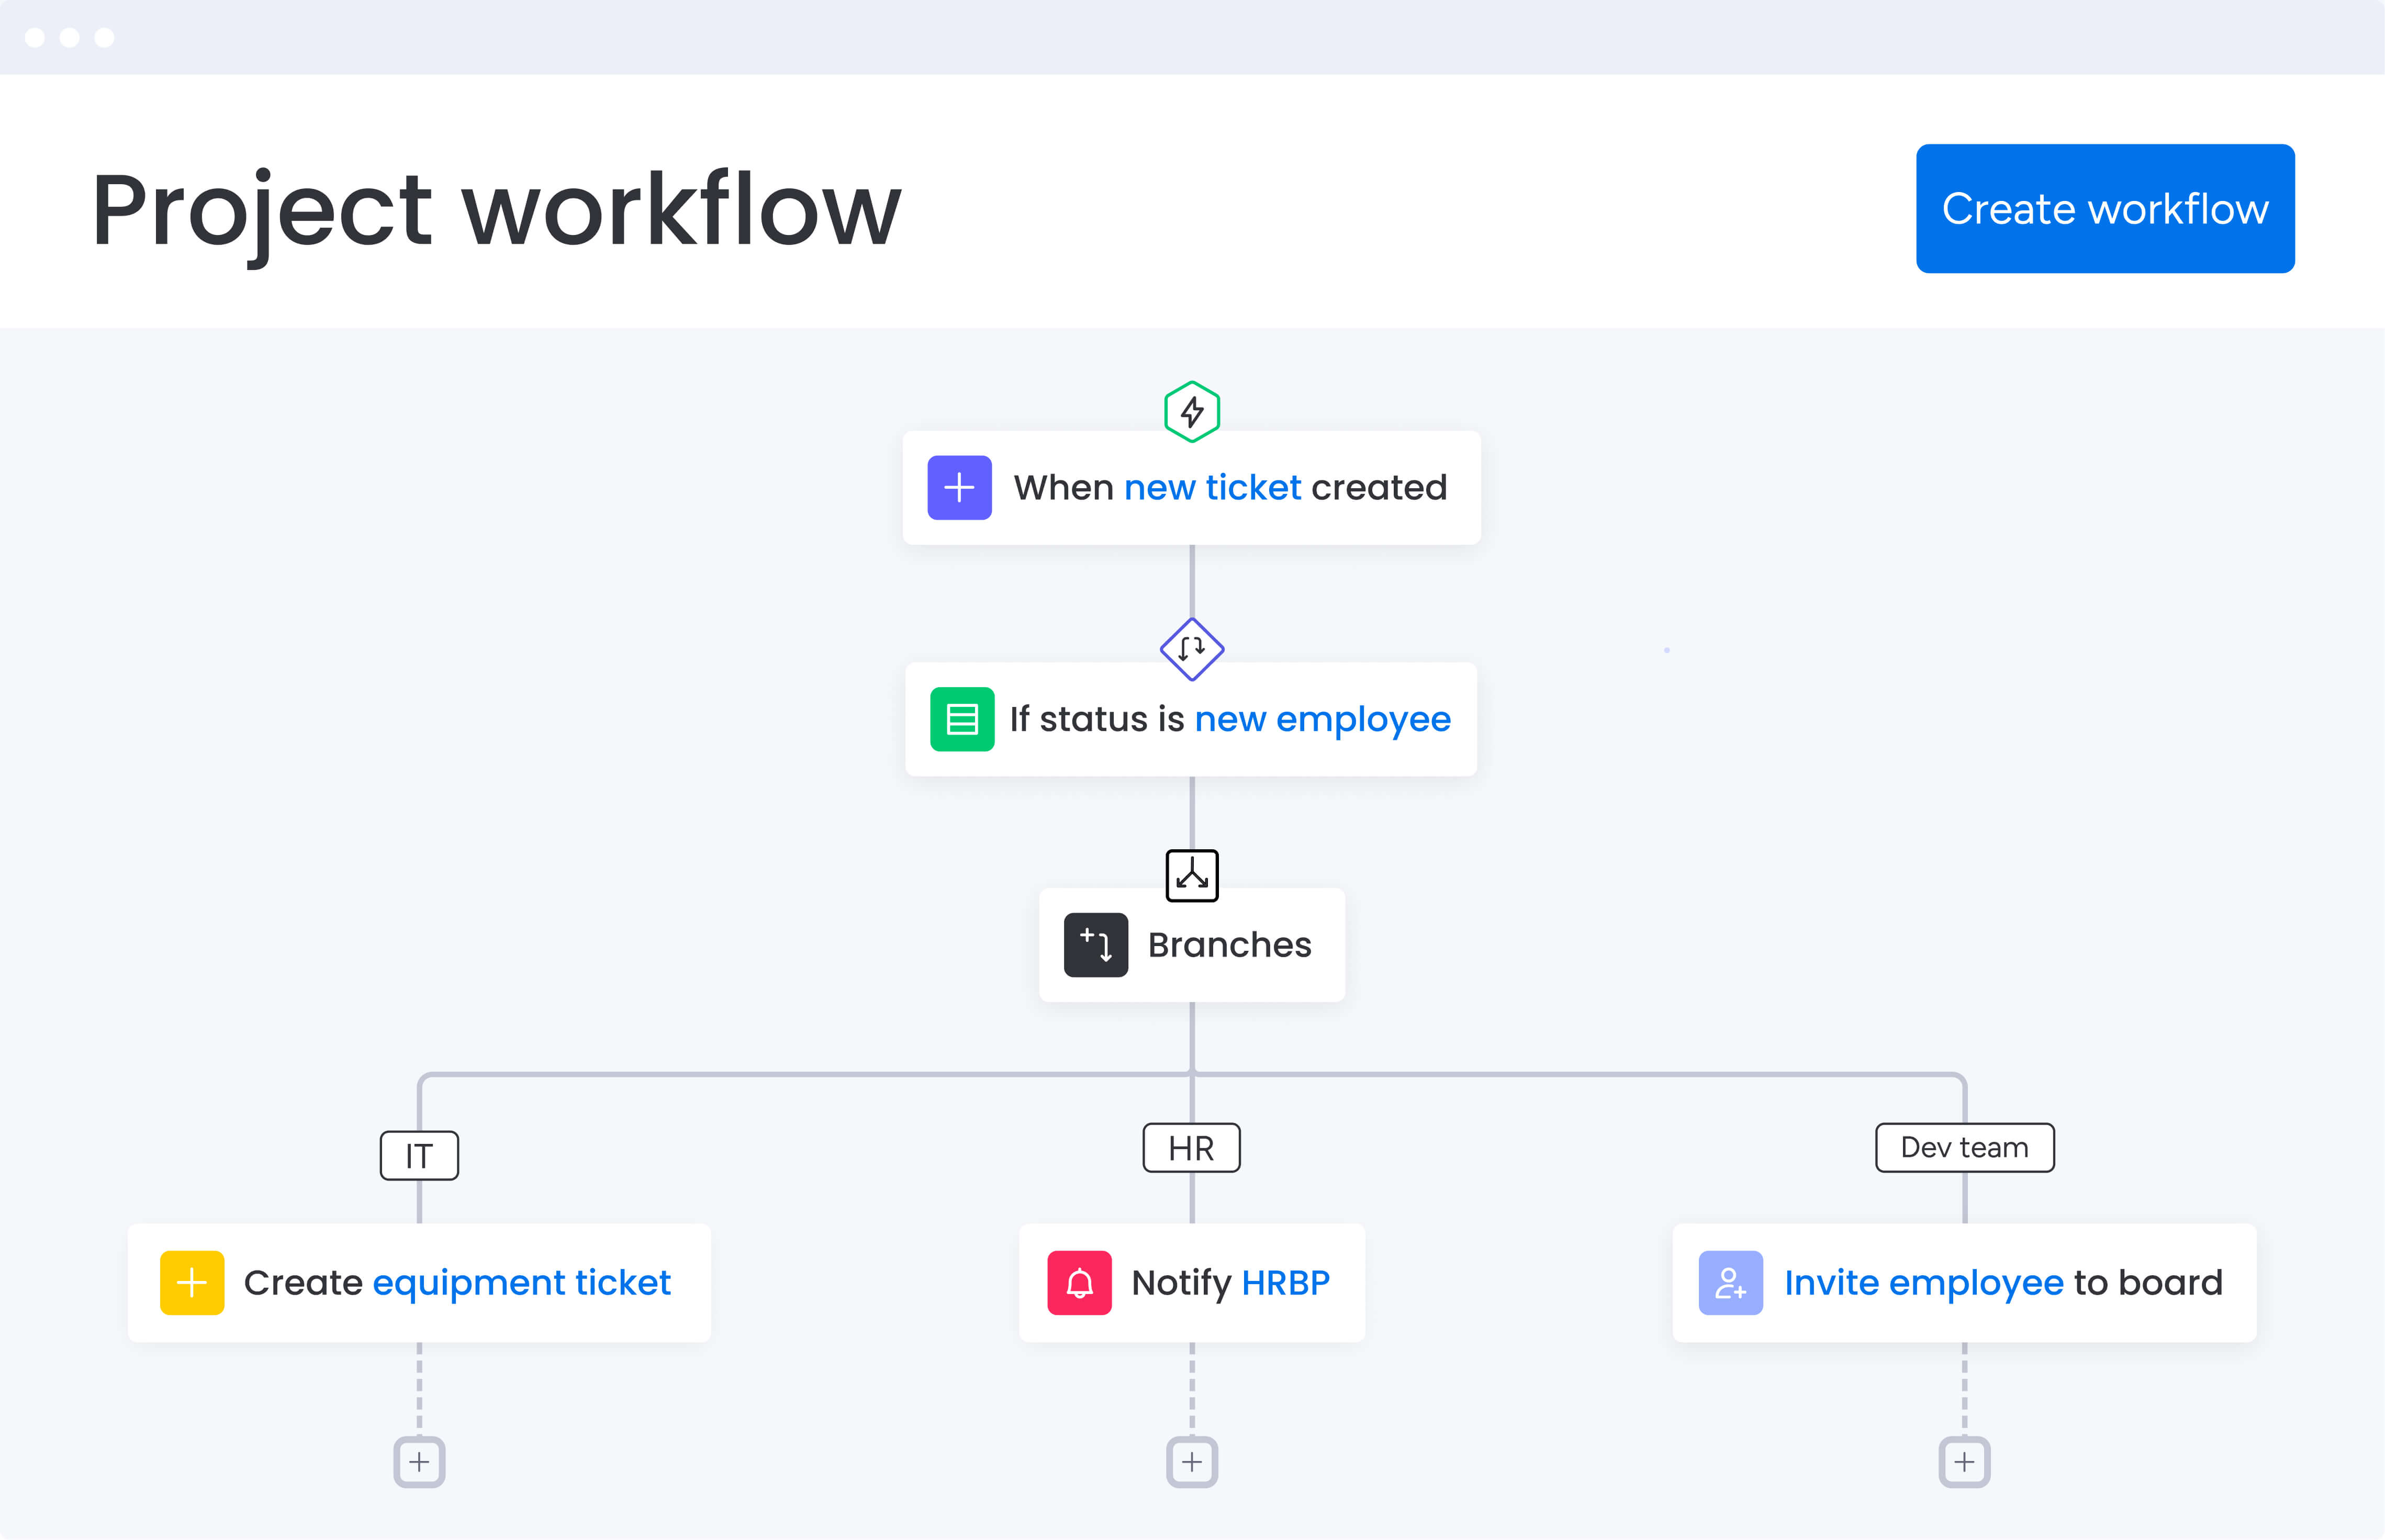
Teams using monday.com leverage AI Blocks to categorize project activities automatically, grouping related work and identifying natural dependency patterns. This automated detection doesn’t replace human judgment; it augments it.
2. Real-time schedule optimization
AI continuously monitors project progress and automatically suggests schedule adjustments. When a critical activity runs late, AI simulates multiple recovery scenarios to minimize project impact.
Recovery scenario analysis:
- Fast-tracking: Identifying non-critical activities that could run in parallel
- Crashing: Calculating the cost-benefit of adding resources
- Path optimization: Finding alternative dependency relationships
3. Predictive risk analysis for dependencies
AI analyzes historical project data to predict which dependencies are most likely to cause delays. Pattern recognition algorithms identify risk factors that human planners might miss.
Risk factor identification:
- High-risk dependency types: Based on historical failure rates
- Resource bottlenecks: Involving scarce resources or specialists
- External dependencies: Involving vendors, approvals, or third parties
- Complexity indicators: Between highly complex or interdependent activities
AI provides early warning systems for potential critical path impacts, allowing project managers to develop contingency plans for high-impact scenarios before they materialize. Organizations gain visibility into dependency failures before they cascade through projects.
Turn static precedence diagrams into living workflows with monday.com
Let’s face it: That beautiful precedence diagram you created during planning starts collecting dust the minute your project kicks off. Plans change, timelines shift, and teams adapt. What you need isn’t a static document but a living workflow that evolves with your project while preserving the critical dependency logic.
Dynamic dependency tracking that updates automatically
Dependencies update automatically as project conditions change on monday.com. The platform transforms static precedence diagrams into living workflows that respond to real project events.
Automatic updates include:
- When a team member marks a predecessor activity as complete, the platform automatically updates the status of dependent activities.
- Responsible parties receive notifications when their work can begin.
- Early start and early finish times recalculate based on actual completion dates.
- Timeline views adjust to reflect current project status.
Automation recipes support precedence diagram workflows. For example:
- “When status changes to Done, notify dependencies” automatically alerts teams when their predecessor activities are complete.
- “When due date changes, adjust dependent items” cascades schedule changes through the dependency chain.
Visual timeline views for modern PDM
The platform provides multiple view options that support precedence diagram methodology while offering visual interfaces stakeholders want to use. Each view maintains the underlying dependency logic while presenting information in formats suited to different audiences.
View integration benefits:
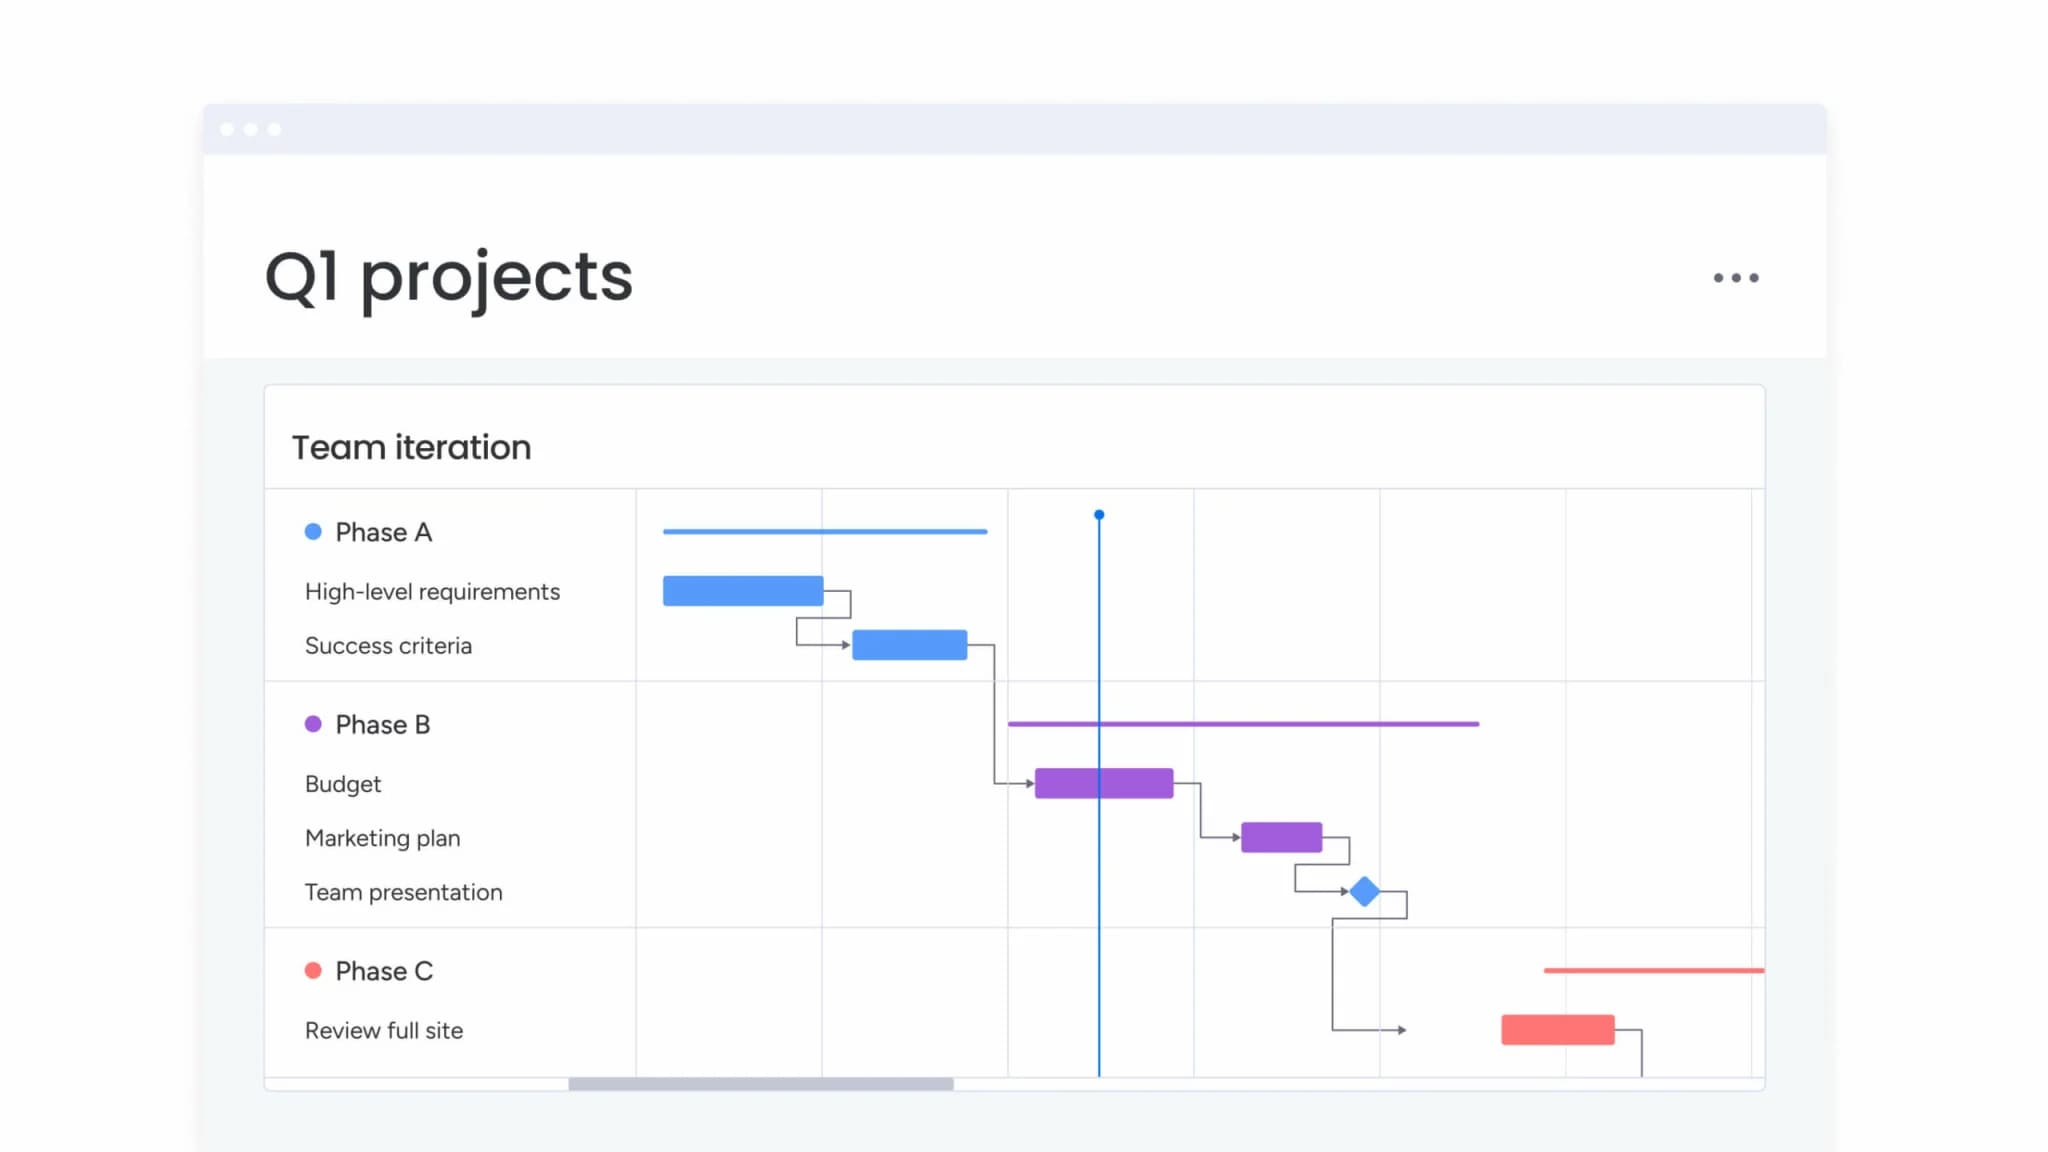
- Gantt chart view combines dependency visualization with timeline management.
- Kanban view transforms precedence diagram logic into workflow management.
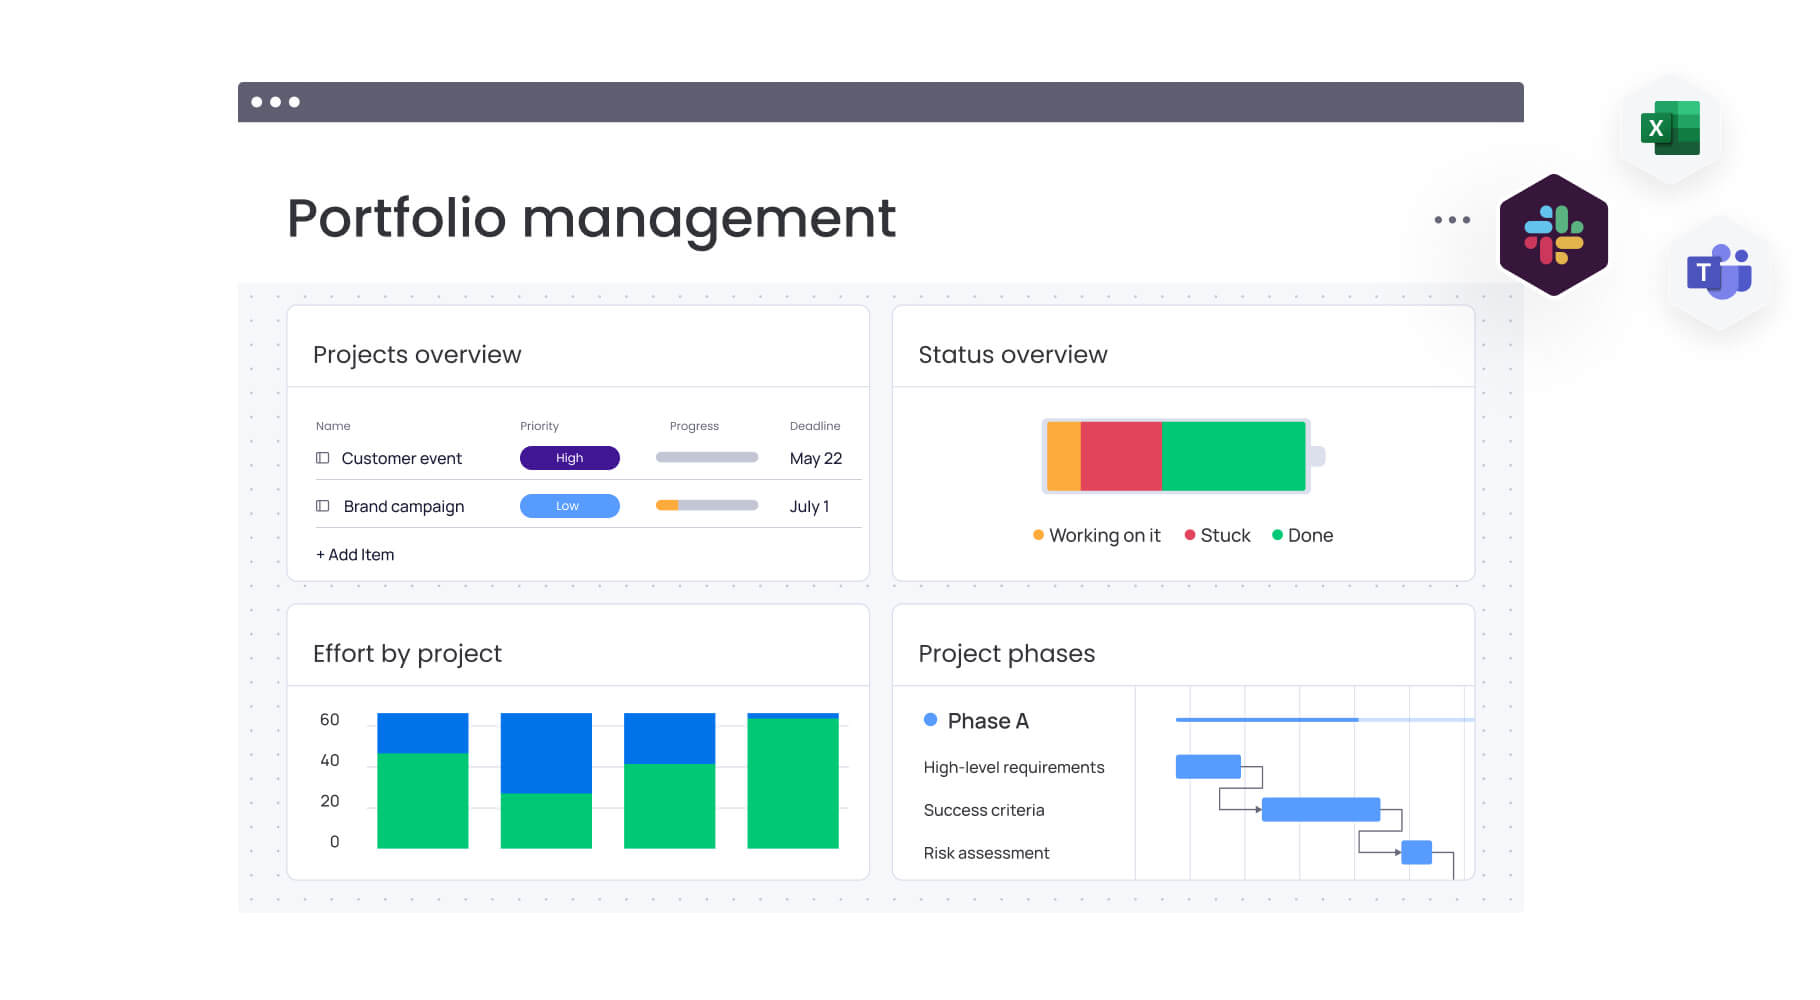
- Dashboard capabilities provide high-level project oversight that aggregates data across multiple projects.
Collaborative planning across distributed teams
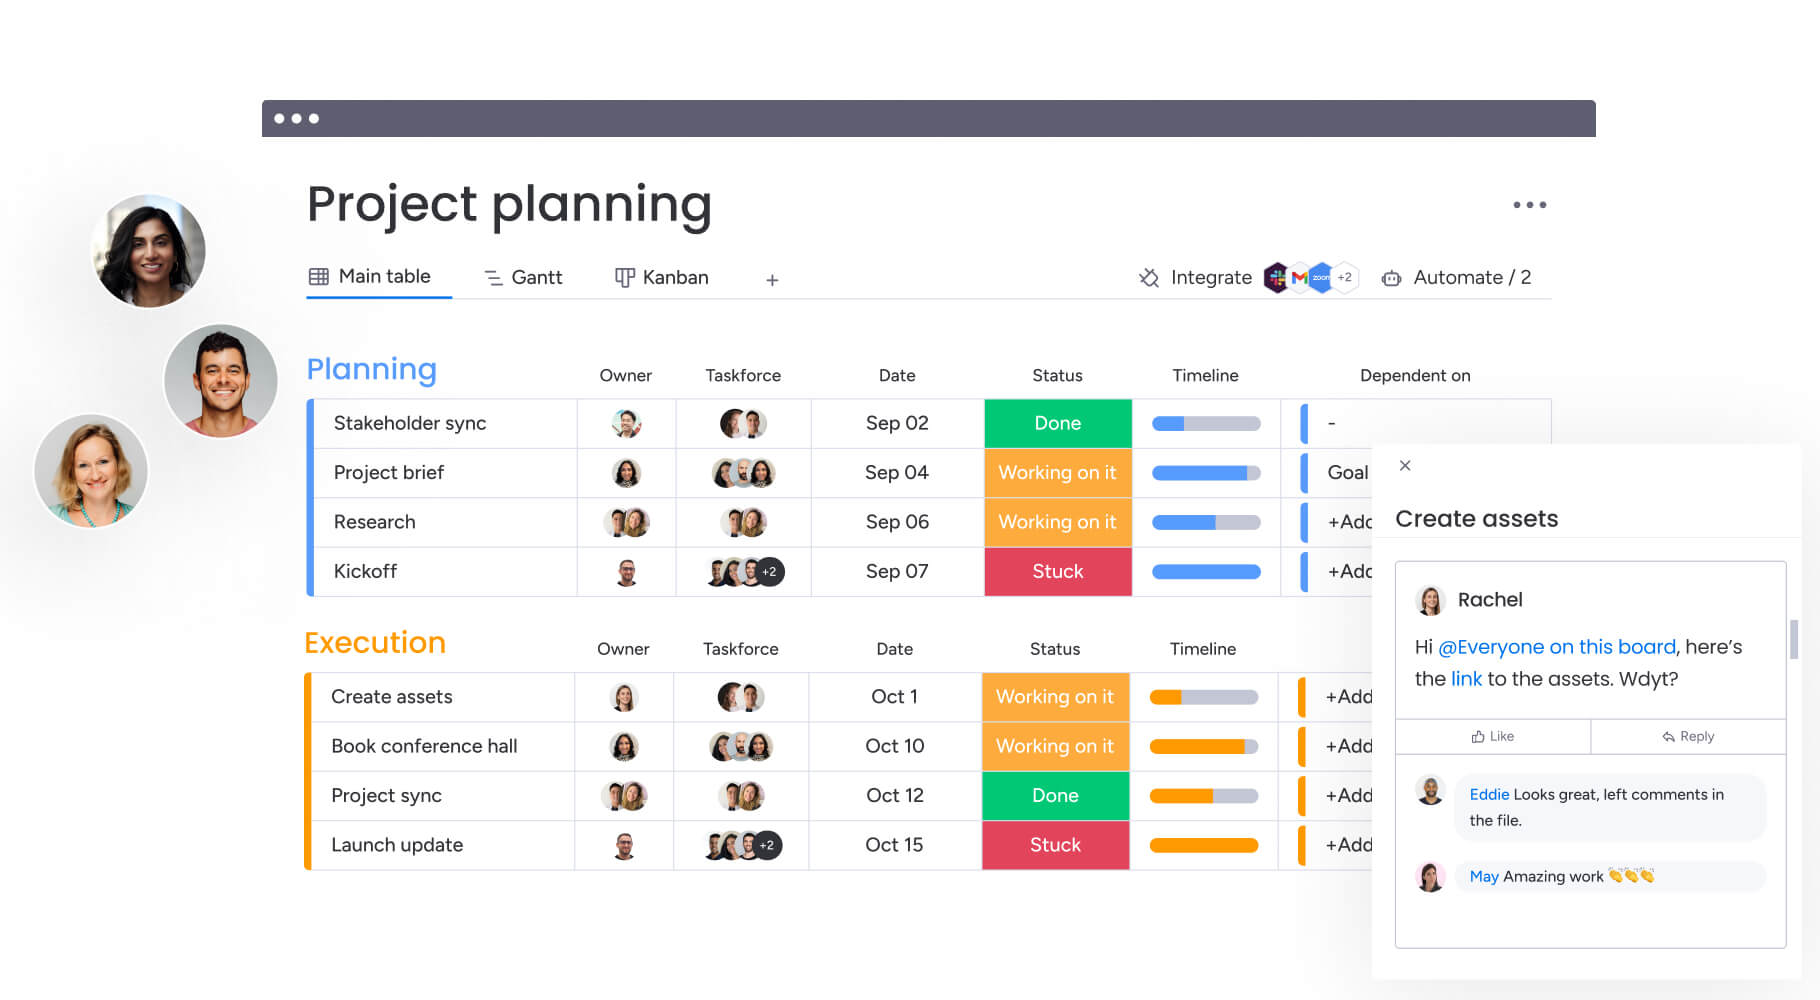
Real-time collaboration features allow multiple people to work on the same project simultaneously. When one team member adds an activity, others see it appear instantly. This collaborative approach ensures precedence diagrams reflect input from all stakeholders.
Collaboration features:
- Comment and mention systems keep conversations connected to specific activities and dependencies.
- Real-time updates ensure everyone works with current information.
- Version control maintains data integrity while allowing multiple contributors.
Integration capabilities for smarter work
The platform connects precedence diagram workflows with communication platforms like Slack and Microsoft Teams, document management systems, and time tracking applications. The platform maintains data integrity while allowing multiple contributors, with dependency logic validated automatically.
Buildi project success through smart dependency management
Precedence diagrams provide the foundation for successful project execution by making dependencies visible and manageable. When teams understand how their work connects to the larger project, they make better decisions about priorities, resource allocation, and risk management.
The evolution from static diagrams to dynamic workflows represents a fundamental shift in project management. Organizations that embrace AI-powered dependency tracking and real-time collaboration gain significant advantages in project delivery speed and quality.
Teams using monday.com experience this transformation firsthand. They move beyond traditional planning documents to create living workflows that adapt as projects evolve, ensuring that dependency logic remains accurate and actionable throughout the project lifecycle.
Try monday.comFrequently asked questions
How do you handle complex dependencies in large projects?
Complex dependencies in large projects are managed by breaking them into smaller segments and using software that handles multiple dependency types simultaneously. Automated dependency tracking and AI-powered analysis identify potential conflicts and optimization opportunities before they become problems.
Can precedence diagrams work with agile methodologies?
Precedence diagrams adapt well to agile projects by focusing on sprint-level dependencies and using iterative planning approaches. Understanding that user story B depends on user story A helps teams sequence work effectively within sprints.
What's the best software for creating precedence diagrams?
The best software depends on project complexity and team needs, but should include automatic dependency tracking, multiple view options, and collaboration capabilities. Look for platforms that transform static diagrams into dynamic workflows that stay current as projects evolve.
How often should precedence diagrams be updated?
Precedence diagrams should be updated whenever project scope, dependencies, or timelines change significantly. Automated systems handle routine updates continuously, while major changes require deliberate review by project managers.
What's the difference between PDM and CPM?
PDM (Precedence Diagramming Method) is a diagramming technique that visualizes activity relationships using nodes and arrows. CPM (Critical Path Method) is a scheduling calculation method that identifies the longest path through a project network. CPM often uses PDM diagrams as its foundation.
How do precedence diagrams help with resource allocation?
Precedence diagrams show which activities can be performed simultaneously and which must occur in sequence. When you see that multiple activities can run in parallel but all require the same specialized resource, you can proactively adjust the schedule or secure additional resources before conflicts occur.