Operational inefficiency rarely announces itself loudly. It builds quietly — in longer approval cycles, small error rates, incremental delays, and teams operating at full capacity without realizing it.
Organizations often discover these issues only after quarterly KPIs decline. Revenue dips. Costs creep upward. Customer satisfaction softens. By then, the operational signals were visible — they simply were not measured in a way that enabled action.
Operational metrics change that dynamic.
By tracking how work moves through critical processes in real time, leaders gain early visibility into performance drift, capacity strain, and quality breakdowns. Instead of reacting to lagging outcomes, teams intervene early, protect margins, and improve throughput before problems escalate.
In the sections that follow, this post will explore some of the crucial operational metrics that matter in 2026, how to align them with strategic objectives, and how to implement measurement systems that support continuous improvement rather than reporting for its own sake.
Key takeaways
- Real-time insight: Operational metrics reveal bottlenecks, quality issues, and resource utilization before they impact outcomes.
- Focused measurement: Tracking 5–7 key metrics per critical process ensures actionable insights without overwhelming teams.
- Balanced performance: Monitoring cycle time, throughput, and first-pass yield maintains speed while protecting operational excellence.
- Shared visibility: When teams rely on the same metrics, they respond faster and reduce silos.
- Automated tracking: Platforms like monday work management collect, visualize, and update operational metrics automatically for real-time decision-making.
What are operational metrics?
Operational metrics show how work is performing in real time. While strategic KPIs measure quarterly outcomes, operational metrics focus on the mechanics of daily execution — processing times, error rates, utilization levels, and workflow speed.
This visibility exposes capacity strain, process bottlenecks, and quality gaps before they affect revenue or customer satisfaction. Small inefficiencies become visible early, when adjustments are still simple.
Each function tracks indicators tied to its core processes. Manufacturing monitors uptime and defect rates. Customer service measures resolution speed and first-contact success. Finance tracks invoice turnaround and reconciliation accuracy. The specifics differ, but the purpose is the same: understand how efficiently work is moving.
The real advantage is timing. Instead of reviewing last month’s results in a spreadsheet, teams can respond as issues emerge. That shift from retrospective reporting to active management is what makes operational metrics so powerful.
Why operational metrics transform business performance
Operational metrics link daily work to quarterly goals. When teams understand how efficiency affects company objectives, alignment strengthens across departments.
A support team reducing response time by twenty percent directly increases customer retention. A warehouse team improving pick accuracy decreases returns and saves thousands in shipping costs.
The real advantage is actionability: managers stop analyzing and start resolving issues. Instead of waiting for monthly reports, bottlenecks are spotted immediately and resources reallocated. Teams identify process improvements based on actual performance trends rather than assumptions.
Here’s how operational metrics help you see problems coming:
- Maintenance forecasting: Equipment performance data predicts failure points, allowing repairs during planned downtime rather than emergency shutdowns.
- Staffing optimization: Historical workload patterns reveal weekly peaks, enabling managers to schedule proactively and maintain service levels.
- Capacity planning: Trend analysis shows when teams near their limits, prompting hiring or automation decisions before burnout occurs.
When departments share the same metrics, silos disappear. Production, quality, and logistics teams responding to the same real-time data can coordinate immediately.
Sales teams referencing inventory metrics avoid overpromising delivery dates. Marketing teams monitoring support ticket volumes can adjust campaign timing to prevent overwhelming service teams.
Operational metrics vs KPIs: understanding the difference
Not all metrics answer the same question.
Some tell you how work is moving today. Others tell you whether the organization is hitting long-term targets. Confusing the two leads to slow decisions and misaligned priorities.
The table below clarifies the distinction between strategic KPIs, tactical metrics, and operational metrics — including who uses them, how often they are reviewed, and what they are designed to measure.
| Metric type | Purpose | Timeframe | Audience | Examples |
|---|---|---|---|---|
| Strategic KPIs | Measure organizational success | Annual/quarterly | Executives, board | Revenue growth, market share, profit margin |
| Tactical metrics | Track department performance | Monthly/quarterly | Department heads | Customer acquisition cost, employee retention |
| Operational metrics | Monitor daily execution | Real-time/daily | Team leads, contributors | Processing time, error rate, utilization |
Strategic KPIs confirm outcomes after the fact. Operational metrics signal performance as it unfolds. One validates direction. The other enables correction.
Use operational metrics when you need visibility into execution:
- Workflow management: Understand process efficiency in real time.
- Bottleneck detection: Spot delays before they escalate into missed deadlines.
- Resource reallocation: Adjust capacity immediately when workloads shift.
Use strategic KPIs when you are evaluating broader performance:
- Goal tracking: Measure progress toward annual or quarterly objectives.
- Stakeholder reporting: Summarize organizational performance clearly and concisely.
- Strategic evaluation: Assess whether long-term initiatives are delivering results.
Strong organizations connect the two. Operational metrics should influence strategic outcomes, and strategic KPIs should reflect operational discipline. When metrics operate in isolation, teams risk optimizing for numbers that look good on a dashboard but fail to create measurable impact.
Try monday work managementStrategic KPIs confirm outcomes after the fact. Operational metrics signal performance as it unfolds. One validates direction. The other enables correction.
Essential categories of operational metrics
Operational metrics should reflect how your business actually operates — not just one function, but the full system. Finance, operations, customer experience, workforce performance, and technology all influence efficiency. Grouping metrics into clear categories helps ensure coverage is balanced and actionable.
Financial operational metrics
Financial metrics reveal how efficiently money moves through your core processes.
- Cost per transaction: Measures efficiency in processing invoices, orders, or service requests.
- Daily cash position: Tracks available funds for immediate obligations and opportunities.
- Budget variance: Compares real-time spending against allocated budgets.
- Payment processing time: Calculates the time from invoice receipt to payment completion.
Productivity and efficiency metrics
These indicators show how effectively resources convert effort into output.
- Throughput rate: Calculates the volume of work completed within a given time period.
- Cycle time: Measures total duration from process start to completion.
- Resource utilization: Tracks the percentage of available capacity used productively.
- Process efficiency ratio: Compares value-added time against total process time.
Quality and performance metrics
Speed only matters when quality holds.
- Error rate: Measures how often work requires correction.
- First-pass yield: Calculates the percentage of work completed correctly without rework.
- Defect density: Tracks the number of issues per unit of output.
- Compliance rate: Measures adherence to required standards and procedures.
Customer experience metrics
Operational friction often shows up first in customer interactions.
- First response time: Measures how quickly initial contact is made.
- Resolution rate: Tracks the percentage of issues resolved completely.
- Customer effort score: Evaluates how easy it is for customers to resolve issues.
- Service level achievement: Measures performance against promised response or delivery times.
Employee and workforce metrics
Operational performance depends on capacity and readiness.
- Utilization rate: Compares productive time against available time.
- Absenteeism rate: Tracks unplanned time off that affects operations.
- Training completion: Measures workforce qualification for assigned work.
- Time to productivity: Calculates how quickly new hires reach expected performance levels.
Technology and system metrics
Stable systems keep workflows moving.
- System uptime: Measures the availability of critical systems and applications.
- Processing speed: Calculates how long automated tasks take to complete.
- Integration success rate: Tracks reliability of data flows between systems.
- Error recovery time: Measures how quickly technical issues are resolved.

Critical operational metrics every organization should track
Tracking operational metrics is essential for understanding organizational health and improving process effectiveness across industries. These metrics below reveal efficiency, quality, and productivity trends that have the power to guide much better decision-making.
Revenue per employee
Revenue per employee is calculated by dividing total revenue by full-time equivalent employees. It shows how effectively the organization converts headcount into revenue. Benchmarks vary by industry, so trends matter more than raw numbers. Consistent growth signals improving efficiency without proportional hiring.
Operating margin
Operating margin equals operating income divided by revenue. It reflects the percentage of revenue left after variable costs and captures core operational efficiency. Because it excludes interest and taxes, it highlights whether day-to-day operations are sustainably profitable.
Process cycle time
Process cycle time measures the total elapsed time from initiation to completion, including both active work and waiting periods. It exposes bottlenecks and unnecessary delays. In recruiting, it tracks days from application to offer. In manufacturing, it measures production from raw materials to finished goods.
First-pass yield
First-pass yield represents the percentage of output that meets quality standards without rework. Divide good units by total units entering the process to calculate it. Higher rates indicate stable processes and lower waste across time and resources.
Customer satisfaction score
Customer satisfaction score, or CSAT, measures the percentage of customers who rate a specific interaction as satisfactory. Unlike broader relationship metrics, it focuses on individual touchpoints. Declines often signal process friction, training gaps, or system breakdowns.
Employee utilization rate
Employee utilization rate equals productive or billable hours divided by total available hours. It helps project-based teams maintain profitability without overloading staff. Sustainable targets typically range between 70% and 80%, leaving space for planning and collaboration.
System uptime percentage
System uptime percentage measures how often critical systems remain operational. Calculate it by subtracting downtime from total time, then dividing by total time. In digital environments, even brief outages disrupt revenue and workflows, which is why many organizations target 99.999% availability.
Order fulfillment accuracy
Order fulfillment accuracy tracks the percentage of orders processed correctly across items, quantities, addresses, and timing. Errors increase shipping costs and reduce customer trust. Incremental improvements in accuracy often deliver outsized operational savings.
How AI and automation has transformed operational metrics
AI and automation have totally reshaped how organizations collect, analyze, and act on operational data. Manual compilation has now been replaced by integration layers that automatically pull metrics from multiple systems.
In 2026, advanced and intelligent platforms like monday work management allows teams to centralize metric tracking without manual updates.
AI capabilities improve metric analysis and actionability by leveraging:
- Predictive analytics: AI analyzes historical patterns to forecast inventory, predict equipment failures, and anticipate demand spikes before they occur.
- Anomaly detection: Machine learning sets dynamic baselines for each metric, alerting teams when values deviate from normal ranges.
- Intelligent recommendations: AI analyzes operational data to suggest process improvements, resource reallocations, and preventive actions.
In 2026, advanced and intelligent platforms like monday work management allows teams to centralize metric tracking without manual updates.
How to implement operational metrics successfully: 5 steps
Operational metrics only create value when they are implemented with discipline. Without structure, teams either track too much or measure the wrong things. A focused rollout ensures metrics stay practical, actionable, and aligned to business priorities.
Step 1: Map your critical business processes
Start with the workflows that directly drive revenue, cost control, or customer experience. Document each stage clearly, including inputs, activities, and outputs.
Common examples include:
- Order-to-cash: The full flow from sales order to cash collection.
- Procure-to-pay: The process from purchasing to supplier payment.
- Concept-to-launch: The journey from idea to market-ready product.
Visual workflow mapping helps teams align on how work actually moves before deciding what to measure.
Step 2: Select the right metrics for each process
Resist the urge to measure everything. Two to three strong indicators per process are usually enough to assess health.
Prioritize metrics based on:
- Business impact: The extent to which improvement advances strategic goals.
- Measurability: The availability of reliable, consistent data.
- Actionability: The team’s ability to directly influence results.
Focused selection prevents noise and keeps attention on what drives performance.
Step 3: Establish baselines and targets
Metrics without context create confusion. Use historical data to define current performance, then set realistic improvement targets. When internal history is limited, industry benchmarks can provide a starting point while you build your own data set.
Clear baselines turn numbers into signals rather than guesses.
Step 4: Automate tracking inside workflows
Manual reporting slows momentum and introduces errors. Centralize tracking in a system that integrates with your existing platforms and updates automatically.
monday work management allows teams to embed metrics directly into workflows, ensuring dashboards reflect live operational activity instead of static reports.
Step 5: Create a continuous improvement rhythm
Tracking metrics is not the goal. Acting on them is.
Establish consistent review cadences such as weekly operational check-ins and monthly performance reviews. Use those sessions to:
- Celebrate progress: Recognize measurable improvements across teams.
- Investigate anomalies: Identify root causes behind unexpected shifts.
- Refine processes: Adjust workflows and resource allocation based on insight.
Regular review keeps metrics relevant and ensures measurement supports long-term operational excellence rather than becoming another reporting task.
Operational metrics templates and dashboard examples
Operational metrics are not one-size-fits-all. While some indicators apply across industries, the right mix depends on how value is created in your sector.
The table below outlines how measurement priorities shift by industry — highlighting which operational metrics matter most and what they are designed to protect or optimize.
| Industry | Critical metrics | Focus areas |
|---|---|---|
| Manufacturing | OEE, scrap rate, on-time delivery, cycle time | Asset efficiency, quality control, supply chain |
| SaaS/technology | Churn rate, server uptime, feature adoption, ticket volume | System reliability, user engagement, scalable growth |
| Professional services | Billable utilization, project margin, schedule variance | Human capital efficiency, project profitability |
| Retail/e-commerce | Return rate, cart abandonment, fulfillment cost | Transaction efficiency, inventory management |
| Healthcare | Patient wait time, bed occupancy, readmission rate | Patient outcomes, capacity management |
Choosing the right metrics is only half the equation. How they are displayed determines whether teams act on them.
Effective dashboards follow the five-second rule: anyone viewing them should immediately understand operational health.
Strong dashboard design includes:
- Prominent placement: Critical health metrics appear first and receive visual priority.
- Performance context: Current results are displayed alongside targets or benchmarks.
- Visual indicators: Color coding signals status instantly without requiring analysis.
- Drill-down capability: Summary widgets link directly to detailed supporting data.
Remember, operational data is only useful when it is connected. When metrics live in separate tools, visibility breaks down and decisions slow.
monday work management brings operational metrics into the same workspace where work happens, so dashboards reflect real activity and teams can act without switching systems.
How monday work management makes operational metrics actionable
Operational metrics only matter when teams can act on them immediately. If reporting lives in one tool and execution lives in another, insight arrives too late to make a difference.
monday work management is built for connected execution. Metrics update dynamically as work progresses, dashboards reflect live operational signals, and automation reduces manual reporting overhead. Instead of reviewing static numbers, teams work inside a truly responsive system that surfaces performance patterns as they emerge.
The platform supports operational metric tracking through:
- Custom boards and columns: Configured to match exact processes.
- Automated data collection: Metrics update automatically based on workflow actions.
- Real-time dashboards: Aggregate data from multiple sources.
- Cross-departmental visibility: Secure permission settings control access.
AI-powered insights and automation
AI features identify problems before they escalate. AI Blocks categorize incoming data, extract insights, and summarize complex information into actionable recommendations. Teams can detect patterns, predict bottlenecks, and find ways to improve automatically.
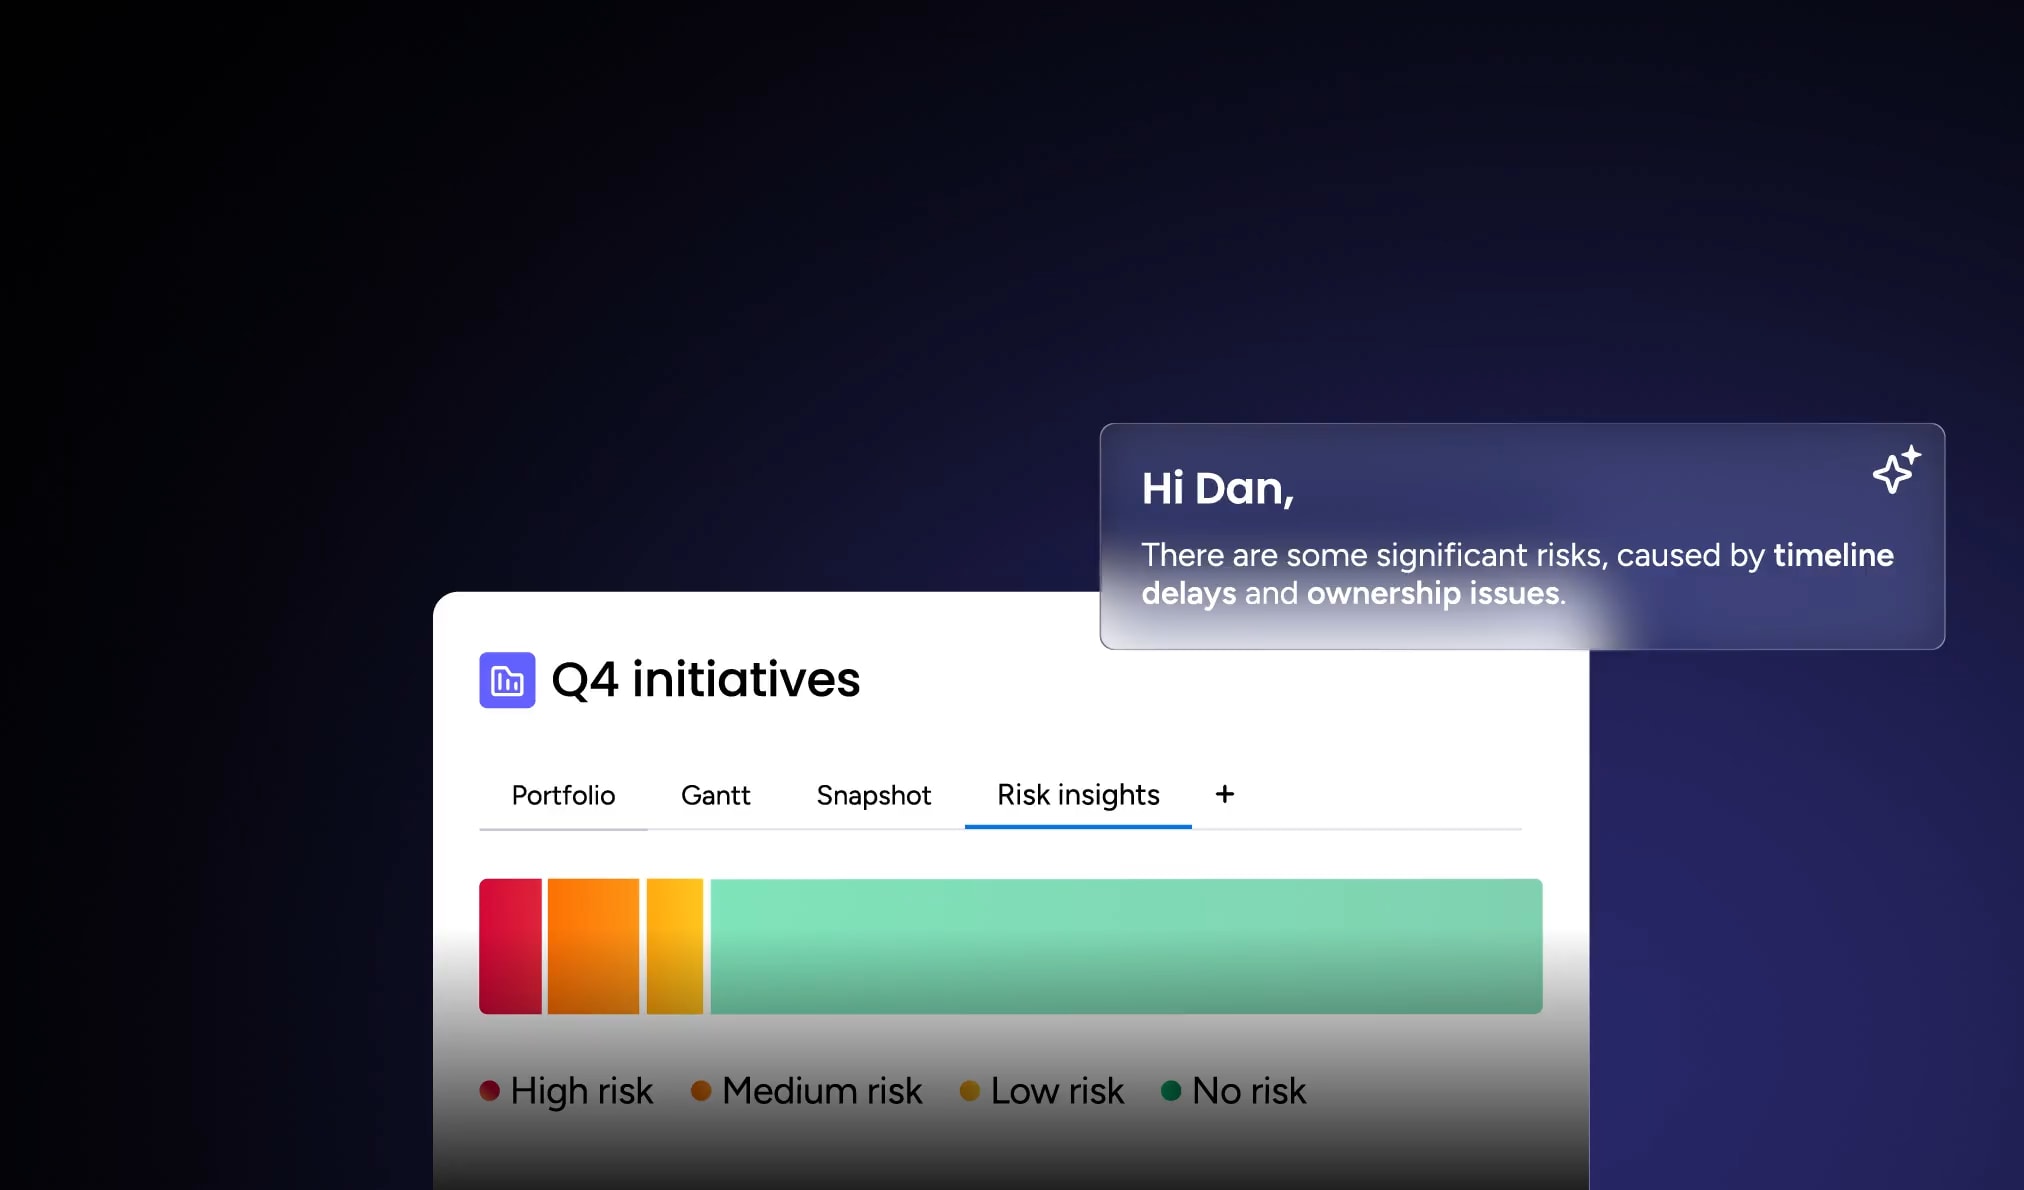
Portfolio Risk Insights scan projects across the organization to flag potential issues. By analyzing project health, resource allocation, and timelines, the system provides early warnings.
Digital Workers monitor metrics continuously, flag deviations, and suggest corrective actions based on historical trends.
Real-time dashboards and reporting
Modern platforms turn raw data into visuals executives can use for decision-making. Dashboards update as work progresses, offering instant visibility across teams.
Operations leaders can customize views for different stakeholders: executives see high-level summaries, and team leads access detailed data.
This approach provides:
- Automatic updates: Work progress reflects in metrics immediately.
- Current reality: Metrics always show accurate status.
- Native collaboration: Teams discuss metrics and coordinate responses.
- No-code customization: Dashboards can be built and modified without IT support.
“monday.com has been a life-changer. It gives us transparency, accountability, and a centralized place to manage projects across the globe".
Kendra Seier | Project Manager“monday.com is the link that holds our business together — connecting our support office and stores with the visibility to move fast, stay consistent, and understand the impact on revenue.”
Duncan McHugh | Chief Operations OfficerBuild operational excellence through smart measurement now
Operational metrics are not about building bigger dashboards. They are about creating operational clarity.
With the right measures visible in real time, bottlenecks surface earlier, capacity decisions become deliberate, and small inefficiencies are corrected before they erode margins or customer trust. Measurement shifts from retrospective reporting to active management.
High-performing organizations treat metrics as part of how work runs day to day. Signals are refined as priorities evolve. Noise is removed. Focus stays on the indicators that protect speed, quality, and profitability.
Operational excellence does not require tracking everything. It requires tracking what matters and having the visibility to act when it counts.
Try monday work managementFrequently asked questions
How often should operational metrics be reviewed?
Metrics require continuous monitoring through automated dashboards for real-time awareness, weekly reviews for tactical adjustments, and monthly analysis to identify trends.
What's the difference between leading and lagging operational metrics?
Leading metrics, such as training completion or pipeline velocity, predict future performance and enable proactive action. Lagging metrics, like quarterly revenue, confirm results that have already occurred.
How many operational metrics should a team track?
Most teams track five to seven core metrics to maintain focus while avoiding data overload.
How do you calculate ROI from operational metrics tracking?
ROI can be measured by comparing efficiency gains, error reduction, and faster decision-making to the costs of tracking software and analysis.
Can operational metrics be tracked across multiple departments?
Yes. Unified platforms aggregate data from sales, marketing, operations, and finance, giving cross-departmental visibility while maintaining secure access.
How does monday work management help automate operational metric collection?
The platform uses native integrations and automation recipes to capture data directly from connected systems and workflows. This ensures metrics reflect real-time performance without manual entry.