At the midpoint of a project, progress reports often sound reassuring. Percent complete looks reasonable, budgets appear balanced, and timelines feel intact. Yet many projects fail not because teams stop working, but because leaders lack a clear view of what has actually been delivered versus what has simply been spent.
Earned value in project management exists to close that gap. It connects scope, schedule, and cost into a single performance model that shows whether progress is real, sustainable, and aligned with the plan. Instead of relying on subjective updates or isolated budget checks, teams gain objective signals that reveal risk early and forecast outcomes with precision.
This article explores how earned value works in practice, how to calculate its core metrics accurately, and how modern platforms turn earned value from a reporting exercise into a live decision-making system that supports delivery at scale.
Key takeaways
- Earned value replaces subjective progress tracking: it measures completed work against planned scope and actual cost to reveal true project performance.
- Three metrics form the foundation: planned value, earned value, and actual cost work together to expose schedule delays and cost inefficiencies early.
- Performance indexes predict outcomes: CPI and SPI trends provide early warning signals that forecast final cost and completion dates.
- Automation improves accuracy and adoption: earned value is most effective when calculations update automatically as work progresses.
- monday work management operationalizes EVM: project data, budgets, and timelines connect in real time so earned value insights stay current without manual reporting.
Earned value in project management measures project performance by comparing planned work, actual work completed, and costs incurred. This means you get an objective, data-driven view of whether your project’s on track, over budget, or behind schedule. It replaces guesswork with hard numbers.
Imagine a website redesign with a $100,000 budget and 20-week timeline. By week ten, you’ve spent $50,000. Traditional tracking might suggest you’re perfectly on track. But earned value analysis reveals the truth: if you’ve only completed 30% of the work, you’re actually behind schedule and heading for a budget overrun. This early warning gives you time to course-correct before the budget’s gone.
Understanding the core components
Earned value management relies on three foundational metrics that work together to reveal project health. These metrics form the foundation of all EVM calculations.
| Metric | Definition | Example (month three) | What it tells you |
|---|---|---|---|
| Planned value (PV) | Budget for scheduled work | $60,000 | Your baseline target |
| Earned value (EV) | Budget value of completed work | $45,000 | Behind schedule (EV < PV) |
| Actual cost (AC) | Money actually spent | $65,000 | Over budget (AC > EV) |
Planned value (PV): represents your authorized budget for work scheduled to be complete by a specific date. For a six-month software implementation with $120,000 total budget, PV at month 3 would be $60,000 if work is evenly distributed.
Earned value (EV): measures the budgeted value of work actually completed. If your team finishes 40% of total scope by month 3, EV equals $48,000 ($120,000 × 0.40), regardless of actual spending.
Actual cost (AC): captures what you really spent to complete that work. If labor and licenses totaled $65,000 for that 40% completion, your AC is $65,000.
When to use earned value management
Not every project needs full EVM implementation. The methodology works best in specific scenarios where the investment in tracking pays off through risk reduction and more precise control:
- Complex, multi-phase projects: long-duration initiatives where a 10% variance represents significant financial risk
- Fixed-price contracts: situations where vendors bear cost overrun risk and must monitor efficiency strictly.
- Cross-functional initiatives: projects spanning multiple departments where “percent complete” needs unified definition.
- Portfolio management: organizations juggling multiple projects that need standardized metrics for comparison.
- Regulatory environments: industries requiring auditable progress reporting for compliance.
How EVM differs from traditional tracking
While traditional project tracking focuses on isolated metrics, EVM integrates them to provide a complete performance picture. EVM integrates schedule, cost, and scope to show how they affect each other.
| Aspect | Traditional tracking | Earned value management |
|---|---|---|
| Focus | Time elapsed, budget spent | Value delivered vs. cost and time |
| Data source | Subjective updates | Objective milestones and deliverables |
| Predictive ability | Shows problems after they occur | Forecasts final costs and completion dates |
| Status clarity | Can show "on budget" while behind schedule | Reveals true performance through integrated metrics |
Understanding how PV, EV, and AC interact is essential for real project insights. Each metric serves a specific purpose. Together, they show you exactly where your project stands. Let’s explore each using a consistent example: a corporate training platform rollout with $200,000 budget over four months.
Planned value: setting your baseline
Planned value establishes your performance measurement baseline before work begins. It’s time-phased, meaning it rises progressively as the project advances rather than appearing as a single total.
For the training platform project allocating $50,000 monthly, PV at Month two equals $100,000. This becomes your measuring stick for actual progress. Without this time-phased baseline, you can’t tell whether work’s ahead or behind schedule.
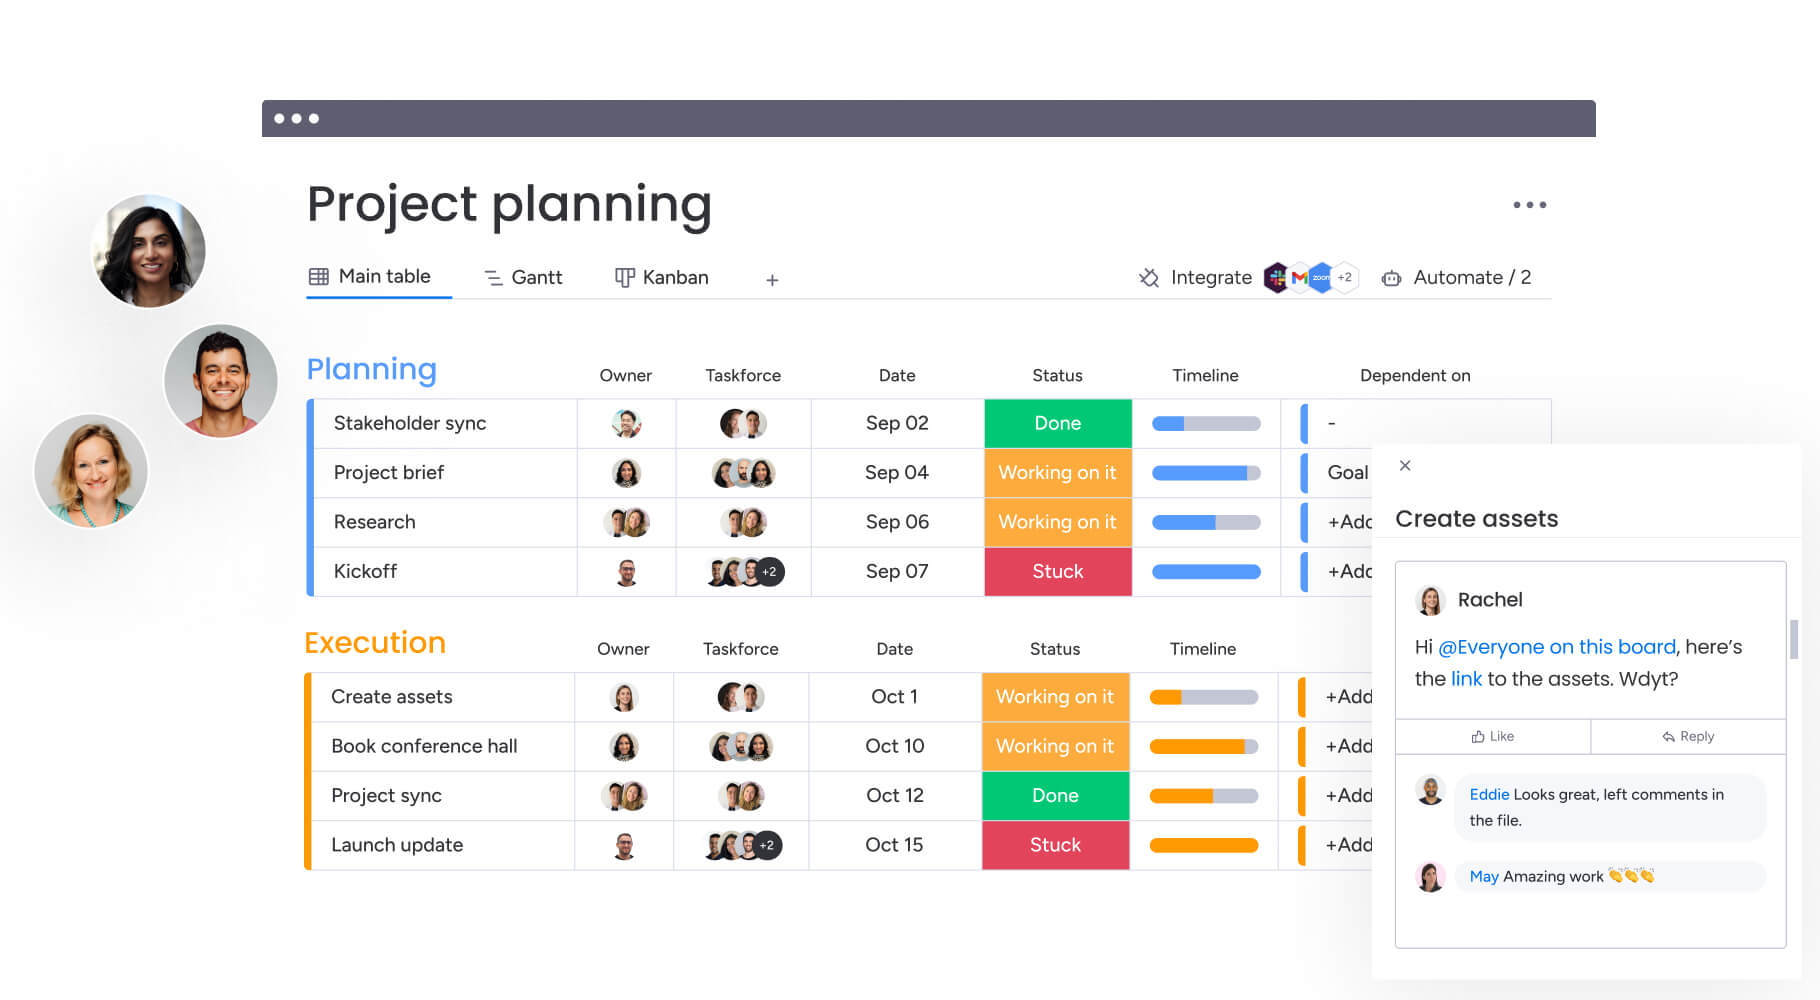
Organizations using monday work management automatically generate these baselines by mapping budgets to project timelines through Gantt charts and milestone tracking. This ensures all calculations are automated and accurate.
Earned value: measuring real progress
Earned value quantifies “done” in dollar terms, neutralizing optimism bias common in status reports. Calculate it by multiplying total budget by actual completion percentage.
By Month 2, if your team completes content development and system configuration representing 45% of total scope, EV equals $90,000 ($200,000 × 0.45). Despite 50% time elapsed (PV = $100,000), you’ve only “earned” $90,000 worth of value — revealing a $10,000 schedule variance that subjective reporting might miss.
Actual cost: tracking real spending
Actual cost captures all expenses incurred for completed work, including direct costs like labor and materials plus allocated overhead.
If unexpected licensing fees and consultant overtime push Month 2 spending to $110,000, you’re spending $110,000 to achieve $90,000 of value. This comparison immediately flags cost efficiency issues that need your attention.
How to calculate earned value in 4 steps
Calculating earned value transforms raw data into insights you can act on. The math is straightforward, but accuracy requires discipline and consistency. These four steps provide a structured path to implementing EVM calculations in any project.
Step 1: establish your performance baseline
Create your Performance Measurement Baseline by combining scope, schedule, and budget into a time-phased plan. Break down the total budget across the timeline, assigning specific values to milestones or work packages.
For a marketing campaign with $40,000 budget, you might allocate:
- Month 1: $10,000 for research and strategy.
- Month 2: $15,000 for content creation.
- Month 3: $15,000 for distribution and optimization.
This approved baseline becomes your S-curve for tracking performance as you execute.
Step 2: determine completion percentage
Measuring “percent complete” accurately is EVM’s biggest challenge. Subjective estimates skew your results. Choose objective measurement techniques that fit your work type:
- 0/100 rule: no credit until work is 100% complete (best for short deliverables).
- 50/50 rule: 50% credit when starting, remaining 50% upon completion.
- Weighted milestones: assign value to specific sub-deliverables.
- Physical measurement: use quantifiable units like “200 of 500 test cases executed”.
Step 3: calculate earned value
Once you know completion percentage, multiply by Budget at Completion (BAC):
EV = % Complete × BAC
Using the marketing campaign: If you’ve finished all research (100%) and half of content creation (50%):
- Research: 100% × $10,000 = $10,000
- Content: 50% × $15,000 = $7,500
- Total EV = $17,500
Update calculations weekly or monthly to maintain accurate project visibility.
Step 4: compare against planned and actual values
Comparing EV to PV and AC reveals real performance and lets you intervene early:
| Comparison | Result | Meaning | Action needed |
|---|---|---|---|
| EV < PV | Negative schedule variance | Behind schedule | Review resource allocation |
| EV > PV | Positive schedule variance | Ahead of schedule | Verify quality standards |
| EV < AC | Negative cost variance | Over budget | Investigate cost drivers |
| EV > AC | Positive cost variance | Under budget | Document efficiency gains |
Essential earned value formulas and what they reveal
Raw metrics only show you so much. These derived formulas give you predictive insights for strategic management, transforming basic measurements into intelligence that drives decisions.
Cost Performance Index (CPI)
Formula: CPI = EV ÷ AC
CPI measures financial efficiency: how much value you get per dollar spent.
- CPI > 1.0: under budget (getting more than $1 value per $1 spent).
- CPI < 1.0: over budget (getting less than $1 value per $1 spent).
- Example: CPI of 0.85 means you’re only generating $0.85 of value per dollar.
Schedule Performance Index (SPI)
Formula: SPI = EV ÷ PV
SPI measures schedule efficiency: how fast you’re progressing versus plan.
- SPI > 1.0: ahead of schedule.
- SPI < 1.0: behind schedule.
- Example: SPI of 0.90 means progressing at 90% planned speed.
Cost and Schedule Variance
Cost Variance: CV = EV – AC Schedule Variance: SV = EV – PV
These express deviations in dollar amounts rather than ratios:
- Positive values: under budget or ahead of schedule.
- Negative values: over budget or behind schedule.
Forecasting formulas
Three formulas help predict project outcomes based on current performance:
- Estimate at Completion (EAC) = BAC ÷ CPI
Forecasts total project cost if current performance continues. - Estimate to Complete (ETC) = EAC – AC
Predicts additional funding needed to finish. - Variance at Completion (VAC) = BAC – EAC
Projects final budget surplus or deficit.
Beyond calculations, EVM delivers strategic advantages that align execution with business goals. Here’s why mature organizations adopt this approach and how it transforms project oversight from reactive to proactive.
- Early warning system for budget overruns. a declining CPI trend in the first 20% of a project reliably indicates final cost overruns. This lets you intervene weeks before budgets are exhausted, preserving margins and giving you time to correct course.
- Data-driven decision making. EVM takes emotion out of critical decisions. Whether you’re considering scope reduction, resource reallocation, or project termination, decisions rest on objective CPI and SPI metrics instead of optimistic promises.
- Stakeholder trust through transparency. executives require visibility without complexity. EVM provides standardized reporting that shows you’re in control of project performance, building confidence and justifying future investments.
- Portfolio-wide performance comparison. large organizations can’t manage every project differently. EVM’s universal metrics let PMOs compare software project performance against construction project performance for consistent portfolio optimization.
“monday.com has been a life-changer. It gives us transparency, accountability, and a centralized place to manage projects across the globe".
Kendra Seier | Project Manager“monday.com is the link that holds our business together — connecting our support office and stores with the visibility to move fast, stay consistent, and understand the impact on revenue.”
Duncan McHugh | Chief Operations OfficerHow to implement EVM without overwhelming your team
Successful EVM implementation doesn’t require a sudden overhaul. This phased approach ensures adoption without burying teams in administrative overhead. The key? Build capability gradually while keeping team productivity and morale intact.
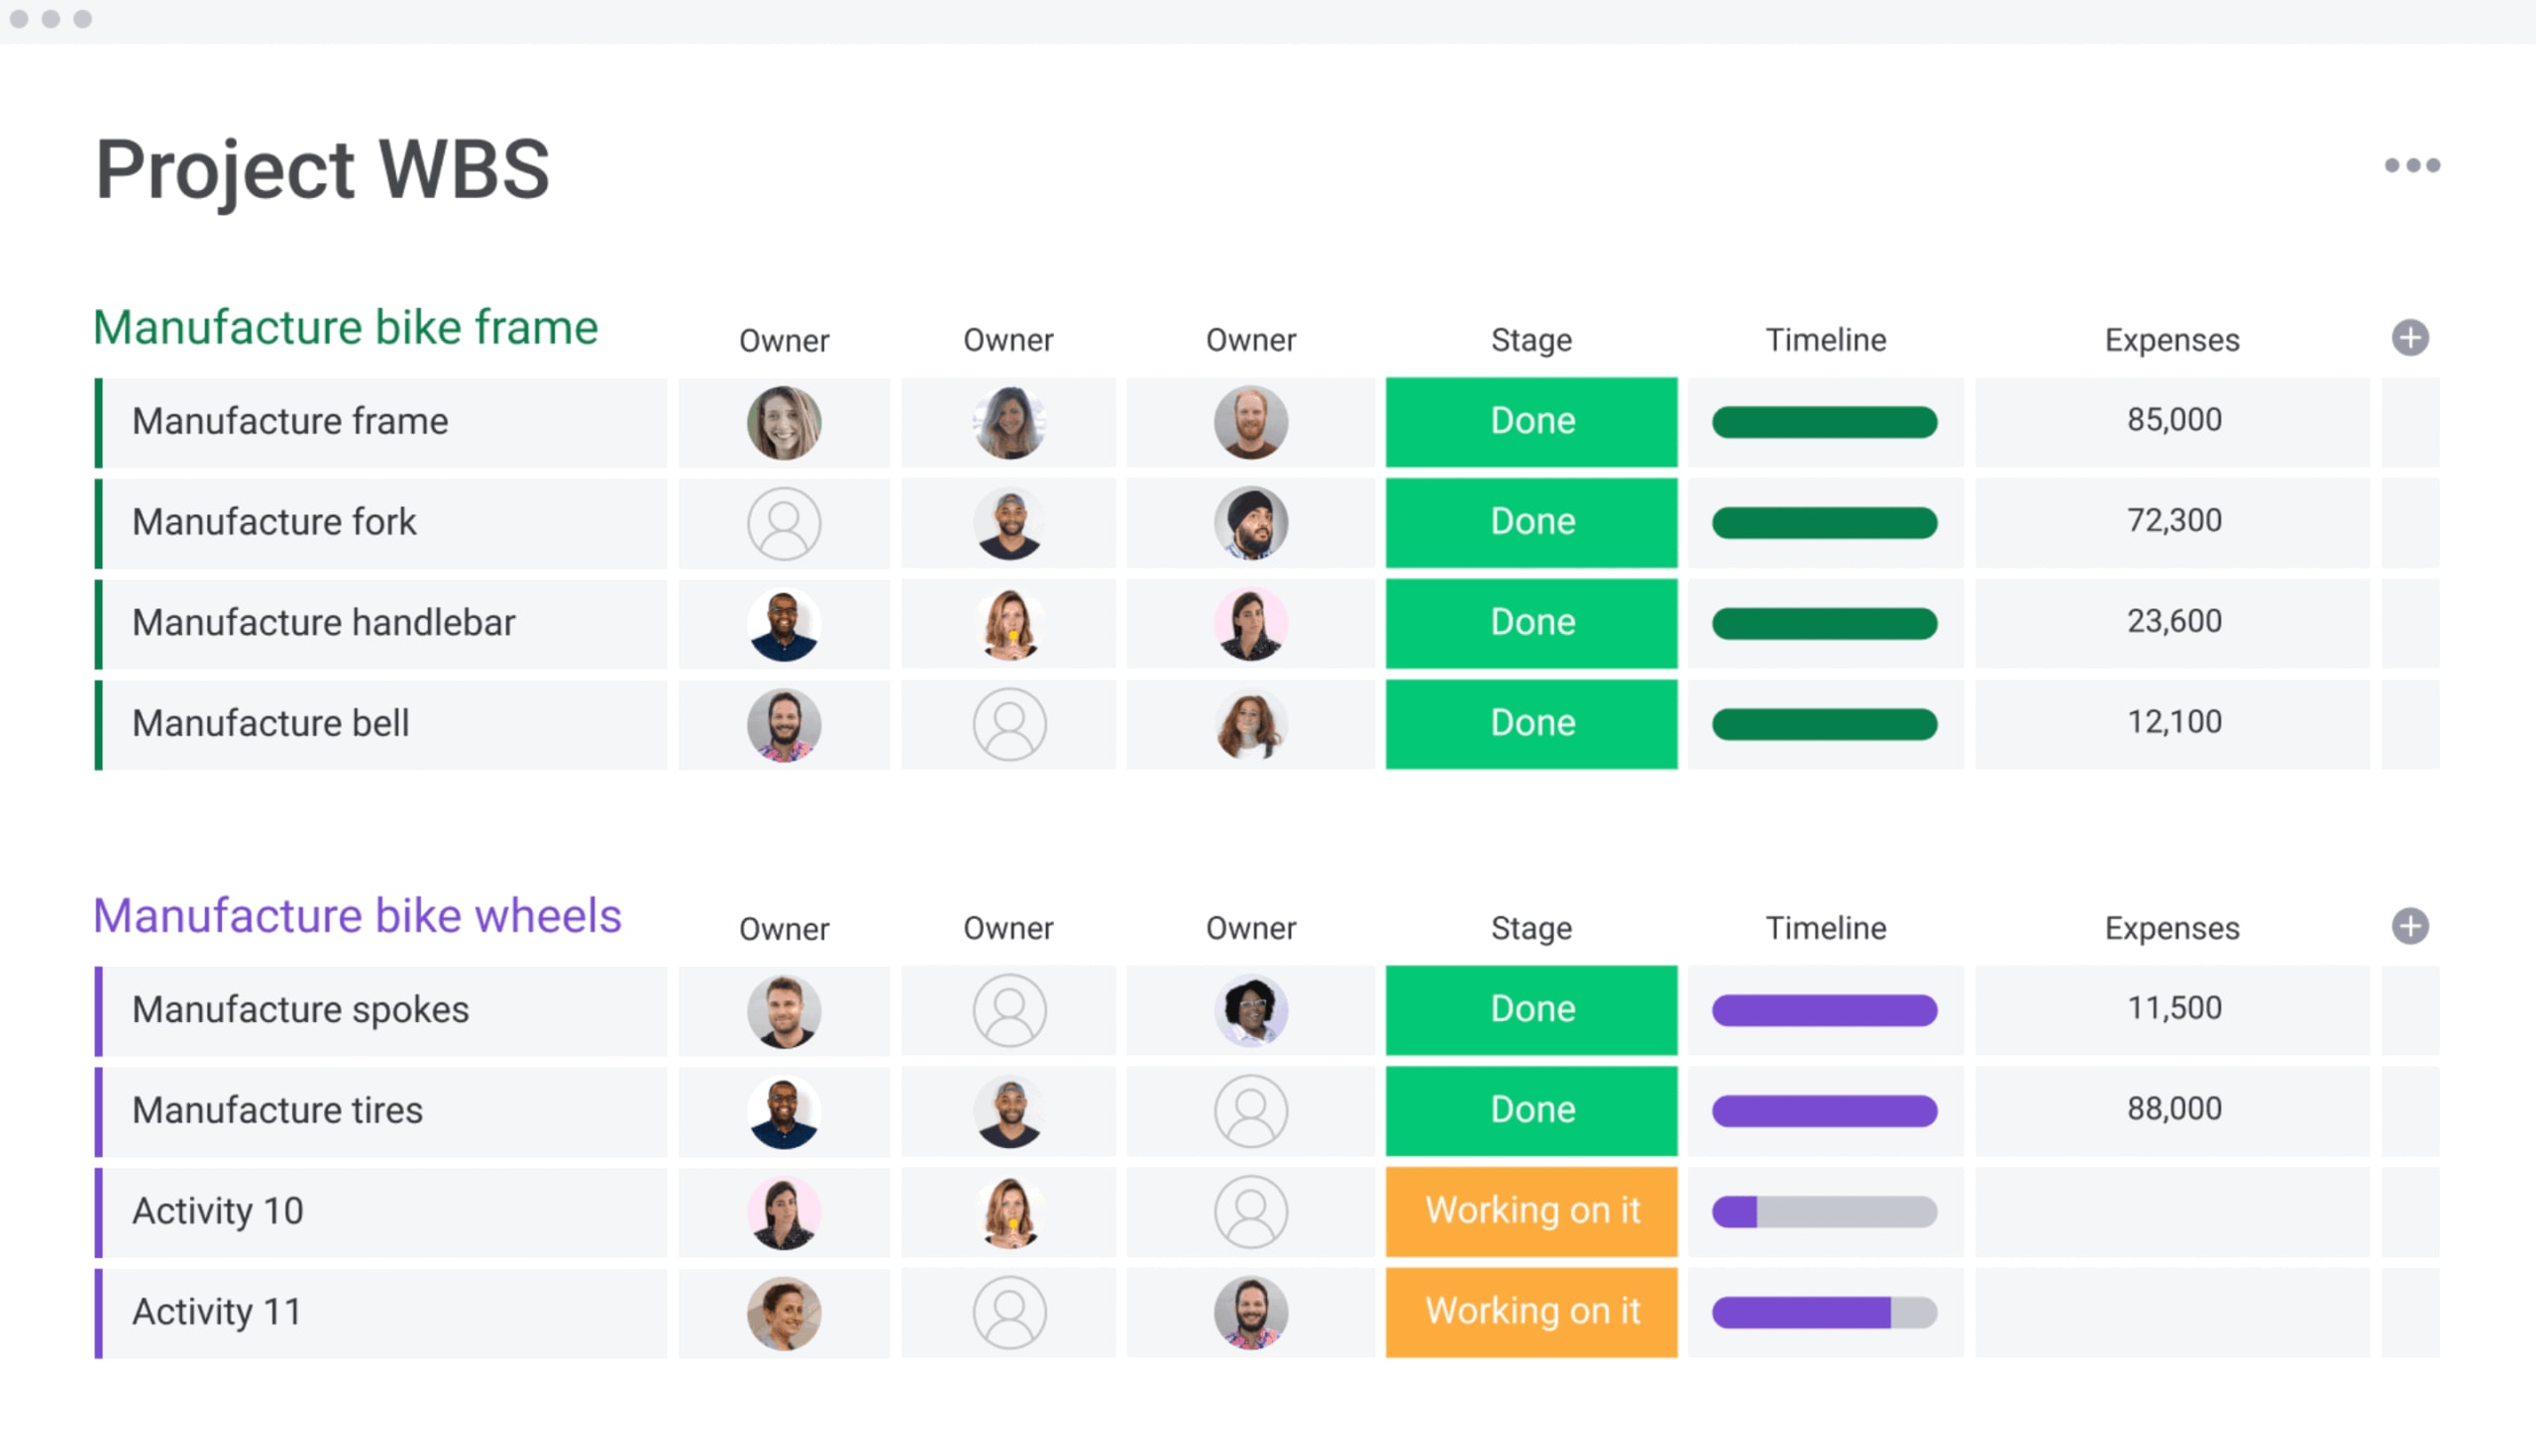
Build your work breakdown structure
The Work Breakdown Structure decomposes scope into manageable work packages. Each package needs well-defined deliverables and assigned budgets. Without granular WBS, you can’t assign PV accurately or measure EV objectively.
Define measurable completion criteria
To ensure accuracy, teams must agree on what “complete” means before starting. For software, it might mean “code written, tested, and deployed.” For marketing, it could be “content approved and published.” Specific criteria help teams drive work to full completion.
Start with essential metrics
Begin by tracking the core four: PV, EV, AC, and CPI. Once teams master these basics, introduce advanced metrics like EAC and TCPI. This gradual approach builds confidence without overwhelming users.
Automate data collection
Automating calculations improves accuracy and encourages team adoption. Successful implementation needs automation. Time tracking, financial systems, and project boards should integrate so AC and EV roll up automatically.
Teams using monday work management connect these data sources through integrations, keeping metrics current without manual entry. The platform’s automation engine triggers calculations as work progresses, turning static reports into real-time dashboards.
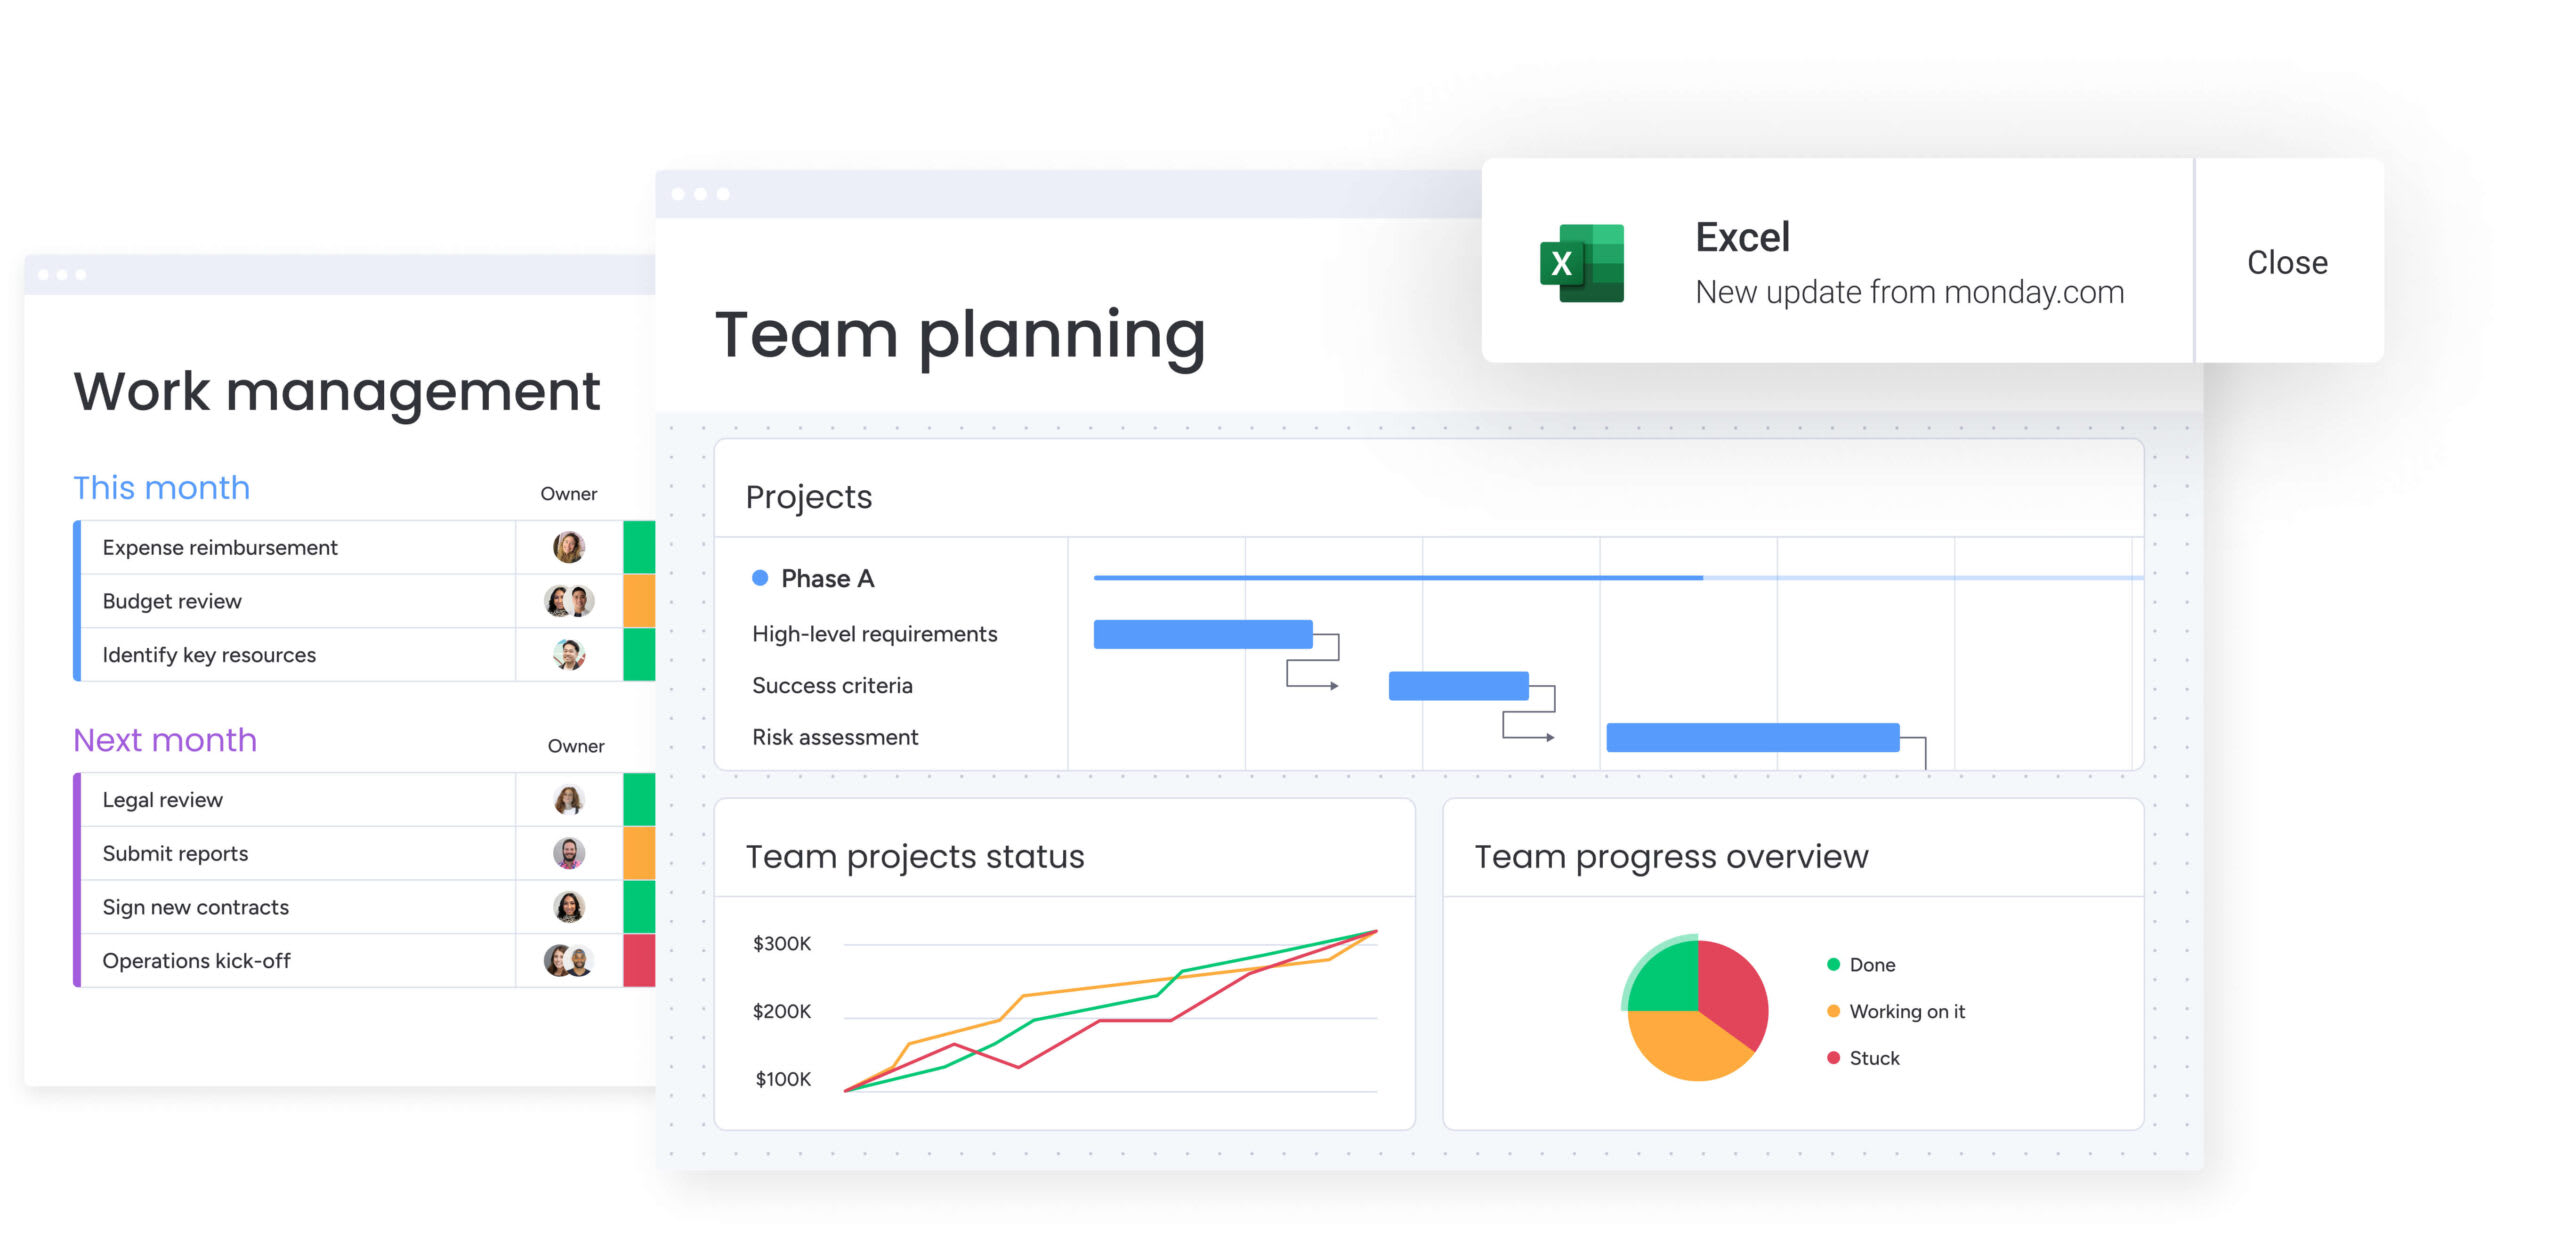
Create visual performance dashboards
Stakeholders need instant context, not data tables. Visual dashboards plotting S-curves for PV, EV, and AC communicate performance at a glance. A widening gap between EV and PV lines shows schedule slippage faster than any report.
The customizable dashboards on monday work management let teams build role-specific views. Project managers see the details while executives view high-level summaries, all from the same data.
Train teams on fundamentals
Adoption needs understanding. Teams need to know why precise tracking matters: like justifying resources or proving efficiency. Focus training on benefits rather than just mechanics.
When people see how EVM helps them succeed, resistance turns into engagement.
How AI transforms earned value tracking
Artificial intelligence shifts EVM from looking backward to predicting what’s ahead. AI addresses historic challenges of data accuracy and manual forecasting that limited adoption. It makes sophisticated analysis accessible to teams without specialized expertise.
Predictive performance forecasting
Traditional formulas assume future mirrors past. AI analyzes deeper patterns, incorporating team velocity, seasonal factors, and project complexity. An AI system might recognize that a CPI dip is temporary based on similar past projects, giving you more accurate EAC predictions.
Automated variance detection
AI continuously monitors metrics, flagging anomalies humans might miss. Intelligent systems alert managers when variance accelerates, not just when it crosses thresholds. This proactive approach catches issues while they’re still manageable.
The Portfolio Risk Insights feature in monday work management scans project boards continuously, categorizing risks by severity. Teams address potential problems before they impact baselines.
Seamless system integration
AI pulls data from multiple sources, correlating finance system cost spikes with specific work package delays. This automatic attribution keeps EVM data current without manual reconciliation, so decisions rest on real-time information.
Transform EVM from static reports to dynamic insights
Monthly status reports are becoming obsolete. Effective EVM lives in dynamic environments that enable immediate course correction. Teams can respond to changes as they happen instead of waiting for scheduled reviews.
Real-time performance visualization
Dynamic dashboards update instantly when work completes or costs post. This immediate feedback shows decision impact instantly. Add resources to a critical path item and see CPI effects instantly, not at month-end.
Executive-ready reporting
Role-based reporting from single data sources keeps everyone aligned without overwhelming leadership. While project managers analyze detailed variances per work package, executives see portfolio health scores rolled up.
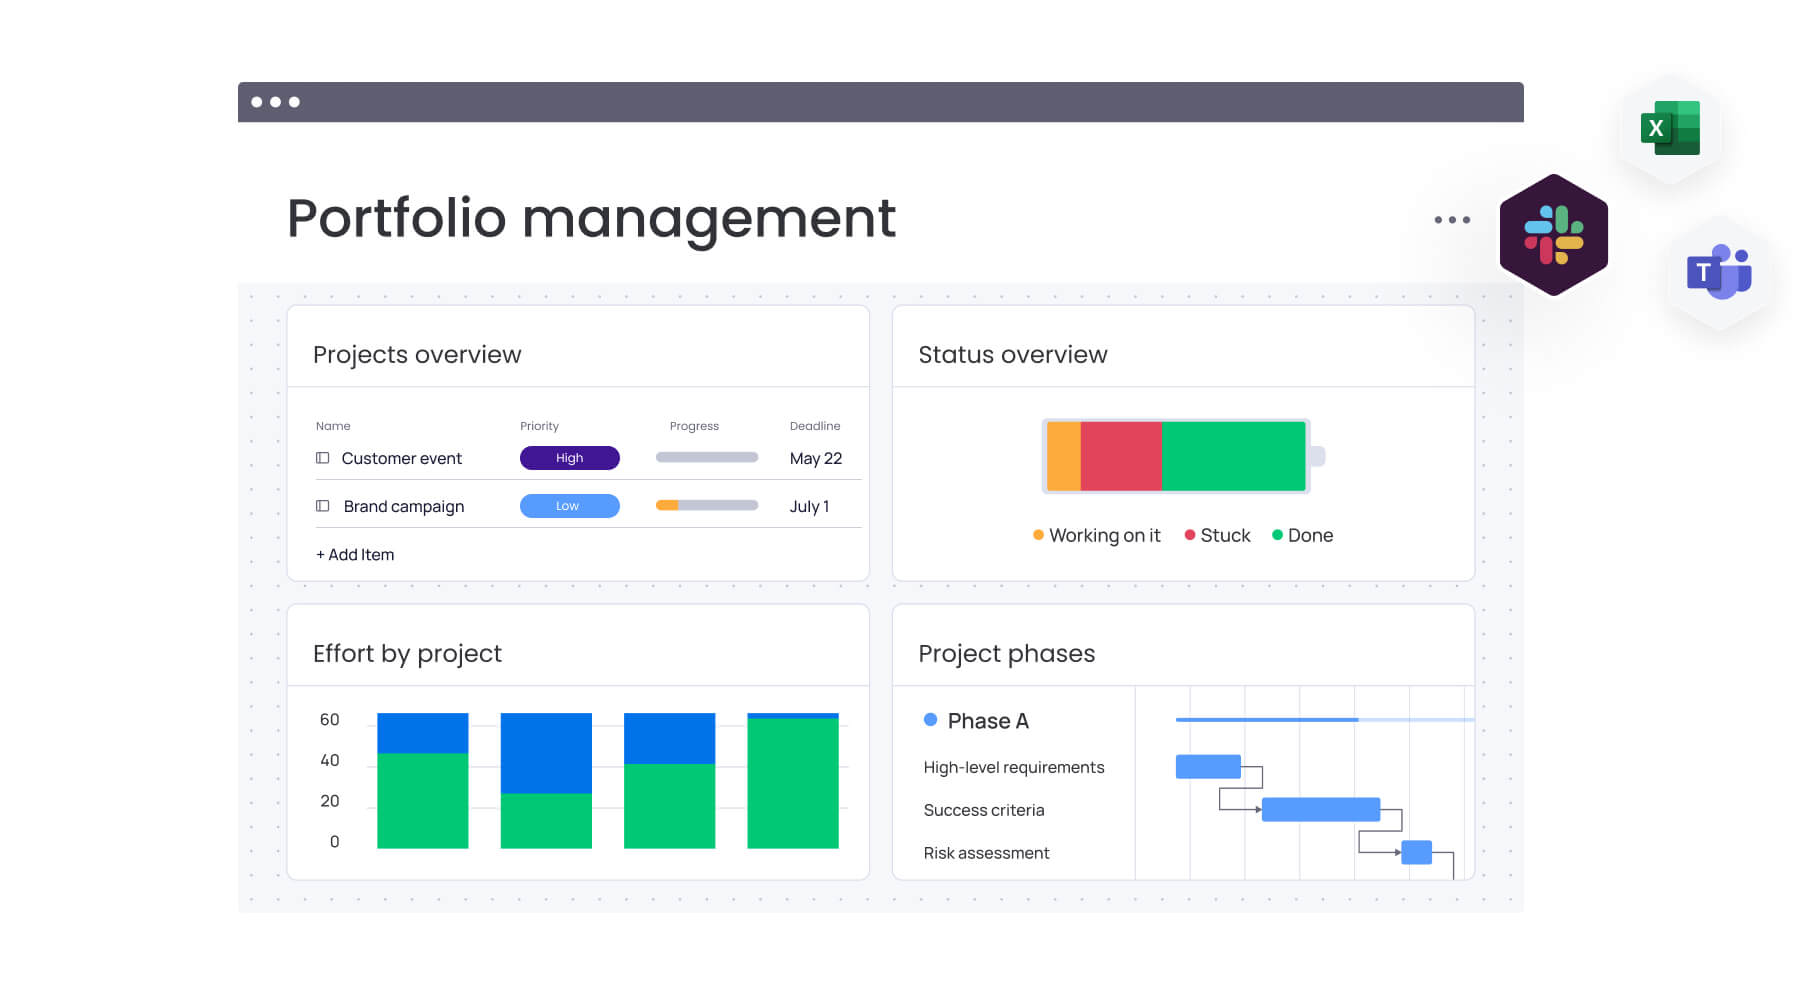
monday work management delivers this multi-level visibility through customizable views and permissions. Finance sees cost details, operations tracks resource utilization, and leadership monitors strategic alignment. All from the same project data.
Cross-department transparency
Shared dashboards eliminate silos. When engineering delays are instantly visible to marketing teams planning launches, adjustments happen automatically. This visibility connects everyday work to business goals across all projects and processes.
Maximize project performance with intelligent EVM today
Earned value management transforms project oversight from guesswork into decisions backed by data. The methodology provides early warning systems that catch problems while they’re still manageable, so teams can deliver on time and within budget consistently.
The key to successful EVM is automation and integration. By automating calculations, you increase accuracy and adoption, making advanced analysis accessible to every team member. When your project data flows between systems automatically, EVM becomes a natural part of daily workflows instead of an administrative burden.
monday work management simplifies this shift by building EVM principles directly into project workflows. The platform automates data collection, generates real-time insights, and provides role-based dashboards that keep everyone aligned on project performance.
Teams focus on delivering value while the system handles the complex calculations behind the scenes.
Frequently asked questions
How do you calculate earned value in project management?
Earned value is calculated by multiplying the percentage of work completed by the total project budget (EV = % Complete × Budget at Completion). For example, if you've completed 40% of a $100,000 project, your earned value equals $40,000.
What's the difference between earned value and planned value?
Planned value is the authorized budget for work scheduled to be complete by a specific date, while earned value is the budget value of work actually completed by that date. PV tells you what should be done; EV tells you what is done.
What is a good Cost Performance Index (CPI)?
A CPI of 1.0 indicates you're exactly on budget. Values above 1.0 mean you're under budget and getting more value per dollar spent. Values below 1.0 indicate overspending. Most organizations target CPI between 0.95 and 1.05.
Can earned value management work with agile methodologies?
Yes, Agile teams adapt EVM by using story points or sprint velocity instead of traditional hours. They measure earned value at sprint boundaries, tracking completed user stories against planned story points to maintain performance visibility.
How does earned value help identify project risks early?
Earned value provides early warning through trend analysis. A steadily declining CPI or SPI in early project phases predicts future problems, allowing intervention before issues become critical. This predictive capability transforms reactive management into proactive control.
What's the main benefit of automating earned value calculations?
Automation eliminates manual data entry errors, provides real-time performance visibility, and frees project managers from spreadsheet maintenance. Teams using automated EVM spend more time analyzing insights and taking corrective action rather than calculating metrics.