You’re three weeks into a major product launch when the finance team drops the news: you’re 30% over budget. The work is getting done, deadlines are being met, but somehow the money disappeared faster than anyone expected. Sound familiar?
This happens everywhere because teams track progress and spending separately — never connecting the two until it’s too late. Cost variance closes that gap. It measures the financial difference between planned spending and actual spending for completed work. It’s more than expense tracking. It shows whether your projects deliver value efficiently — or just burn cash.
In this helpful article, you’ll learn the cost variance formula and see how to calculate it in practice. We’ll explore why both positive and negative variances matter and what causes budget deviations. You’ll also discover how the right work management platform can turn spreadsheet tracking into real-time financial intelligence.
Key takeaways
- Calculate cost variance weekly to catch budget problems early: use the formula CV = Earned Value – Actual Cost to spot overspending before it becomes a crisis.
- Focus on variance percentage, not just dollar amounts: a $5,000 overrun means different things on a $50,000 versus $500,000 project — percentages reveal true impact.
- Track five variance types for complete budget visibility: monitor material, labor, overhead, fixed, and variable costs separately to pinpoint exactly where money goes off track.
- Automate variance tracking with monday work management: real-time dashboards and AI-powered insights replace manual spreadsheets, giving you instant budget health across all projects.
- Set clear variance thresholds to trigger action: treat ±5% as healthy, investigate at ±10%, and take immediate action beyond ±15% to prevent budget disasters.
Cost variance (CV) shows the financial gap between planned spending and actual spending at any point in your project. NASA’s official definition states that “Cost variance (CV) = Earned Value – Actual Cost”, providing the foundational formula used across government and industry projects. It tells you whether you’re over or under budget — plain and simple.
Think of it this way: you established a project budget of $50,000 for a marketing campaign. Halfway through, you’ve spent $30,000 but only completed 40% of the work. That gap between planned and actual spending reveals your cost variance — and signals you’re heading for trouble.
Cost variance does more than track expenses. It connects spending to progress, showing whether your project’s financially healthy or heading for trouble.
Why tracking cost variance matters
Track cost variance consistently and you’ll stop firefighting — you’ll manage proactively instead. Here’s what changes:
- Early detection: you catch budget issues while they’re still small.
- Resource optimization: you can reallocate resources before problems cascade.
- Stakeholder confidence: you maintain trust by demonstrating financial control.
Without cost variance tracking, minor overspends compound into major overruns. Teams discover problems too late to fix them. Projects that seemed on track suddenly need emergency funding or scope cuts.
Cost variance vs schedule variance
Cost variance and schedule variance work together to show complete project health. Track both and you’ll make smarter calls about resources, timelines, and priorities.
| Aspect | Cost variance | Schedule variance |
|---|---|---|
| Focus | Budget performance | Timeline performance |
| Measures | Earned value minus actual cost | Earned value minus planned value |
| Reveals | Whether you're spending efficiently | Whether you're delivering on schedule |
| Action triggered | Budget adjustments or scope changes | Resource reallocation or timeline shifts |
As the table above indicates, these metrics affect each other constantly. A project behind schedule might accelerate spending to catch up, creating negative cost variance. Or efficient execution might deliver ahead of schedule while staying under budget.
The cost variance formula shows your financial position instantly. Here’s how it works.
CV = EV – AC
Where:
- EV (Earned Value): the budgeted cost of work actually completed.
- AC (Actual Cost): the real amount spent to complete that work.
Let’s say you’re developing a new product feature budgeted at $20,000. You’ve completed the work (EV = $20,000) but spent $23,000 (AC = $23,000). Your cost variance is -$3,000, indicating you’re over budget.
Understanding your results:
- Negative variance: over budget — work costs more than planned.
- Positive variance: under budget — work costs less than planned.
- Zero variance: exactly on budget.
Calculating cost variance percentage
Raw numbers don’t tell the whole story across different project sizes. Percentages make comparisons easier:
CV% = (CV ÷ EV) × 100
That $3,000 overrun on a $20,000 task equals -15% variance — a significant deviation requiring immediate attention. The same overrun on a $200,000 project represents just -1.5%, likely within acceptable limits.
Most organizations treat ±5% as healthy. Anything beyond ±10% needs a formal review. This threshold becomes even more critical given that supply-chain disruptions can put 10–20% of cost of goods sold at risk across various scenarios, making proactive variance monitoring essential for financial stability.
Using the Cost Performance Index
The Cost Performance Index (CPI) turns variance into an efficiency ratio:
CPI = EV ÷ AC
| CPI value | What it means | Project status |
|---|---|---|
| 1 | Breaking even | On budget |
| Above 1.0 | Getting more value per dollar | Under budget |
| Below 1.0 | Getting less value per dollar | Over budget |
| Below 0.85 | Serious inefficiency | Critical risk |
For example, a CPI of 0.87 means you’re getting 87 cents of value for every dollar spent. This metric predicts whether your current spending will bust the budget before the project ends.
How to calculate cost variance in 4 steps
Accurate cost variance calculation needs clean data and consistent analysis. Follow these steps below for reliable results and smarter decisions.
Step 1: cetermine earned value
Start by quantifying actual progress using planned value as your baseline. Multiply your task’s total budget by its completion percentage. But accuracy matters. Overestimate completion and everything else gets skewed.
Two measurement approaches work well:
- Milestone-based: credit given only when specific deliverables are 100% complete.
- Weighted progress: break work into measurable chunks and track completion of each.
For a $10,000 website redesign that’s 60% complete, your earned value equals $6,000.
Step 2: cocument actual costs
Track every dollar spent on completed work. That means tracking all project expenses in one place:
- Labor costs: hours worked times hourly rates for all team members.
- Materials: software licenses, stock photos, hosting fees.
- Overhead: allocated portion of shared resources and tools.
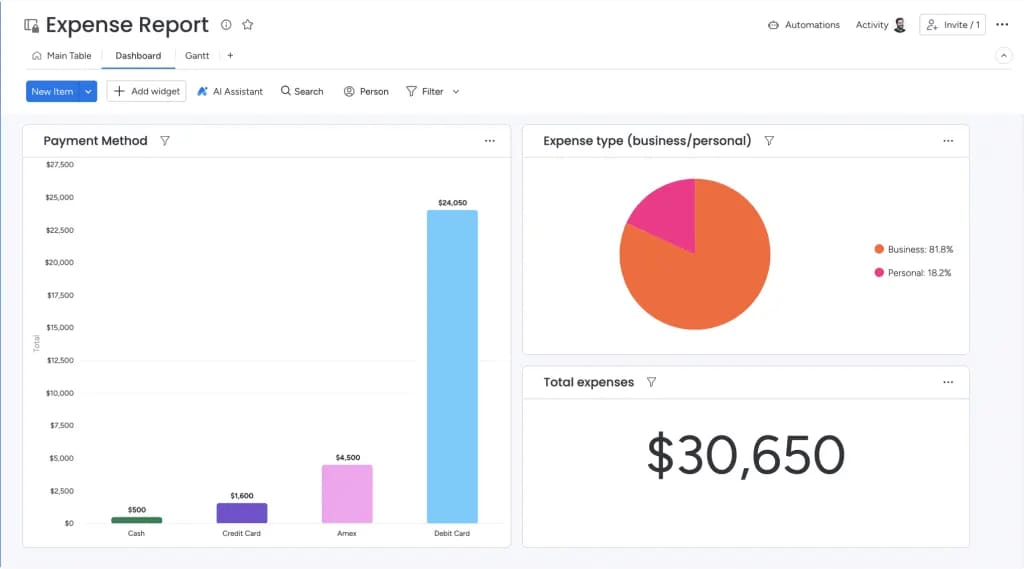
Organizations using intelligent platforms like monday work management can pull this data directly from project boards where time tracking and budget columns capture spending in real time for earned value management.
Recent research even shows that organizations using generative AI in complex workflows report an average cost reduction of roughly 20%, demonstrating how automated systems can significantly improve cost management efficiency.
Step 3: apply the formula
Once you have clean data, the math’s simple:
If your website redesign shows:
- Budget: $10,000.
- Progress: 60% complete (EV = $6,000).
- Actual spend: $7,500.
Then CV = $6,000 – $7,500 = -$1,500.
You’re $1,500 over budget for the work completed.
Step 4: interpret and act
Your -$1,500 variance is a -25% deviation, way beyond acceptable limits. So, what should you do next?
- Minor variances (±5%): monitor but don’t intervene.
- Moderate variances (±10%): investigate causes and adjust upcoming work
- Major variances (>15%): immediate action required — pause work, reallocate resources, or request additional budget.
Understanding positive and negative variance
Both positive and negative variances need a closer look. Negative variance means overspending. But positive variance can signal corner-cutting or reduced scope — both worth investigating.
| Variance type | Meaning | Common causes | Required actions |
|---|---|---|---|
| Positive (+) | Under budget | Efficient execution, negotiated discounts, reduced scope | Verify quality standards met, analyze for replication, consider adding value |
| Negative (-) | Over budget | Scope creep, estimation errors, rework, resource inefficiency | Investigate root causes, implement controls, reforecast completion |
A software team discovers a security flaw requiring 50 hours of unplanned work. Actual costs spike while earned value stays flat, creating negative variance.
Meanwhile, a marketing team negotiates 20% off media rates. Earned value stays constant but actual costs drop, generating positive variance.
5 types of cost variance to track
Break variance into categories and you’ll see exactly where budgets go off track — and how to fix them. Each type needs its own monitoring approach and fix.
Material cost variance
This tracks the gap between planned and actual material costs. Supply chain disruptions, quality upgrades, or quantity changes drive these variances.
Construction and manufacturing projects see this frequently when commodity prices fluctuate or specifications change mid-project.
Labor cost variance
Labor variance splits into two components:
- Rate variance: paying different hourly rates than planned.
- Efficiency variance: taking more or less time than estimated.
When senior staff cover junior roles or tasks take longer than expected, labor costs balloon quickly.
Overhead variance
Overhead includes indirect costs supporting your project — facilities, administration, shared tools. Variances emerge when projects extend beyond planned timelines, absorbing more overhead than budgeted.
Fixed cost variance
These should remain stable — software subscriptions, equipment rentals, insurance. Variances occur when:
- Contracts renew at higher rates.
- New tools become necessary.
- Fixed resources need unexpected upgrades.
Variable cost variance
Variable costs scale with activity — cloud computing and management fees, contractor hours, shipping costs. They’re highly sensitive to scope changes and require close monitoring to prevent rapid escalation.
Common causes of cost variance
Cost variance rarely comes out of nowhere. In most projects, budget overruns follow familiar patterns that repeat across teams, industries, and project types. When you understand what typically causes costs to drift, you can spot warning signs early and take corrective action before small deviations turn into serious budget issues.
This section breaks down the most common sources of cost variance, from estimation errors and scope changes to productivity shifts and external pressures. These are not edge cases. They’re the everyday realities of project execution, and recognizing them is the first step to keeping budgets under control.
Estimation errors
Teams underestimate complexity and time because of optimism bias. Use historical data and three-point estimation (best, worst, likely) for more realistic baselines.
Scope changes
Informal scope additions consume resources without budget adjustments. Every “quick addition” compounds into significant variance.
Change control processes make sure new requirements include budget updates.
Resource price fluctuations
Market conditions affect labor rates, material costs, and vendor pricing. Long-term contracts and rate locks protect you from market swings.
Timeline impacts
Delays create overhead accumulation while acceleration requires overtime or rush fees. Both destroy budgets.
Build buffers into your schedule to avoid timeline-driven variance.
Productivity variations
Team performance varies based on experience, tools, and working conditions. Skills gaps, inadequate tools, or poor processes reduce output per dollar spent.
Track velocity and you’ll catch productivity issues before they wreck your budget.
External factors
Regulatory changes, economic shifts, or supplier issues create unavoidable variances. You can’t prevent these, but contingency reserves give you a financial cushion when they hit.
Try monday work management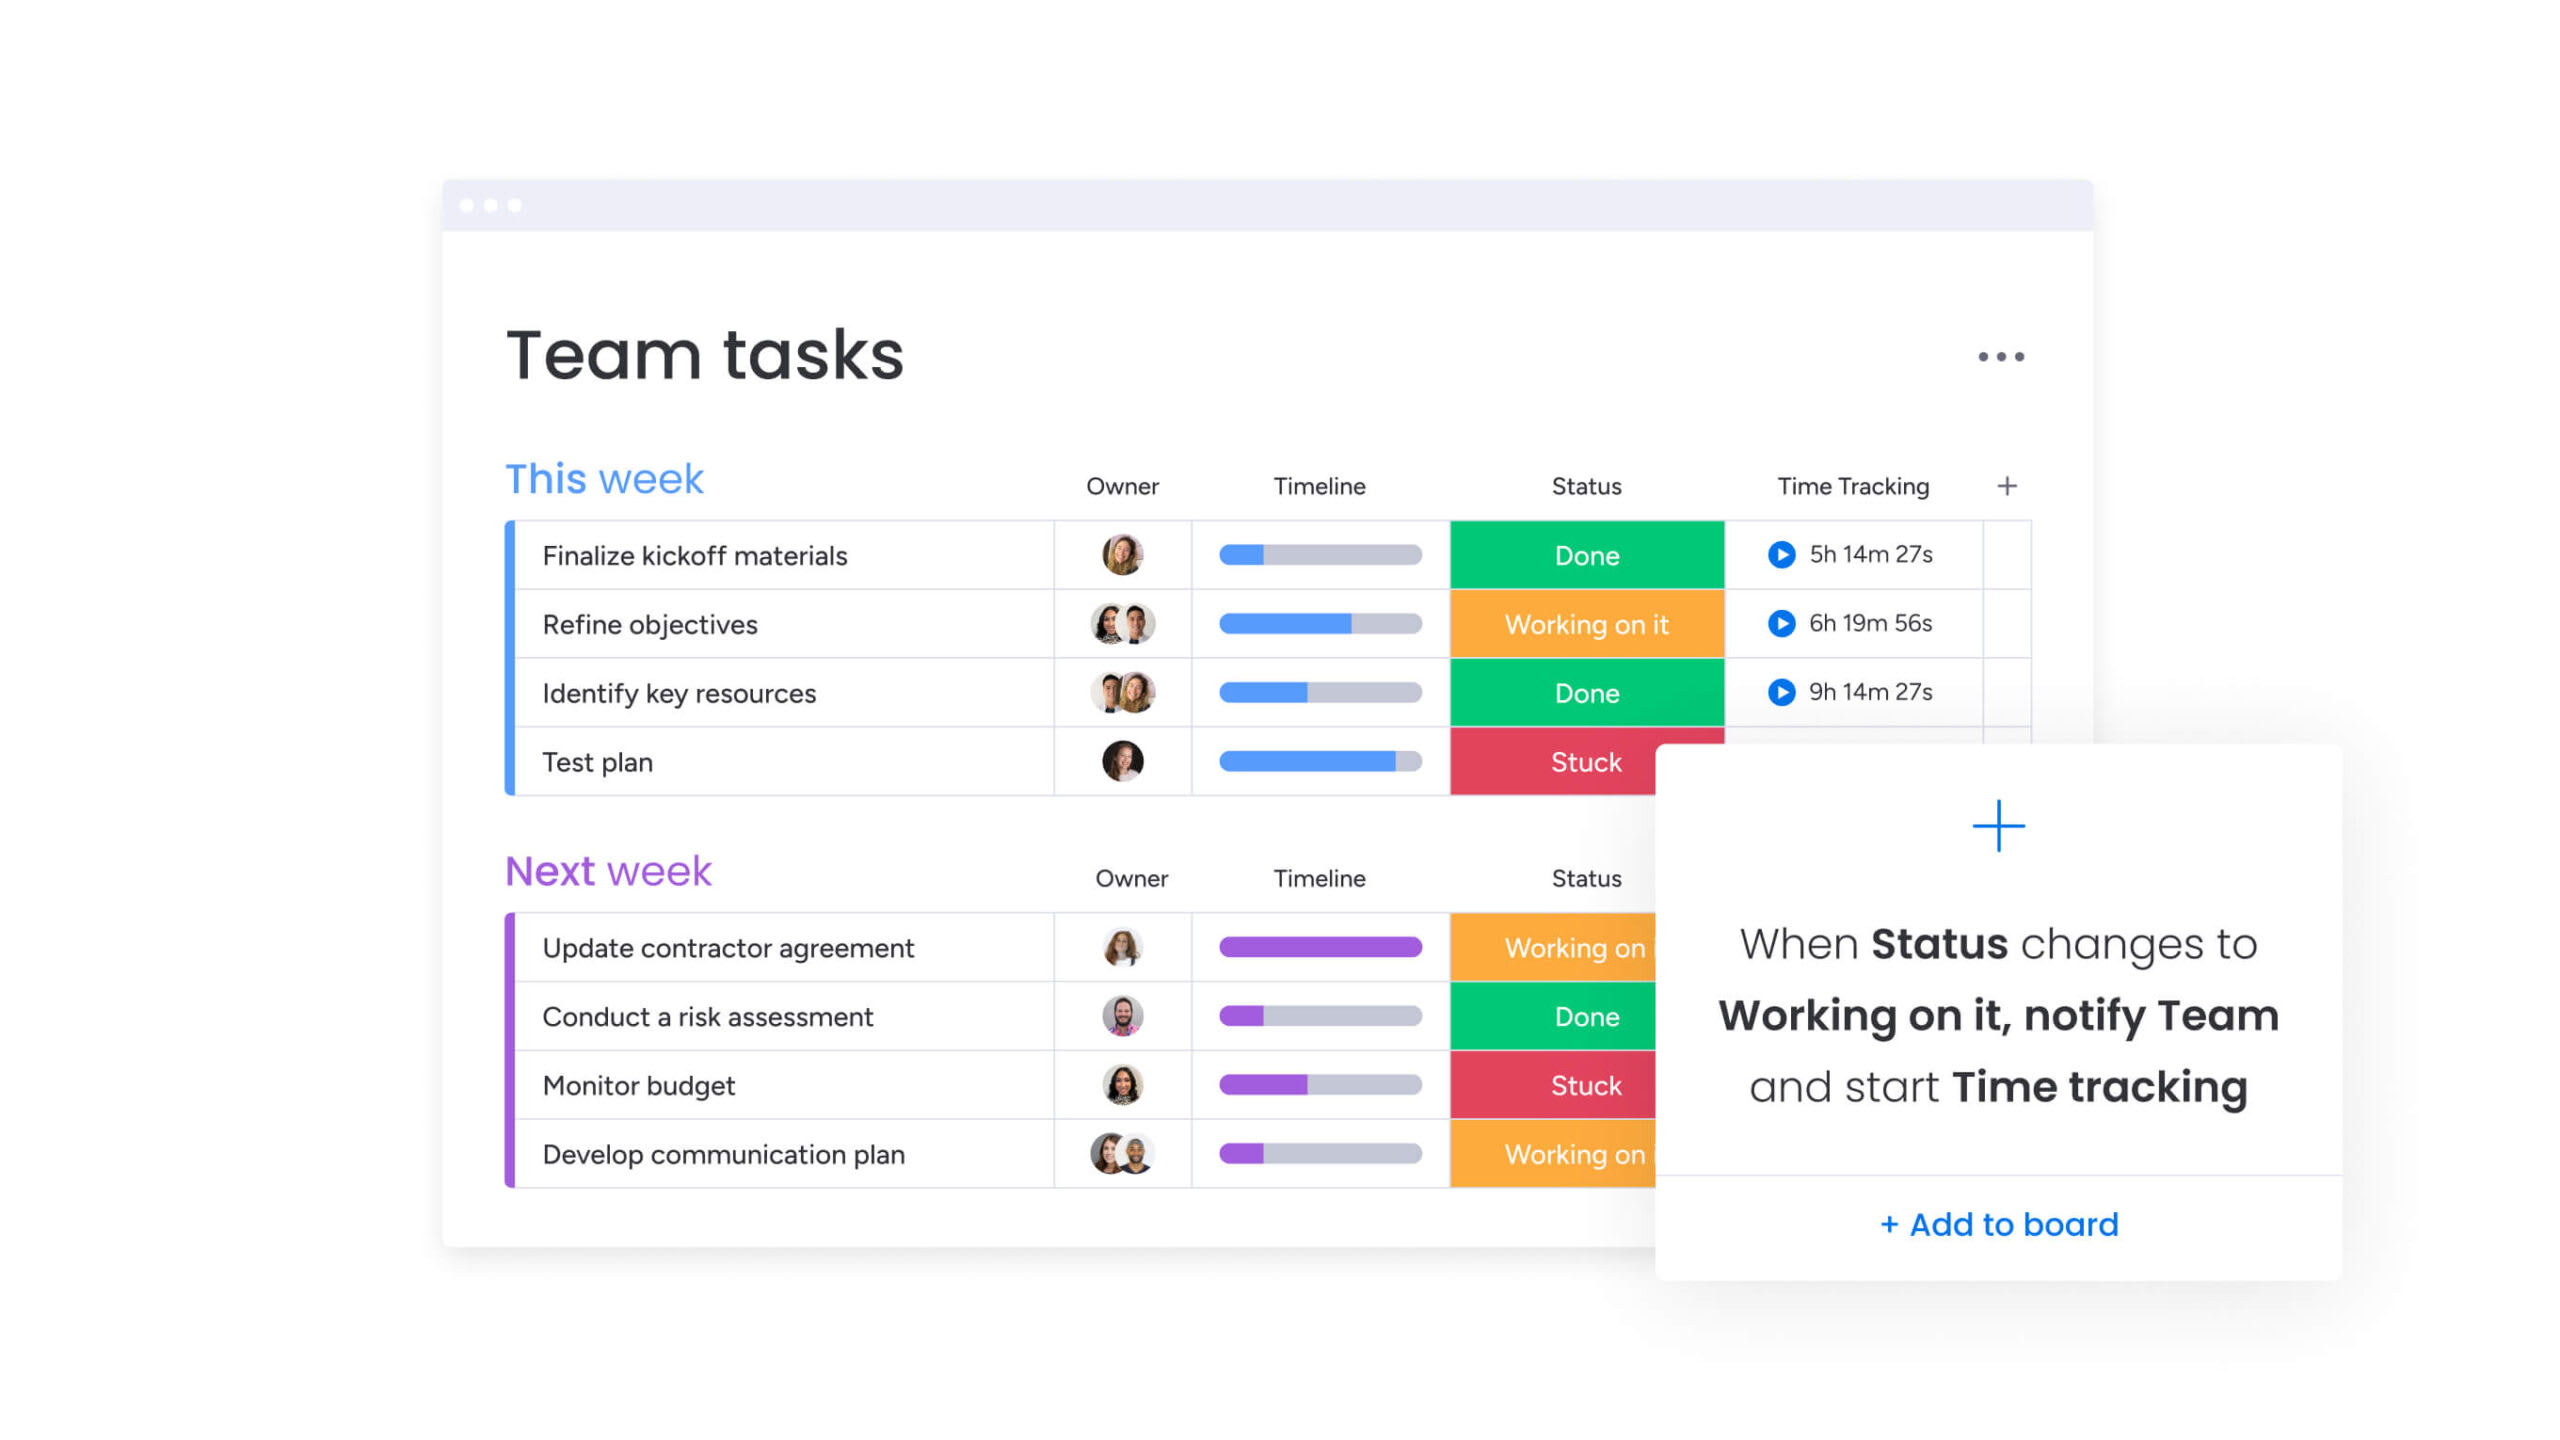
Methods for tracking variance at scale
Manual tracking works for one project. It falls apart when you’re managing multiple. These approaches scale across multiple projects and give leaders the visibility they need.
Cumulative analysis
This method tracks total variance from start to finish, smoothing out short-term swings to show the bigger trend. If your cumulative variance line consistently trends negative, the project has structural budget problems requiring intervention.
Period-by-period tracking
Isolating variance within specific timeframes — weekly sprints, monthly cycles — pinpoints exactly when problems emerged. This detailed view connects variances to specific events, so you can fix problems fast.
Variance at Completion forecasting
VAC projects your final budget position based on current performance:
VAC = Budget at Completion – Estimate at Completion
This answers the executive question: “Where will we end up if nothing changes?” It turns reactive reporting into strategic planning.

Automated variance tracking provides fast, accurate, and comprehensive financial insights. It transforms how you manage project budgets. You get real-time insights and predictive capabilities.
Real-time monitoring updates variance calculations instantly when teams log time or expenses. No more monthly surprises — you see budget health in real time. Issues surface immediately, so you can make small fixes before big problems hit.
AI goes one step further — it predicts variances before they happen. Machine learning spots patterns across past projects and flags risks weeks ahead. Teams stop documenting problems and start preventing them.
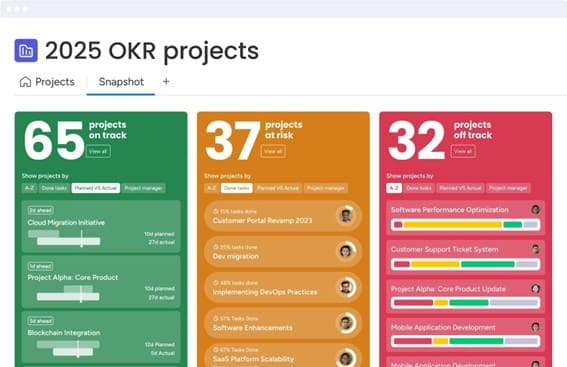
Portfolio visibility rolls up variance across all projects into executive dashboards. Leaders see which departments consistently run over budget and where profitable projects subsidize struggling ones. This system-wide view lets you allocate resources strategically instead of firefighting project by project.
Transform variance tracking with monday work management
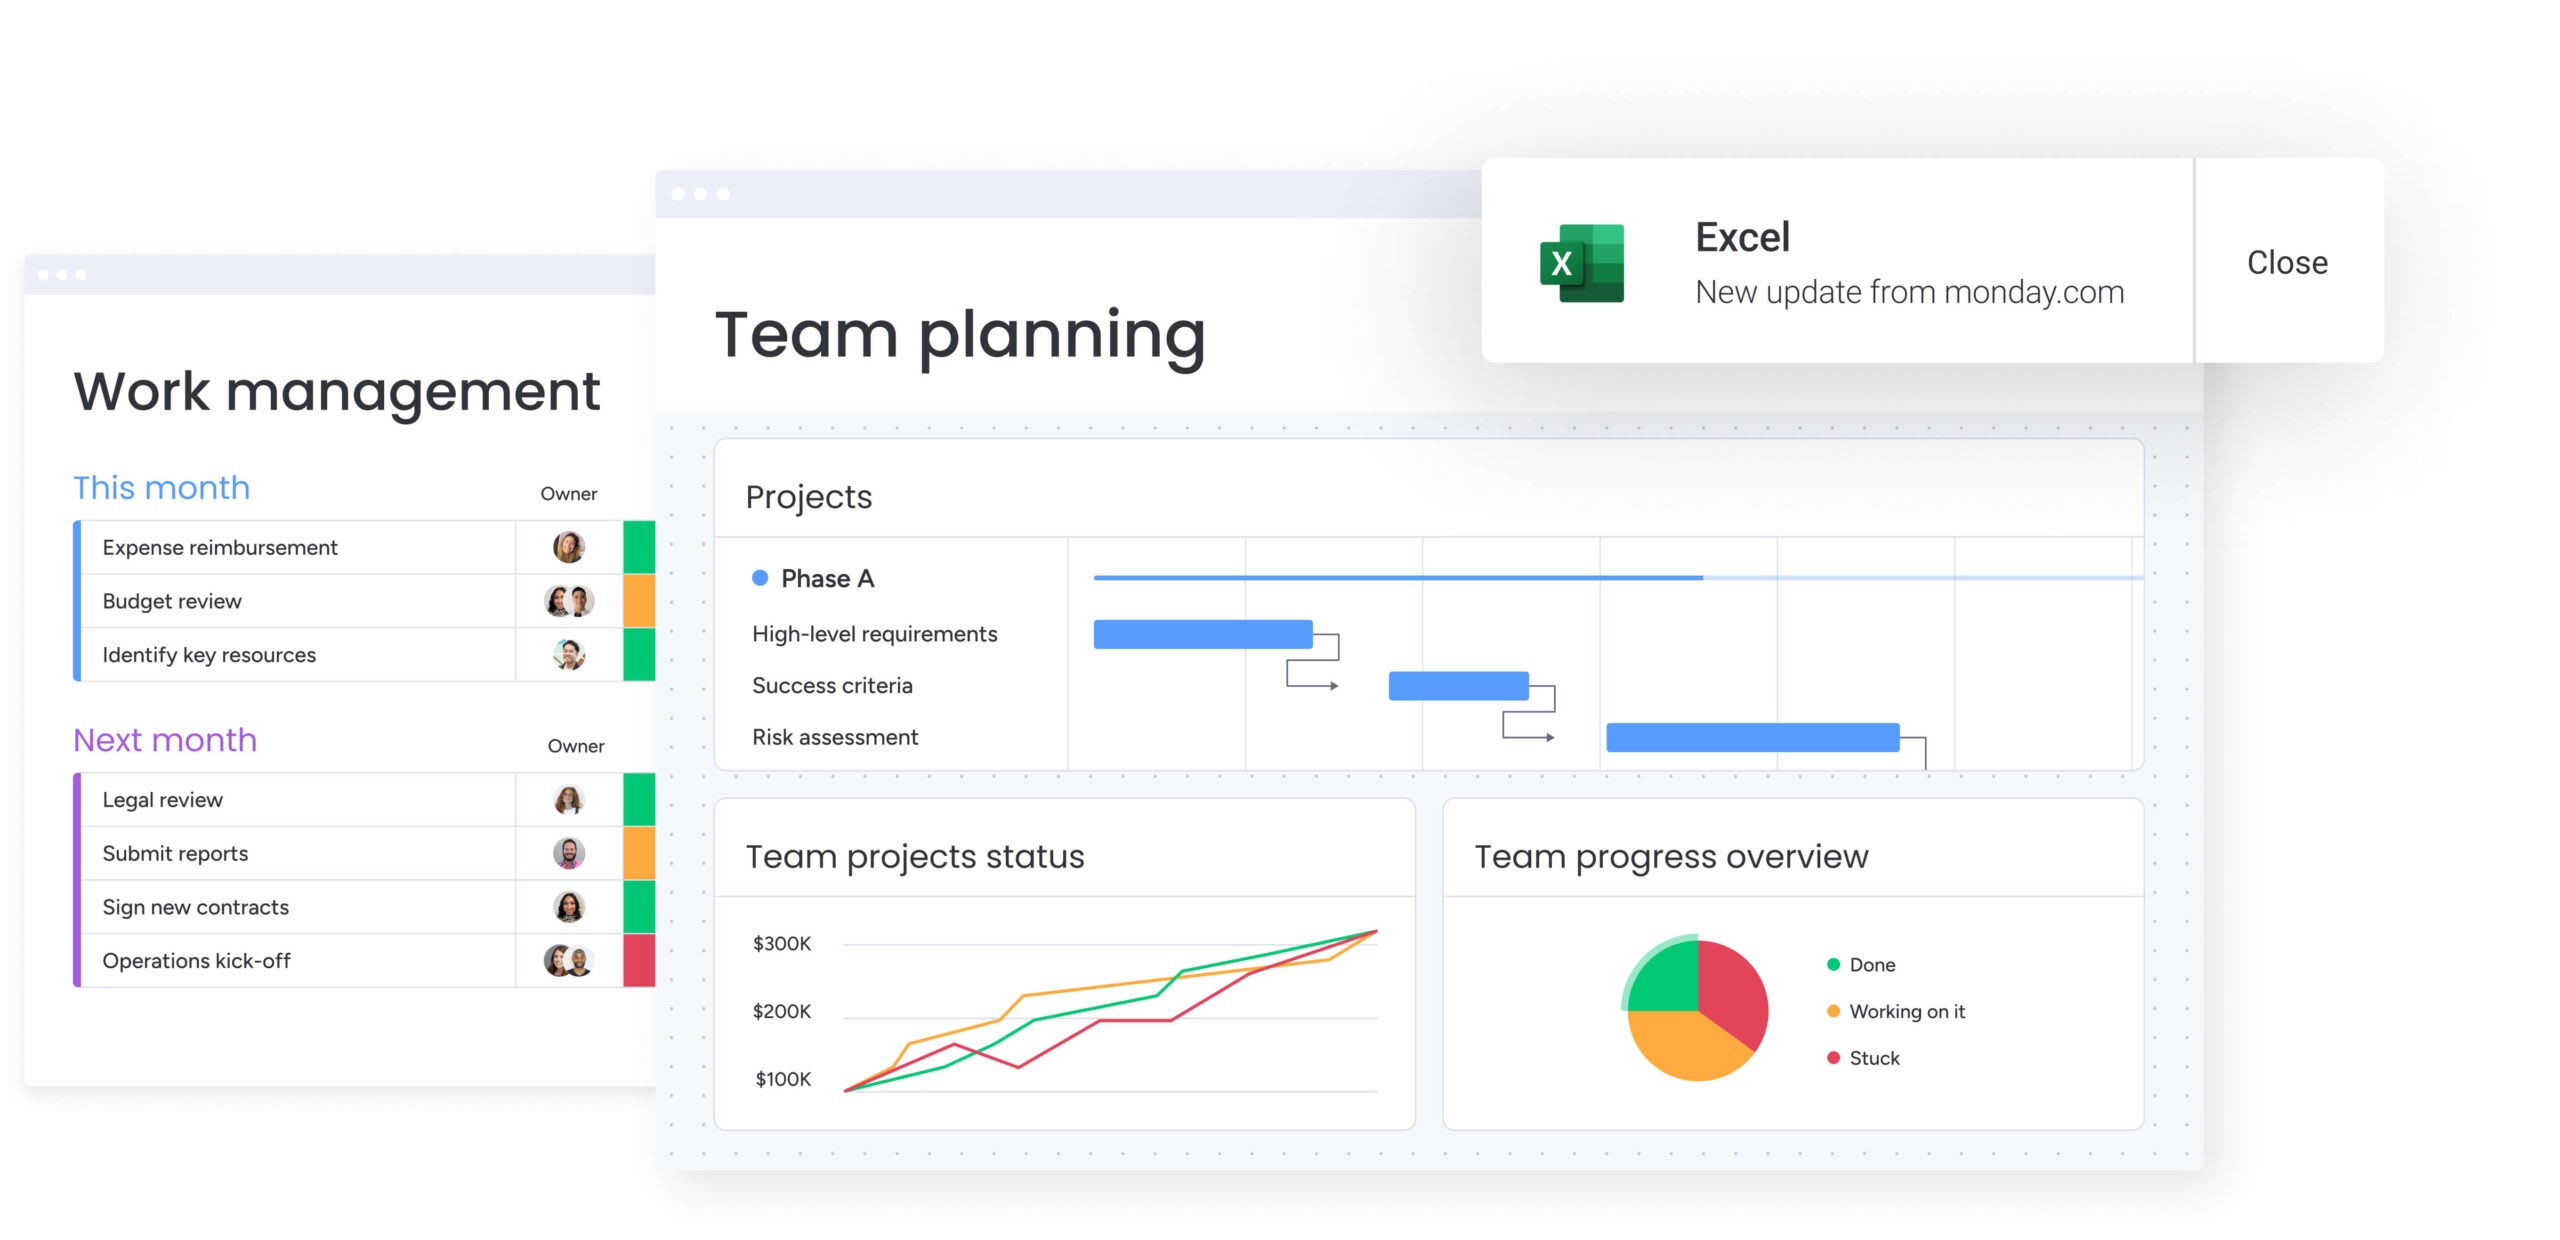
Modern and advances solutions like monday work management puts cost variance management right in your daily workflow. All your financial data is centralized and reports are generated automatically. Variance tracking happens automatically on your project boards.
The intuitive platform handles variance management through integrated features:
- Real-time tracking: dashboards visualize planned versus actual spending instantly, with data flowing directly from project boards.
- Automated calculations: formula columns compute CV, CV%, and CPI automatically as data updates.
- Integrated workflows: connect budget data with your existing finance and procurement systems.
AI takes variance management beyond basic tracking. Portfolio Risk Insights scan across projects to identify budget anomalies and flag at-risk initiatives. AI Blocks categorize expenses, summarize financial trends, and generate executive reports without manual effort.
Smart automations turn insights into action. When variance exceeds thresholds, alerts notify stakeholders immediately. Approval workflows for budget adjustments trigger automatically. The platform also links variance detection to corrective action automatically.
| Traditional tracking | monday work management approach |
|---|---|
| Manual spreadsheet updates | Automated formula columns |
| Monthly static reports | Live dashboard monitoring |
| Reactive problem discovery | AI-powered predictive insights |
| Isolated project views | Portfolio-wide aggregation |
| Disconnected from workflows | Integrated with all systems |
Whether you’re managing marketing campaigns or enterprise portfolios, monday work management scales with you — keeping variance tracking simple and actionable.
Master cost variance for project success
Cost variance tracking changes project management. You stop reacting to damage and start managing finances proactively. Monitor variance consistently and you’ll catch problems early, allocate resources smarter, and keep stakeholders confident with transparent budgets.
The key? Measure systematically and respond fast. Calculate variance regularly, figure out what’s driving deviations, and fix small issues before they become major overruns. Whether you’re tracking material costs, labor efficiency, or overhead, each variance type shows you exactly where to improve.
Automation multiplies these benefits. Real-time monitoring, AI predictions, and integrated workflows cut manual tracking delays and give executives the portfolio visibility they need for strategic decisions.
Teams using monday work management see this shift first-hand: variance tracking becomes part of their workflow, not extra reporting work.
Frequently asked questions
What's the difference between cost variance and budget variance?
The difference between cost variance and budget variance is what they measure. Cost variance measures earned value against actual costs for completed work, showing efficiency. Budget variance compares the total planned budget against total spending regardless of progress, showing the overall spending position.
How often should I calculate cost variance?
Calculate cost variance weekly for active projects and monthly for longer initiatives. Include additional calculations at every major milestone to ensure timely course correction.
What's an acceptable cost variance percentage?
A variance between -5% and +5% is generally healthy. Variances approaching ±10% need investigation, while anything beyond ±15% indicates serious budget control issues requiring immediate intervention.
Can AI predict cost variance?
Yes, AI analyzes historical patterns, resource utilization, and progress trends to forecast potential overruns weeks in advance, allowing preventive action before variances materialize.
How do I explain cost variance to executives?
Focus on business impact, not formulas. Explain whether the project delivers value efficiently, what risks the variance creates, and what specific actions will realign the budget with strategic goals.
Which tools calculate cost variance automatically?
Work management platforms like monday work management feature built-in formulas, dashboards, and AI insights that calculate variance continuously, replacing manual spreadsheet tracking with automated monitoring.