


If you’ve been in business a while, you’ve probably heard things like “We want to increase productivity by 30% next year” or “Our team productivity has stayed below average the last couple of years.”
But how do you even measure productivity? This guide covers the topic in full, including the core formulas for calculating productivity, KPIs for different team types, strategies for measuring knowledge worker output, and how AI-powered approaches have transformed the way organizations track and improve performance. Whether you’re managing a five-person team or overseeing operations across departments, you’ll walk away with a practical framework you can put to work immediately.
Get startedKey takeaways
- Productivity measures how efficiently you convert inputs (time, labor, capital) into outputs (revenue, deliverables, completed work), and the basic formula is output divided by input.
- Selecting the right KPIs for your context is more important than tracking every metric. Focus on 3-5 indicators that align with your team’s goals.
- Team productivity isn’t just the sum of individual outputs; it requires tracking collaboration-focused metrics like sprint velocity, on-time delivery rate, and workload balance.
- AI is shifting productivity measurement from manual, backward-looking reports to real-time, predictive insights that flag bottlenecks before they stall progress.
- monday.com’s AI Work Platform gives teams dashboards, time tracking, workload views, automations, and AI features to measure and improve productivity from a single workspace.
What is productivity measurement?
Productivity measures the efficiency of turning inputs into outputs. The basic formula is straightforward:
Productivity = Total output / Total input
Inputs include anything you invest in producing a result: labor hours, capital, materials, and technology. Outputs are what you get back: revenue, units produced, projects delivered, or goals achieved. The fewer resources you consume to produce a given output, the more productive you are.
But here’s where it gets nuanced, based on your type of business. In a manufacturing environment, for example, tracking units per hour is relatively simple. In a knowledge-work setting, the “output” is harder to define. A marketing team’s output might be campaign performance. A product team’s output might be features shipped and adoption rates. A consulting firm measures billable hours and client satisfaction.
The key is defining what “output” means for your specific context, then measuring it consistently over time. Without that definition, productivity stays an abstract idea rather than something you can act on.

Why measuring productivity is vital for business
Peter Drucker famously said: “What gets measured gets improved.”

And he’s right, because without measurement, you’re just guessing, the cost of which is enormous. Gallup’s 2026 research shows that with only 20% of employees engaged globally, the drag on economic output reaches $10 trillion annually. McKinsey estimates that employee disengagement costs median S&P 500 companies between $228 million and $355 million per year in lost productivity.
Each of these numbers represents real revenue left on the table and real opportunities missed.
When you measure productivity consistently, you unlock several tangible benefits:
- Smarter resource allocation: Understanding where your team’s time and energy go helps you redistribute effort toward high-impact work and away from low-value activities
- Stronger time management: Tracking how teams use their hours reveals patterns of inefficiency, from excessive meetings to unclear handoffs, that you can address directly
- Continuous process improvement: Productivity data highlights which workflows are running smoothly and which ones need attention, so you can fix bottlenecks before they grow
- Data-driven decision-making: Instead of relying on instinct or anecdotal feedback, leaders can make workforce, budget, and strategy decisions grounded in performance data
The bottom line? You can’t improve what you don’t measure. And in a global economy where disengagement is the default for most workers, the organizations that measure productivity well have a significant competitive advantage.
Types of productivity measurement
Not all productivity measurement is the same. Depending on what you’re evaluating, you’ll focus on different types of inputs and outputs. Here are the 4 main categories:
- Labor productivity: Measures economic output per labor hour. This is the most commonly referenced type, often used at the national level (e.g., GDP per hour worked) and at the organizational level (e.g., revenue per employee). It answers: how much value does each hour of work generate?
- Capital productivity: Evaluates how efficiently physical or financial capital (machinery, equipment, technology investments) produces output. If you purchase a $50,000 piece of equipment that doubles throughput, your capital productivity has improved significantly.
- Material productivity: Tracks the total output generated per unit of material consumed. Manufacturing and supply chain teams rely heavily on this metric to reduce waste and optimize raw material usage.
- Multifactor productivity (MFP): Combines multiple inputs (labor, capital, materials, energy) into a single measure of how efficiently all resources together produce output. MFP gives the most holistic view but requires more complex data collection.
You might also hear the term “total factor productivity” (TFP), which is similar to MFP and is commonly used in economic research to measure the portion of output growth that can’t be explained by increases in inputs alone. It often reflects gains from technology, process innovation, or organizational improvements.
Which type should you focus on? That depends on your team’s goals. For most business teams, labor productivity and multifactor productivity provide the most actionable insights.

How to measure productivity: formulas and calculations
It can feel like quite a leap from understanding the theory to putting it into practice. Here are some core formulas you can use to calculate productivity, along with real examples that make each one concrete.
Basic productivity formula
Productivity = Total output/Total input
Here’s a straightforward example. Say you run a clothing manufacturer that produces 800 shirts in 3 hours with 10 employees. Your total input is 30 labor hours (3 hours x 10 employees). Your productivity is:
800 / 30 = 26.67 shirts per labor hour
This gives you a baseline. If you introduce a process improvement and output rises to 900 shirts in the same period, productivity jumps to 30 shirts per labor hour. Now you can quantify the impact of that change.
Labor productivity
Labor productivity = Output / Labor hours
Labor productivity is the most widely tracked measure, both at the company and national level. For context, the U.S. Bureau of Labor Statistics reported that nonfarm business labor productivity increased 4.9% in Q3 2025, reflecting meaningful gains in output relative to hours worked. At the team level, you might track labor productivity as tasks completed per hour, revenue generated per full-time equivalent (FTE), or deliverables shipped per sprint.
Revenue per employee
Revenue per employee = Total revenue / Number of employees
This is one of the simplest high-level productivity indicators. If your company generates $10 million in annual revenue with 50 employees, your revenue per employee is $200,000. Tracking this over time reveals whether your organization is scaling efficiently or adding headcount faster than revenue growth. SaaS companies, professional services firms, and consulting practices use this metric frequently.
Utilization rate
Utilization rate = Billable hours / Total available hours
This metric is a good fit for service-based businesses where time is the primary input. If a consultant has 40 available hours per week and bills 32 of them, the utilization rate is 80%. Most agencies and consultancies target utilization rates between 70% and 85%. Below that range, you’re leaving revenue on the table. Above it, you risk burnout.
Multifactor productivity
Multifactor productivity = Output / Combined inputs (labor + capital + materials + energy)
This formula accounts for all major resource categories and provides the most comprehensive view. It’s especially useful when you want to evaluate whether gains in one area (say, automation reducing labor hours) are offset by increases in another (higher technology costs). Multifactor productivity is harder to calculate but delivers richer insights for strategic decision-making.
Essential productivity KPIs and metrics
Which metrics should you track? The answer depends on your team, your goals, and the type of work you do. Here’s a framework organized by category to help you choose the right indicators.
Output KPIs
- Revenue per employee: Total company revenue divided by headcount. A high-level indicator of how efficiently your workforce generates value.
- Units produced per hour: The standard manufacturing productivity metric, easily adapted for any team that produces countable deliverables.
- Tasks completed per sprint: For agile teams, this measures how much work moves through each iteration and highlights velocity trends over time.
Efficiency KPIs
- Utilization rate: The ratio of billable (or productive) hours to total available hours. Essential for service teams, agencies, and consultancies.
- Cycle time: How long it takes to complete a unit of work from start to finish. Shorter cycle times usually signal healthier processes.
- First-time quality rate: The percentage of work completed correctly on the first attempt, without rework. High first-time quality reduces waste and speeds up delivery.
Team KPIs
- On-time delivery rate: The percentage of tasks or projects completed by their original deadline. Consistently high rates signal reliable execution.
- Project completion rate: Tracks how many projects reach completion versus how many are started. A low ratio may indicate scope creep, resource constraints, or poor prioritization.
- Capacity utilization: Measures how much of your team’s available capacity is being used versus sitting idle. Useful for resource planning and workload balancing.
Engagement KPIs
- Employee engagement score: Typically measured through periodic surveys, this metric correlates strongly with productivity, retention, and customer satisfaction.
- Voluntary turnover rate: The percentage of employees who leave by choice. High turnover is both a symptom and a cause of productivity decline, as institutional knowledge walks out the door.
How do you choose among these? Start by identifying your team’s primary goal, whether that’s shipping faster, improving quality, or balancing workloads. Then select 3-5 KPIs that directly reflect progress toward that goal. Tracking too many metrics creates noise, but tracking too few leaves blind spots. The right set of KPIs gives you a focused view of what’s important.
How to measure team productivity
Individual productivity metrics tell you how each person is performing. But team productivity is a different animal entirely. So, how do you measure team productivity when the whole is more (or less) than the sum of its parts?
Start by recognizing that team productivity depends on collaboration, coordination, and alignment, not just individual output. Here are the metrics and approaches that capture the full picture.
Quantitative team metrics
- Sprint velocity: For agile teams, velocity measures the amount of work (story points or tasks) completed per sprint. Tracking velocity over multiple sprints reveals capacity trends and helps with planning.
- Throughput: The number of work items completed in a given time period, regardless of size. Useful for teams that don’t use story points.
- On-time delivery rate: What percentage of team commitments are met on schedule? This metric identifies systemic issues like poor estimation, scope creep, or resource bottlenecks.
- Workload balance: Are tasks distributed evenly, or are one or two people carrying the load? Imbalanced workloads lead to burnout and bottlenecks.
Qualitative signals
Numbers don’t capture everything. Pay attention to qualitative indicators that reveal how well a team is functioning beneath the surface:
- Meeting efficiency: Are stand-ups and syncs focused and productive, or do they run long and rehash the same topics?
- Cross-functional alignment: Do teams working on shared goals communicate effectively, or do silos cause misalignment and rework?
- Blockers resolved: How quickly does the team identify and remove obstacles? Teams that resolve blockers fast maintain momentum.
Practical steps to measure team productivity
Ready to start? Follow these four steps:
- Define team goals: What does success look like for this team over the next quarter? Align on outcomes, not just activity.
- Select 3-5 KPIs: Choose metrics that reflect your team’s goals and work type. A content team tracks different KPIs than an engineering team’s metrics.
- Establish baselines: Measure current performance before setting targets. Baselines give you a reference point for evaluating improvement.
- Review weekly: Build a rhythm of reviewing metrics as a team. Weekly check-ins keep everyone aligned and spot issues early.
The most productive teams aren’t the ones that work the hardest. They’re the ones that measure the right things, communicate openly, and continuously adjust.

Measuring knowledge worker productivity
Traditional productivity formulas were designed for factories and production lines, where outputs are tangible and countable. But what about the growing majority of the workforce whose output is ideas, decisions, strategies, and creative work?
Knowledge worker productivity has been one of the hardest challenges in management for decades. McKinsey research found that over half of employees are relatively unproductive, and fewer than 100 “standout” firms account for two-thirds of national productivity growth. The gap between high-performing and low-performing knowledge workers is enormous, and measurement is the first step to closing it.
Outcome-based measurement
- OKR completion rates: Track how many objectives and key results are achieved versus planned. This connects individual and team work to strategic outcomes.
- Goal completion rates: Similar to OKRs but applicable to any goal-setting framework. Measures whether knowledge workers are delivering on their commitments.
- Customer satisfaction impact: For roles that directly affect customer experience, tie productivity to NPS scores, customer retention, or support resolution times.
Time-based proxies
- Deep work hours: How many hours per week does a knowledge worker spend on focused, uninterrupted work? Research consistently shows that deep work drives the highest-quality output.
- Context-switching frequency: How often does someone jump between tasks, apps, or meetings? Frequent context switching destroys concentration and slows output.
- Meeting load: What percentage of the workweek is consumed by meetings? When meetings exceed 40-50% of available time, productive work suffers significantly.
Quality signals
- Rework rate: How often does completed work need revision? High rework rates indicate unclear requirements, poor communication, or insufficient skill.
- Peer review scores: For teams that use code reviews, design critiques, or editorial reviews, peer assessments provide a quality layer that pure output metrics miss.
- Stakeholder satisfaction: Do the people receiving the work (internal clients, leadership, cross-functional partners) rate the quality and timeliness positively?
The most effective approach for knowledge workers combines outcome-based metrics with time-based proxies and quality signals. No single metric tells the full story, but together they paint a picture of both quantity and quality of output.

6 strategies to improve productivity
Measuring productivity is the foundation. But what do you do once you have the data? Here are six strategies that consistently move the needle.
- Set specific goals and KPIs: Vague objectives produce vague results. Define what success looks like in measurable terms: “increase sprint velocity by 15% this quarter” is actionable. “Be more productive” is not. Tie every KPI to a business outcome so teams understand the purpose behind the metric.
- Eliminate low-value work: Audit your team’s weekly activities and identify tasks that consume time without delivering proportional value. Status update meetings that could be async messages, manual reporting that could be automated, approval chains with too many steps. Cutting these frees up hours for meaningful work.
- Balance workloads using data: When some team members are overloaded while others have capacity, the whole team slows down. Use workload data to redistribute assignments based on availability and skill, preventing burnout on one side and idle time on the other.
- Reduce context switching: Every time someone switches between tasks or applications, there’s a cognitive cost. Encourage time-blocking for deep work, batch similar tasks together, and minimize the number of platforms your team needs to check daily.
- Invest in a centralized platform: When work is scattered across email, spreadsheets, chat apps, and disconnected project trackers, teams waste time searching for information and keeping everything in sync. A centralized workspace that connects tasks, data, and communication reduces friction and gives everyone a single source of truth.
- Use AI to handle routine tasks: AI isn’t a future promise. It’s producing measurable results now. METR’s 2026 research found a 1.3x productivity uplift from AI assistance as of March 2025, with projections reaching 2.5x by 2027. From automated status updates to intelligent task routing, AI can take repetitive work off your team’s plate so they can focus on higher-impact activities.
Learn more: Productivity tips
How AI is changing productivity measurement
The way teams track productivity is undergoing a fundamental shift. Traditional measurement relied on manual data collection, periodic reports, and backward-looking analysis. By the time you spotted a problem, it had often been hurting performance for weeks. AI changes that equation entirely.
- Real-time tracking replaces manual reporting. Instead of asking team leads to compile weekly status updates, AI-powered platforms can aggregate data continuously across tasks, projects, and workflows. Leaders see current performance at a glance, without waiting for someone to pull numbers together.
- Pattern recognition identifies bottlenecks. AI can analyze workflow data to detect patterns that humans might miss: a particular project phase that consistently takes longer than estimated, a team member whose task queue is growing faster than they can clear it, or a recurring dependency that delays downstream work.
- Predictive insights forecast delays. Rather than reacting to missed deadlines, AI can flag risks before they materialize. If a project’s current pace suggests it won’t hit its target date, the platform can alert you early enough to reallocate resources or adjust scope.
- Automated workflows eliminate repetitive tasks. Every minute spent on status pings, assignment routing, and notification management is a minute not spent on productive work. AI-driven automations handle these tasks in the background, preserving your team’s focus for the work that requires human judgment.

How monday.com helps you measure and improve productivity
Formulas and KPIs are valuable, but they require a platform that centralizes your data, automates collection, and turns metrics into action. That’s exactly what the AI Work Platform is designed to do.
Instead of juggling spreadsheets, standalone time-trackers, and disconnected reporting dashboards, monday.com brings everything into a single workspace where you can measure, monitor, and improve productivity in real time. Here’s how.
Dashboards
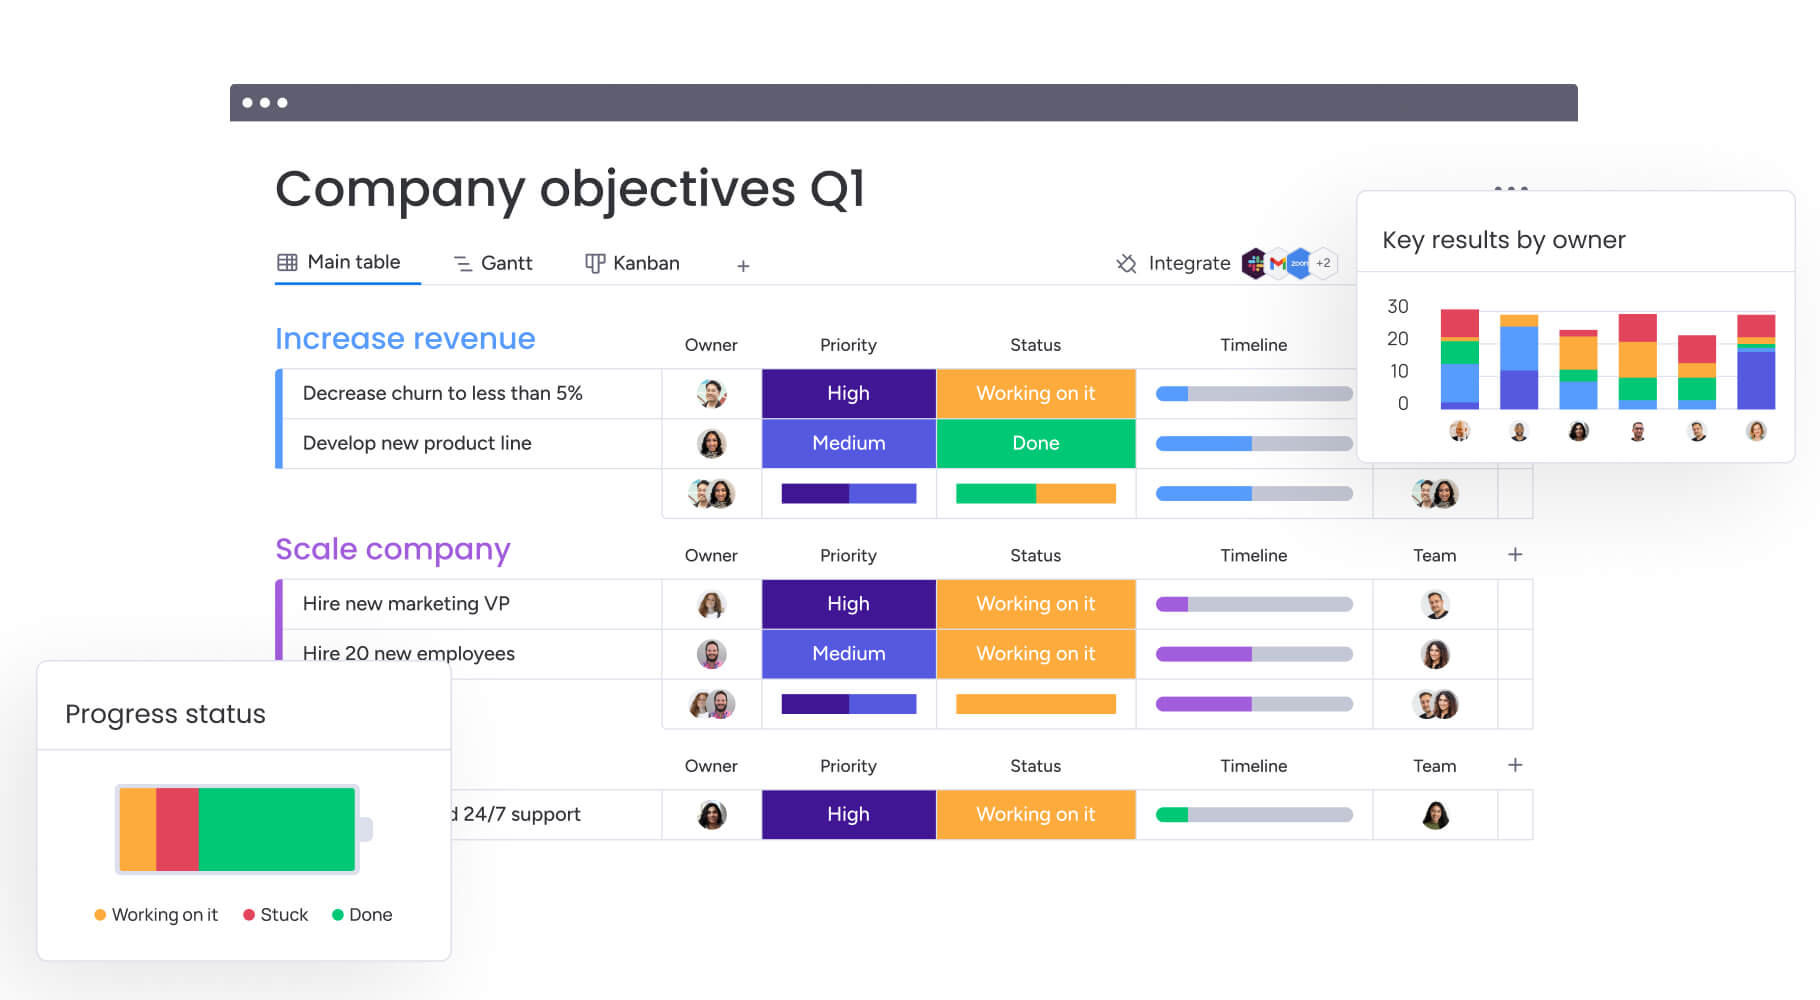
Customizable dashboards give you real-time visibility into your priority metrics. Choose from 30+ widget types to build views that track project completion rates, budget utilization, team workloads, and more. Roll up data from multiple boards into portfolio-level dashboards so leadership can monitor performance across the entire organization without chasing updates.
Time tracking
Built-in time tracking lets team members log hours directly on tasks, giving you accurate data on how long work takes versus how long it was estimated to take. Over time, this data helps you plan future projects more accurately, identify tasks that consistently take longer than expected, and calculate labor productivity with confidence.
Workload view
The Workload View provides a visual breakdown of how work is distributed across your team. Spot over-utilized team members who are headed toward burnout, identify under-utilized capacity that could be redirected, and rebalance assignments in just a few clicks. When workloads are balanced, teams move faster and produce higher-quality work.
Automations
No-code automations handle repetitive tasks that drain productivity: sending notifications when a status changes, auto-assigning tasks based on criteria, moving items between boards when milestones are reached, and triggering approval workflows. Teams on monday.com save hours each week by automating the work that doesn’t require human judgment.
AI features
monday.com’s AI Work Platform includes a suite of AI capabilities designed to accelerate how teams work:
- monday sidekick: A context-aware AI assistant that summarizes updates, generates content and project plans, analyzes data, and triggers workflows from a simple prompt
- monday agents: Autonomous AI agents that handle specialized tasks. The Project Analyzer agent flags bottlenecks and risk areas across your projects automatically
- AI Blocks: Ready-made AI actions you can add to any workflow to categorize data, summarize notes, extract insights, and more
- monday vibe: An AI-powered no-code builder that lets you create custom applications from a natural language description, so you can build purpose-specific productivity tracking apps without writing code
200+ integrations
Connect monday.com to the rest of your tech stack with 200+ integrations, including Toggl, Harvest, Slack, Microsoft Teams, Google Workspace, Jira, and Salesforce. When your productivity data flows into one central platform, you eliminate the blind spots that come from siloed information.
Want to get started quickly? Try the daily task manager template to centralize your team’s work in minutes.
Get startedStart measuring what's important
Productivity isn’t just about working harder or putting in more hours. It’s about understanding where effort goes, identifying what drives results, and building systems that help your team improve continuously. Now you know how to measure productivity using the right formulas, KPIs, and team-level strategies.
Here are three actions you can take today:
- Choose 3-5 KPIs that align with your team’s primary goals and work type
- Establish baselines by measuring current performance before setting improvement targets
- Use a platform that automates tracking so your team spends time on productive work, not on compiling reports about productive work
The difference between teams that guess and teams that measure is only growing. Start closing it today with the AI Work Platform.
Get startedFAQs
What is the simplest way to measure productivity?
The simplest way to measure productivity is to divide your total output by your total input. For example, if your team completes 50 tasks in 100 labor hours, your productivity is 0.5 tasks per hour. Start with this basic formula, then refine by choosing more specific outputs and inputs that reflect your team's goals.
What are the most important productivity KPIs?
The most important productivity KPIs depend on your team's function and goals. Revenue per employee, utilization rate, and on-time delivery rate are strong starting points for most teams. For knowledge workers, add engagement scores and OKR completion rates. The key is selecting 3-5 metrics that directly connect to the outcomes you care about.
How do you measure team productivity vs. individual productivity?
Individual productivity measures how much one person produces relative to their inputs. Team productivity focuses on collective output and collaboration quality, including metrics like sprint velocity, throughput, workload balance, and on-time delivery rate. A high-performing team often produces more than the sum of its individual members' outputs because of effective coordination and reduced friction.
Can AI help measure productivity?
Yes. AI transforms productivity measurement by automating data collection, identifying workflow bottlenecks through pattern recognition, and forecasting delays before they happen. AI-powered platforms replace manual reporting with real-time dashboards and predictive insights. McKinsey estimates generative AI could add $4.4 trillion in annual economic value, much of it through productivity gains.
How does monday.com measure productivity?
monday.com's AI Work Platform measures productivity through customizable dashboards, built-in time tracking, workload views, and AI-powered insights. Teams can track KPIs like task completion rates, project timelines, resource utilization, and cycle times on a single platform. Automations and AI features further boost productivity by eliminating repetitive work.
How often should you measure productivity?
Measure productivity at the frequency that matches your work cadence. Most teams benefit from weekly KPI reviews during team meetings, with monthly or quarterly deep-dives for trend analysis and goal adjustment. Real-time dashboards on a platform like monday.com let you monitor metrics continuously without the overhead of manual reporting cycles.

 Get started