
Sales teams close deals daily, but predicting exactly when the next wave of revenue will arrive remains a constant challenge. Tracking metrics in isolation often obscures the critical insight of how quickly your pipeline converts opportunities into actual cash.
Sales velocity solves this problem by combining four essential factors into a single metric that reveals your true revenue generation speed. Instead of guessing about targets, this calculation provides a concrete daily revenue rate to enable proactive planning and resource allocation.
This guide explains the sales velocity formula and provides seven proven strategies to accelerate your revenue generation engine. Ultimately, you will learn how to optimize each lever of your sales process to drive faster, more predictable growth.
Key takeaways
- Master the four-lever formula for revenue growth: track opportunities, deal size, win rate, and sales cycle length, as improving any single component multiplies your entire pipeline’s performance.
- Focus on qualified opportunities over raw lead volume: one genuine prospect with budget and authority beats ten tire-kickers who’ll never buy.
- Use sales velocity for accurate revenue forecasting: calculate your daily revenue rate to predict monthly and annual performance, enabling confident business decisions and resource planning.
- Leverage technology to automate and score leads: platforms like monday CRM can help you use automation and AI to prioritize high-conversion prospects and eliminate manual work that slows deals down, boosting velocity across all four metrics.
- Shorten sales cycles by removing friction, not rushing prospects: map your process to find unnecessary delays like slow approvals or proposal generation that add days without adding value.
What is sales velocity?
Sales velocity measures how quickly your sales pipeline generates revenue. It’s the rate at which opportunities move through your sales process and convert to closed deals. This metric combines four critical factors including number of opportunities, average deal size, win rate, and sales cycle length, into a single number that represents your revenue generation speed.
Sales teams use velocity to predict future revenue with greater accuracy and identify bottlenecks that slow down deals. Unlike static metrics that only show what happened last quarter, velocity reveals the rate at which you’re generating revenue right now.
Furthermore, a company with $100,000 in monthly revenue but low velocity faces different challenges than one with the same revenue but high velocity — the latter can scale faster and adapt more quickly to market changes.
The sales velocity formula explained
The sales velocity formula is: (Number of Qualified Opportunities × Average Deal Size × Win Rate) ÷ Length of Sales Cycle. This calculation produces a single number representing how much revenue your sales team generates per time period, typically expressed as daily or monthly revenue velocity.
Each component plays a distinct role in determining your overall velocity. Understanding how these elements work together helps you identify which levers to pull for maximum impact on your revenue generation:
- Number of Qualified Opportunities: the total count of prospects actively being pursued in your pipeline.
- Average Deal Size: the mean value of closed-won deals, calculated from recent transactions.
- Win Rate: the percentage of qualified opportunities that convert to closed deals (expressed as a decimal).
- Length of Sales Cycle: the average number of days from first contact to closed deal.
To illustrate the practical application of this formula, consider a company with 100 qualified opportunities, an average deal size of $10,000, a 20% win rate (0.20), and a 90-day sales cycle. The velocity calculation would be: (100 × $10,000 × 0.20) ÷ 90 = $2,222 per day. This indicates that the sales organization generates approximately $2,222 in revenue velocity daily, translating to roughly $66,660 per month.
The formula reveals something powerful: improving any single component increases overall velocity. Doubling your opportunities or win rate has the same mathematical effect as cutting your sales cycle in half. This insight helps sales leaders prioritize which lever to pull for maximum impact.
Breaking down the 4 sales velocity metrics
.jpg)
Understanding each component of the sales velocity formula helps you identify where to focus your improvement efforts. These four metrics work together to determine your overall revenue generation rate, and optimizing any single element can significantly impact your results.
1. Number of qualified opportunities
Qualified opportunities represent prospects who meet specific criteria indicating genuine purchase intent and proper fit for your solution. These differ fundamentally from raw leads; it’s important to distinguish genuine opportunities from general interest shown by downloading a whitepaper or attending a webinar.
Most organizations use frameworks like BANT (Budget, Authority, Need, Timeline) to separate qualified opportunities from casual browsers. A qualified opportunity has:
- Allocated budget: financial resources available for purchase.
- Decision-making authority: access to people who can approve the purchase.
- Business needs: a problem your product addresses.
- Realistic timeline: a buying window that aligns with your sales process.
Increasing qualified opportunities directly multiplies your velocity, but quality matters more than quantity. Pursuing 200 poorly-qualified leads produces worse velocity than focusing on 50 genuine opportunities. The key is finding the right balance: enough volume to hit targets, but strict enough qualification to maintain high win rates.
2. Average deal size
Average deal size represents the mean value of closed-won deals over a specific period. Calculate this by dividing total revenue by number of deals. A company closing 20 deals worth $500,000 total has an average deal size of $25,000.
Several factors influence deal size:
- Product mix: enterprise packages versus starter packages.
- Customer segments: fortune 500 versus small business.
- Pricing strategies: value-based versus cost-plus pricing.
- Sales approach: solution selling versus transactional selling.
Larger deal sizes increase velocity mathematically, but often come with trade-offs. Enterprise deals worth $100,000 might take 180 days to close, while $10,000 deals close in 30 days. The velocity formula accounts for this relationship: a deal that’s 10x larger but takes 6x longer still improves overall velocity, though not as dramatically as the raw numbers suggest.
3. Win rate
Win rate measures the percentage of qualified opportunities that result in closed deals. Calculate this by dividing deals won by total opportunities. A team closing 25 deals from 100 qualified opportunities has a 25% win rate.
What constitutes a good win rate varies significantly by industry and sales model:
- Enterprise software companies: 20-30% win rates.
- Transactional B2C businesses: 50-60% win rates.
- Complex B2B sales: 15-25% win rates.
The key is understanding your baseline and improving from there.
Win rates have a multiplier effect on velocity. Improving from 20% to 25% doesn’t just add five percentage points; it increases velocity by 25% across your entire pipeline. A company with $50,000 daily velocity at 20% win rate jumps to $62,500 daily velocity at 25%, generating an additional $375,000 monthly without adding more opportunities.
4. Length of sales cycle
Sales cycle length measures the average time from first meaningful contact to closed deal, typically expressed in days. This metric serves as the denominator in the velocity formula, meaning shorter cycles directly increase velocity.
Cycle length varies dramatically by business model and deal complexity:
- B2C e-commerce: hours or days.
- SMB software sales: 30-60 days.
- Enterprise deals: 90-180 days or longer.
The relationship between cycle length and velocity is inverse: cutting a 90-day cycle to 60 days increases velocity by 50%, even if nothing else changes. However, artificially rushing prospects can backfire by reducing win rates. Focus on removing unnecessary friction and delays while respecting the customer’s natural buying process.
How to calculate sales velocity?
Calculating sales velocity requires gathering accurate data from your sales pipeline and applying the formula correctly. This three-step process gives you a precise picture of your current revenue generation rate and establishes a baseline for improvement efforts.
Step 1: collect your sales metrics
Start by counting qualified opportunities currently in your pipeline. These are active prospects meeting your qualification criteria, not total leads or contacts. Count opportunities from “Qualified” through “Negotiation” stages, excluding closed deals.
Next, calculate average deal value from recently closed deals:
- Pull the last 20-30 closed-won opportunities: gather recent deal data for accurate calculations.
- Sum their total values: add up the revenue from all closed deals.
- Divide by the count of deals: calculate the mean value across all transactions.
Using recent deals ensures your average reflects current market conditions and pricing.
Win rate comes from historical performance data. Divide closed-won deals by total opportunities (won + lost) over a consistent period. If you closed 30 deals from 120 total opportunities, your win rate is 25% (expressed as 0.25 in the formula).
Finally, measure average sales cycle length by calculating the mean time from opportunity creation to close date for recent won deals. If your last 20 deals took a combined 1,800 days to close, your average cycle is 90 days.
Step 2: apply the sales velocity equation
With data collected, apply the formula: (Opportunities × Deal Size × Win Rate) ÷ Cycle Length.
Here’s a complete example using realistic B2B software numbers:
- Qualified Opportunities: 150.
- Average Deal Size: $15,000.
- Win Rate: 22% (0.22).
- Sales Cycle Length: 75 days.
Calculation: (150 × $15,000 × 0.22) ÷ 75 = $6,600 per day.
This company generates $6,600 in daily revenue velocity, or approximately $198,000 monthly. The number represents the rate at which the current pipeline converts to revenue.
Step 3: analyze your velocity results
Your calculated velocity number reveals your current revenue generation rate, but interpretation requires context. A $5,000 daily velocity might be excellent for a startup with two sales reps or concerning for an established company with a 20-person team.
Track velocity over time to identify trends:
- Monthly tracking: plot velocity monthly or quarterly.
- Trend analysis: consistent growth indicates healthy sales operations.
- Problem identification: declining velocity signals issues requiring attention.
A company improving from $4,000 to $6,000 daily velocity over six months demonstrates progress, regardless of competitor comparisons.
Use velocity for revenue forecasting by multiplying daily velocity by selling days. A company with $7,000 daily velocity can forecast approximately $147,000 in monthly revenue (21 selling days) or $1.75 million annually (250 selling days).
Sales velocity vs. pipeline velocity
Sales velocity and pipeline velocity measure related but distinct aspects of sales performance. Understanding the difference helps you choose the right metric for specific analysis and improvement initiatives.
- Sales velocity: calculates overall revenue generation rate using the four-component formula, producing a single number representing how much revenue the entire sales operation generates per time period.
- Pipeline velocity: measures how quickly individual deals progress through specific pipeline stages.
The difference is straightforward: pipeline velocity measures how quickly individual deals progress through specific pipeline stages, while sales velocity measures the overall revenue generation rate from start to finish. Pipeline velocity might show that deals spend an average of 14 days in the “Demo” stage and 21 days in “Proposal,” helping identify specific bottlenecks. Sales velocity aggregates the entire journey into a single revenue rate.
Both metrics serve valuable purposes:
- Pipeline velocity: helps sales managers optimize specific process stages.
- Sales velocity: helps executives forecast revenue, set targets, and evaluate overall sales effectiveness.
A company might have excellent pipeline velocity but poor sales velocity due to low win rates or small deals.
“With monday CRM, we’re finally able to adapt the platform to our needs — not the other way around. It gives us the flexibility to work smarter, cut costs, save time, and scale with confidence.”
Samuel Lobao | Contract Administrator & Special Projects, Strategix“Now we have a lot less data, but it’s quality data. That change allows us to use AI confidently, without second-guessing the outputs.”
Elizabeth Gerbel | CEO“Without monday CRM, we’d be chasing updates and fixing errors. Now we’re focused on growing the program — not just keeping up with it."
Quentin Williams | Head of Dropship, Freedom Furniture“There’s probably about a 70% increase in efficiency in regards to the admin tasks that were removed and automated, which is a huge win for us.“
Kyle Dorman | Department Manager - Operations, Ray White"monday CRM helps us make sure the right people have immediate visibility into the information they need so we're not wasting time."
Luca Pope | Global Client Solutions Manager at Black Mountain“In a couple of weeks, all of the team members were using monday CRM fully. The automations and the many integrations, make monday CRM the best CRM in the market right now.”
Nuno Godinho | CIO at VelvWhy does sales velocity drive revenue growth?
Sales velocity directly links what your team does to your bottom line growth. When leaders understand this connection, they make smarter decisions about where to invest time and money.
- Predictable revenue forecasting: becomes possible when you know your velocity. When you generate $8,000 daily in sales velocity, leadership can reliably project $2.4 million in annual revenue and make confident hiring and expansion decisions. This predictability reduces the feast-or-famine cycles that plague many sales organizations.
- Early problem detection: happens automatically with velocity tracking. When velocity drops from $6,000 to $4,500 daily, leadership immediately knows something changed. This early warning system enables rapid response before small issues become revenue crises.
- Resource optimization: improves through velocity analysis. Understanding velocity helps companies invest resources where they’ll have the greatest impact. If increasing opportunities from 100 to 150 would boost velocity by 50%, but improving win rates from 20% to 25% would have the same effect, leadership can choose the more cost-effective path.
- Competitive advantage: emerges from higher velocity. A company with 2x the velocity of competitors can reinvest revenue faster, iterate on product development more quickly, and capture market share while competitors are still closing last quarter’s deals.
7 proven strategies to increase sales velocity
These seven strategies hit each part of the sales velocity formula, giving you clear ways to speed up your revenue engine. Each one tackles a specific problem that’s likely bogging down your sales right now.
Strategy 1: generate more qualified opportunities
Increasing qualified opportunities directly multiplies velocity, but the emphasis must be on “qualified.” Effective lead generation starts with refined ideal customer profiles that define which prospects are worth pursuing.
Lead scoring systems separate genuine opportunities from tire-kickers by assigning points based on fit and engagement. AI-powered lead scoring analyzes multiple data points simultaneously, automatically identifying high-potential prospects without manual evaluation.
Since teams using platforms like monday CRM can leverage AI to prioritize leads based on conversion probability, reps spend time only on the most promising deals.
Marketing-sales alignment ensures lead quality through:
- Shared definitions: both teams agree on what constitutes a qualified lead.
- Feedback loops: sales reports which lead sources produce highest conversion rates.
- Channel optimization: marketing doubles down on effective lead generation channels.
Strategy 2: increase your average deal value
Larger deal sizes directly multiply velocity without requiring more opportunities. The most effective approach is value-based pricing that ties costs to customer outcomes rather than features.
- Upselling and cross-selling: expand deal sizes by identifying additional needs during the sales process. When a prospect requests basic functionality, ask about related challenges to uncover opportunities for bundling additional capabilities.
- Solution bundling: packages multiple products together at attractive pricing, encouraging customers to buy more upfront. A company selling separate solutions might see $8,000 average deals; bundling all three for $20,000 increases deal size 2.5x while still providing customer value.
Strategy 3: improve your win rates
Higher win rates multiply velocity without requiring more opportunities. The foundation is rigorous qualification: applying frameworks like BANT ensures sales teams pursue only prospects with real budget, authority, need, and timeline.
Sales training directly impacts win rates by improving skills in:
- Discovery: uncovering real business needs and pain points.
- Objection handling: addressing concerns before they become roadblocks.
- Closing: converting qualified prospects into customers.
Regular role-playing sessions and call reviews help reps refine their approach based on what actually works.
Competitive analysis helps win more deals by understanding why prospects choose alternatives. If competitors win on price, develop ROI calculators that demonstrate superior value. If they win on features, highlight your unique capabilities and their business impact.
Strategy 4: shorten your sales cycle
Shorter sales cycles instantly boost your velocity, it’s simple math. Start by mapping your current process to find where deals get stuck. You’ll often discover days wasted on internal approvals or slow proposal creation that add zero value.
Streamlining decision-making helps prospects move faster:
- Meeting efficiency: if your process requires three meetings before presenting pricing, consider whether two would suffice.
- Proposal speed: if proposals take five days to generate, invest in templates and automation to reduce that to 24 hours.
- Approval processes: remove unnecessary internal approval steps that don’t add value.
Proactive objection handling addresses concerns before they become roadblocks. Rather than waiting for prospects to raise objections, address common topics early in the sales process to prevent surprises during negotiation.
Strategy 5: automate your sales process
Automation reduces sales cycle length and improves consistency. The highest-impact automation opportunities include:
- Email sequences: nurture leads and follow up automatically.
- Task creation: ensure reps complete required activities for each deal stage.
- Data entry: eliminate manual CRM updates and reduce errors.
- Pipeline updates: reflect deal progression without manual intervention.
Teams using advanced platforms like monday CRM can set up conditional automations that trigger based on deal stage changes, ensuring consistent execution without manual oversight. AI capabilities can draft personalized follow-up emails and summarize communication history, saving hours of manual work while maintaining quality.
Strategy 6: leverage predictive analytics
Data analysis reveals patterns that improve all four velocity components. Historical analysis shows which lead sources produce the highest win rates and which deal characteristics predict fast closes.
- Predictive analytics: uses AI to forecast deal outcomes before they happen. Machine learning models analyze hundreds of variables to predict which deals will close and which are at risk. This enables proactive intervention; if a high-value deal shows risk signals, leadership can assign additional resources.
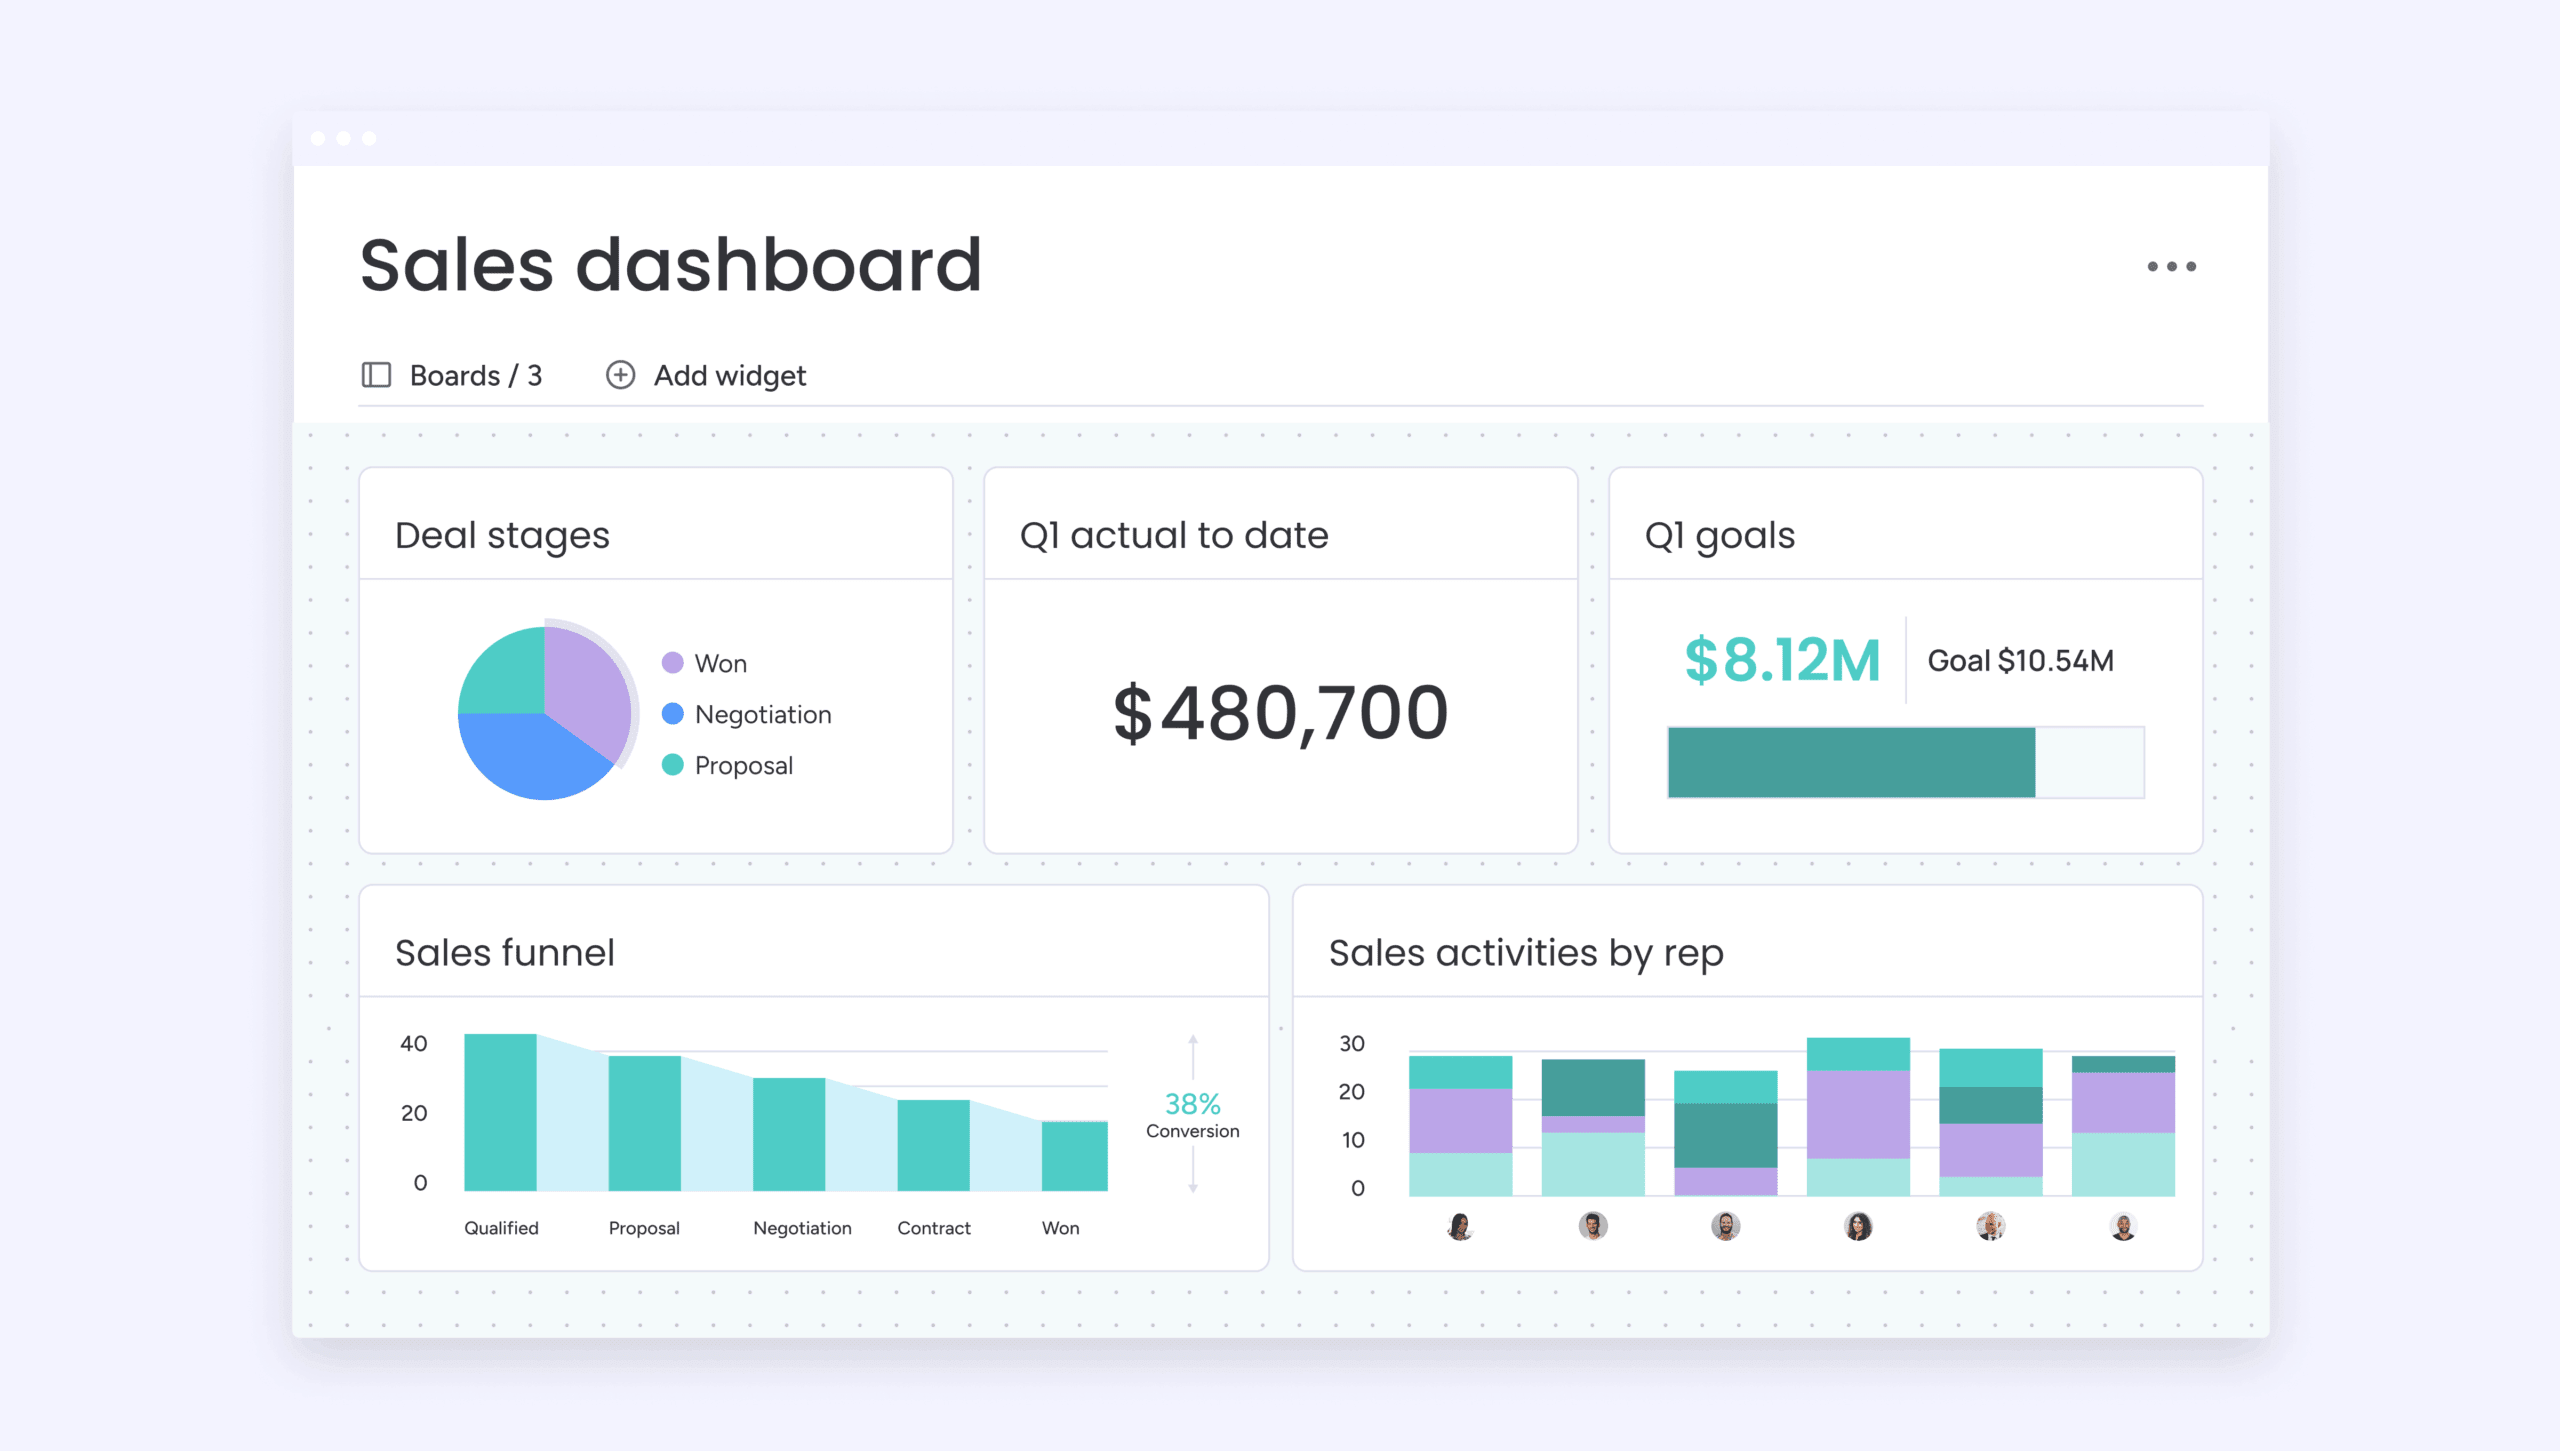
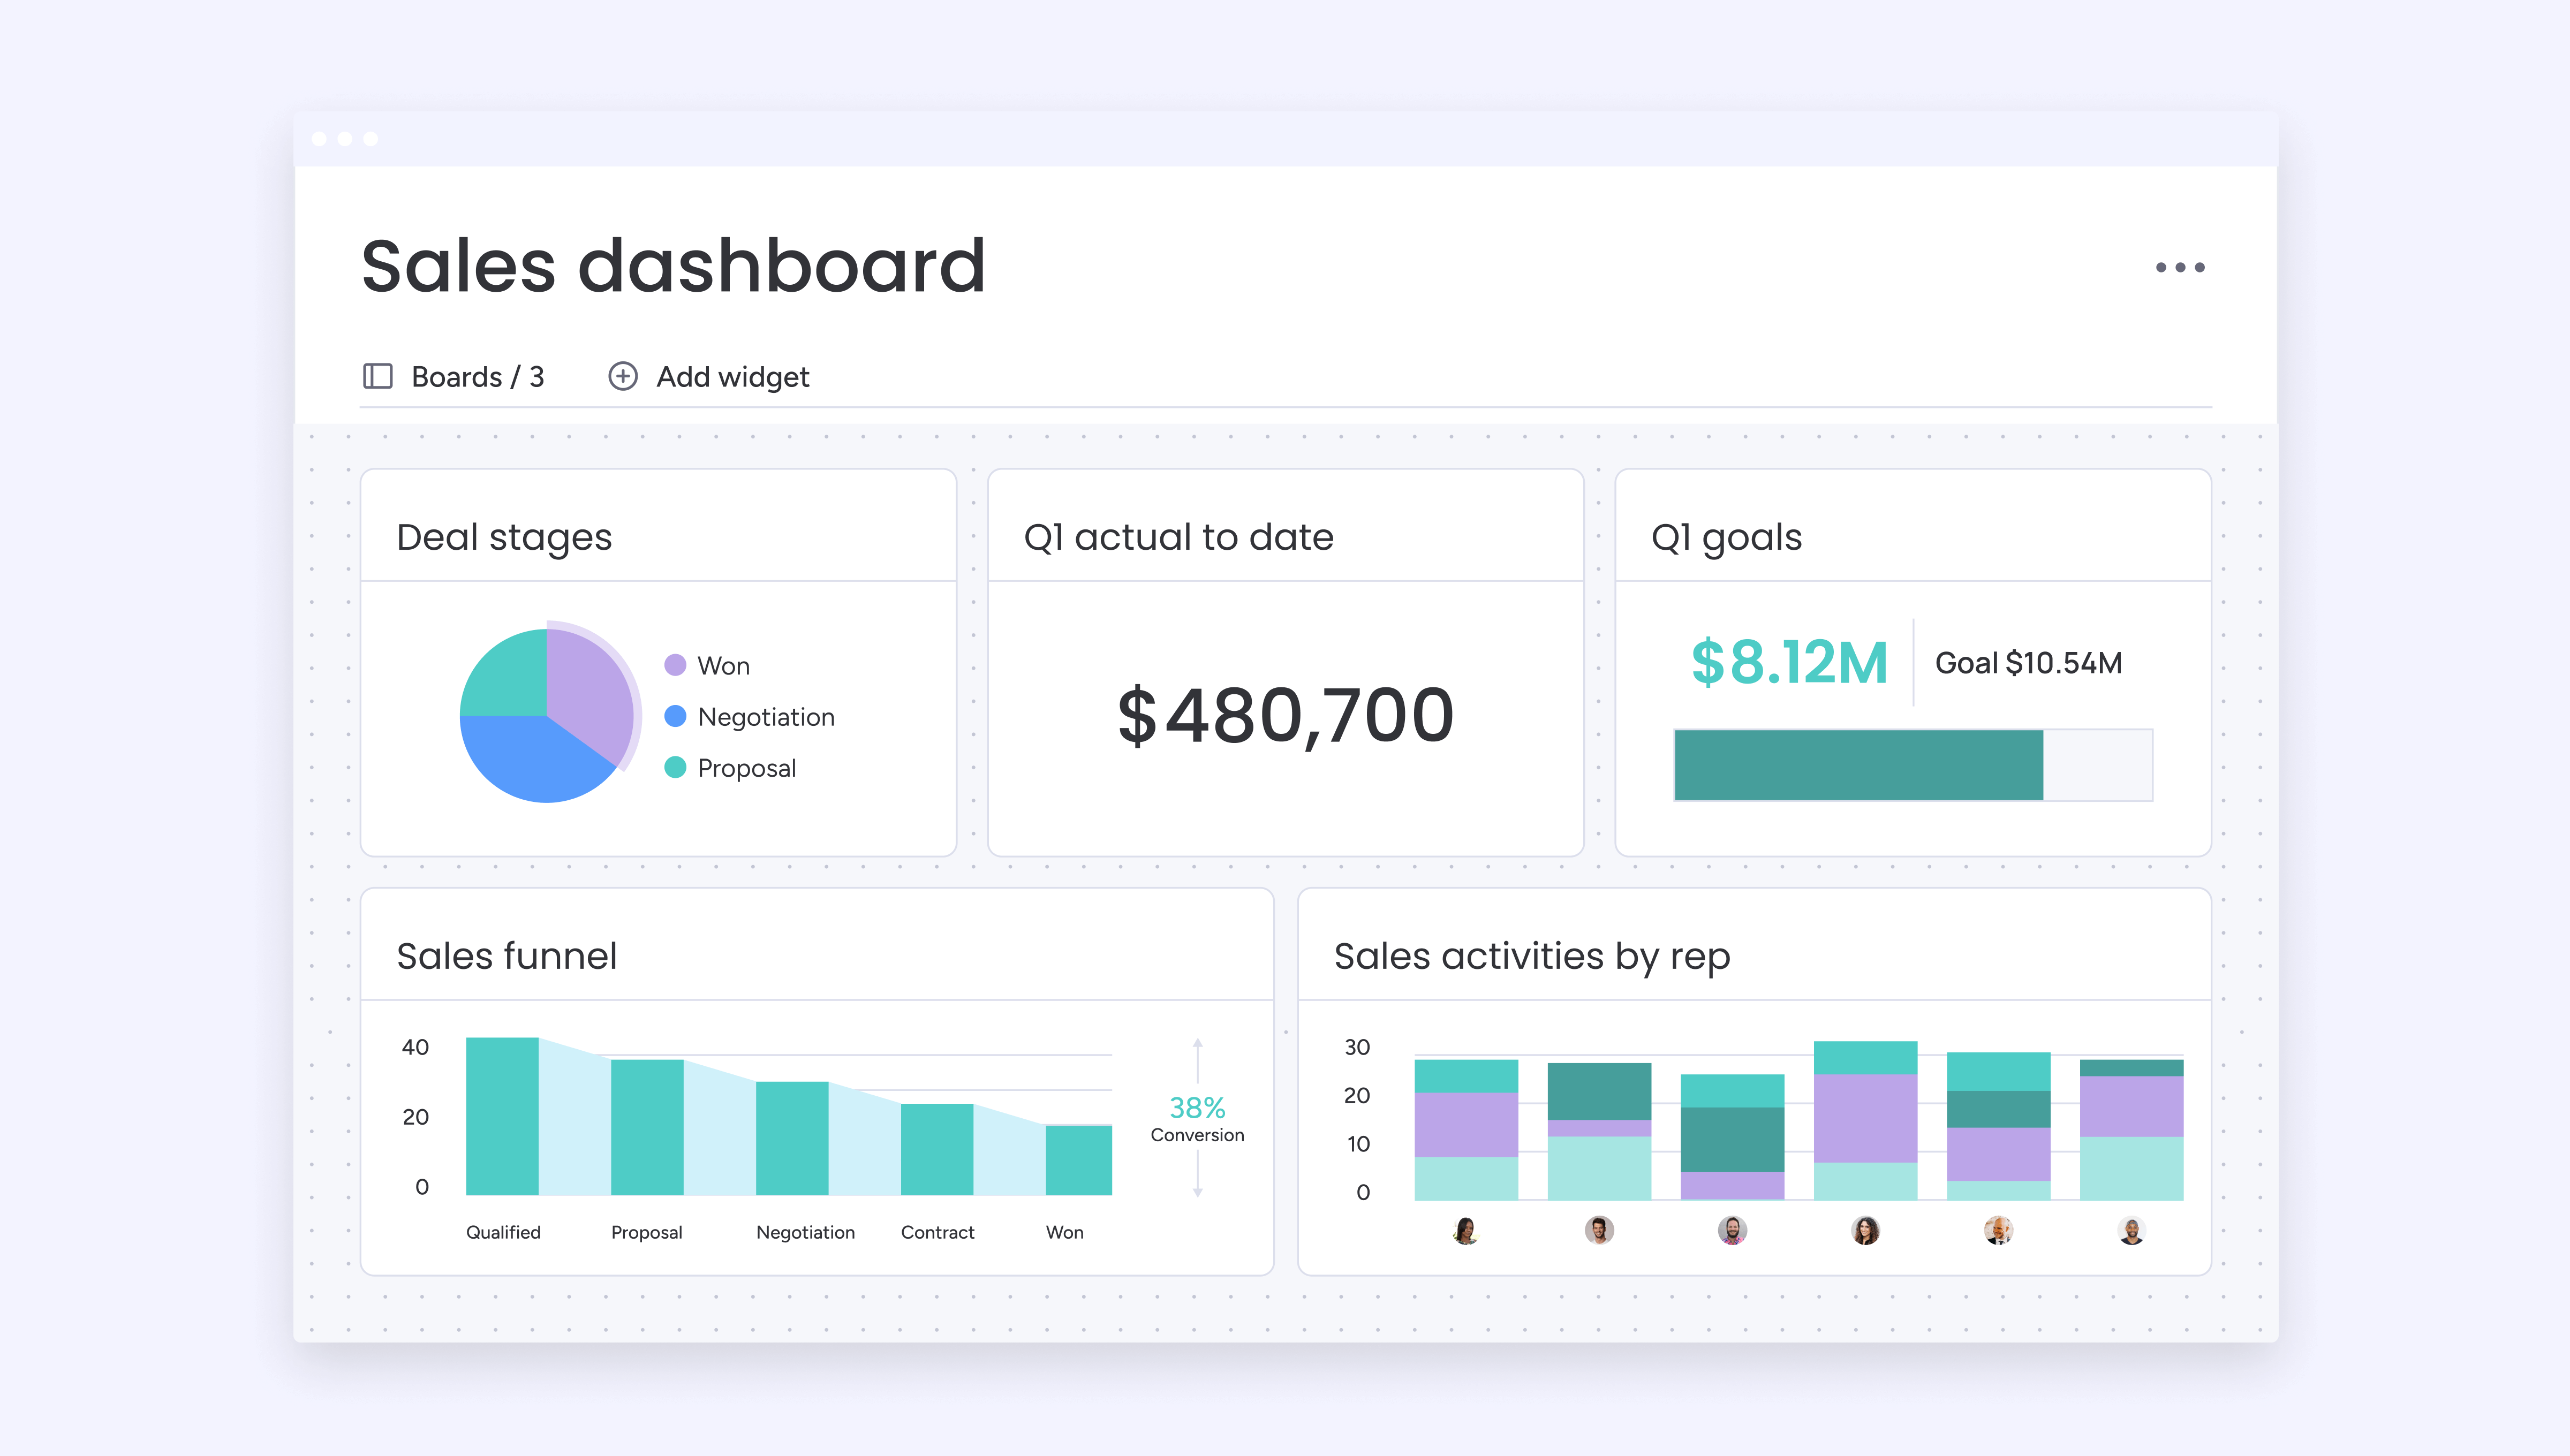
- Real-time dashboards: make data actionable by presenting key metrics in easy-to-understand visualizations. Sales teams can monitor velocity and pipeline health continuously, enabling rapid response to changes.
Strategy 7: align sales and marketing teams
When sales and marketing aren’t on the same page, your pipeline suffers. Marketing celebrates lead volume while sales complains about quality, and your velocity tanks as a result.
Alignment starts with shared goals and metrics:
- Common objectives: both teams focus on qualified opportunities created and revenue generated.
- Shared accountability: marketing prioritizes lead quality over quantity.
- Regular communication: weekly meetings to discuss lead quality and conversion rates.
Lead handoff processes define exactly when and how marketing transfers prospects to sales:
- Clear criteria: specify what makes a lead “sales-ready”.
- Automated notifications: alert sales reps when qualified leads arrive.
- Consistent follow-up: ensure every qualified opportunity receives prompt attention.
Accelerate your sales velocity with monday CRM
Organizations using monday CRM gain unique advantages in measuring and improving sales velocity through integrated capabilities that address all four velocity metrics. The platform’s AI-powered lead scoring helps generate more qualified opportunities by automatically analyzing conversion probability.
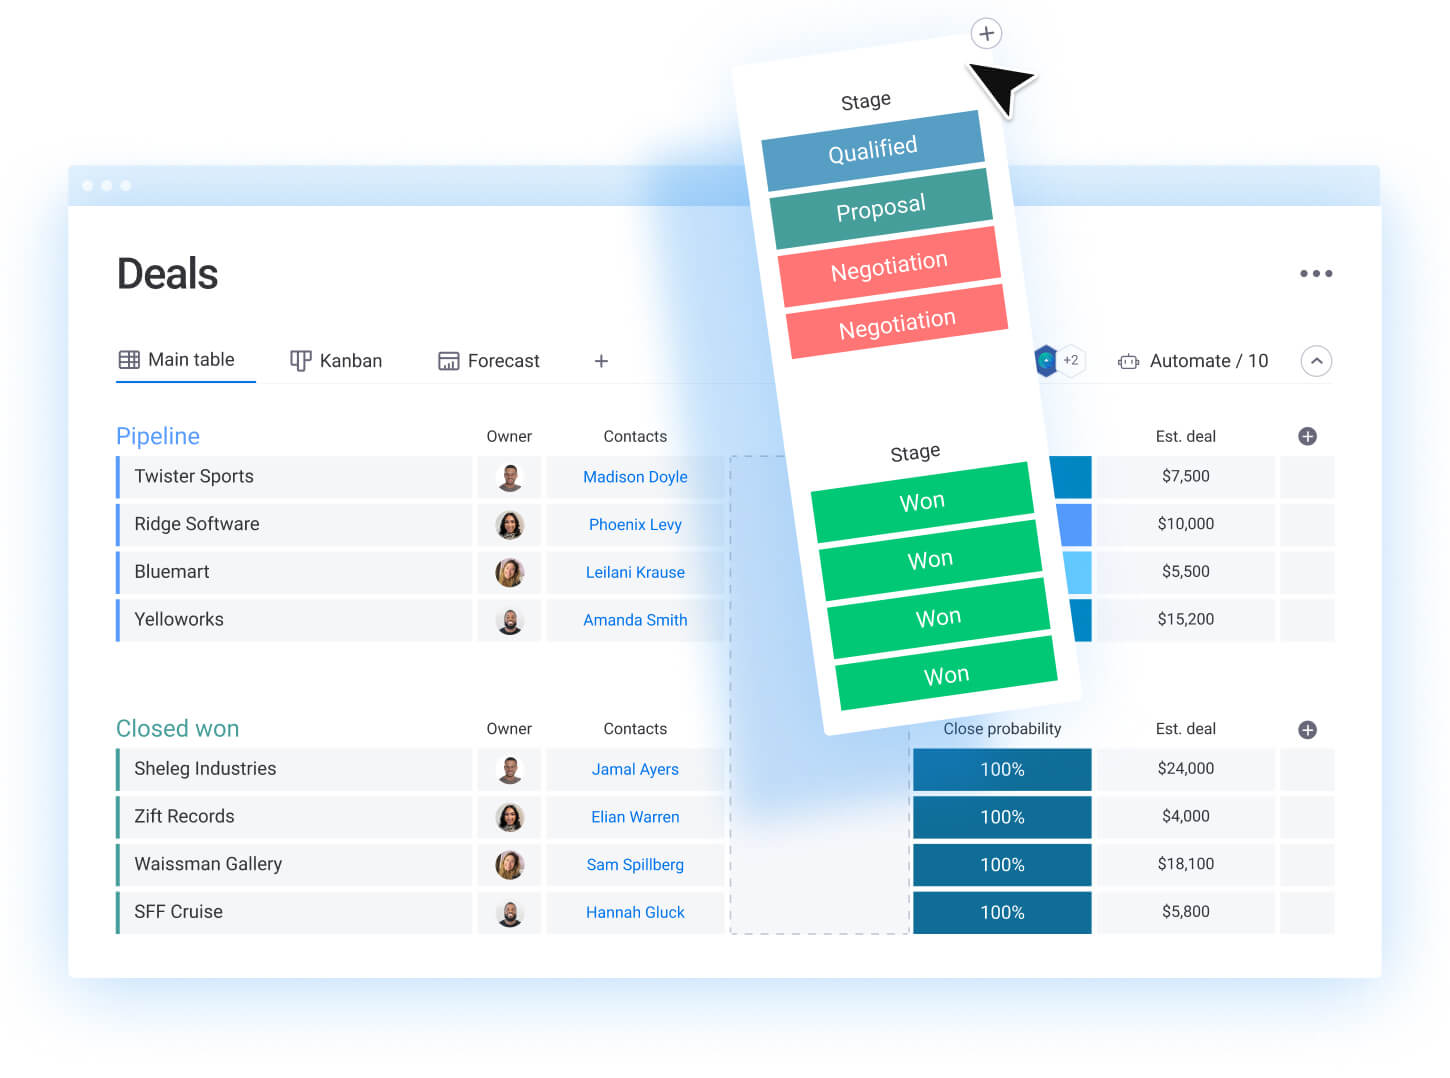
Customizable pipelines and deal stages adapt to any sales cycle, while automated workflows eliminate manual tasks that slow deals down.
Real-time dashboards calculate velocity automatically based on live pipeline data, giving teams instant visibility into performance trends. AI capabilities like timeline summarization and automated email composition reduce administrative burden, allowing reps to focus on selling activities that directly impact velocity.
The platform’s no-code customization means teams can build velocity tracking that matches their unique sales process without IT involvement. Whether you’re tracking velocity by team, territory, or product line, monday CRM provides the flexibility to monitor and improve the metrics that matter most to your business.
Maximizing sales velocity: what you need to know
Sales velocity provides a comprehensive view of your revenue generation rate by combining opportunities, deal size, win rate, and cycle length into a single metric. This measurement enables accurate forecasting, early problem detection, and strategic resource allocation that drives sustainable growth.
The four-component formula gives you multiple levers to pull for improvement. Whether you focus on generating more qualified opportunities, increasing deal sizes, improving win rates, or shortening sales cycles, any improvement multiplies across your entire pipeline.
Success requires consistent measurement and systematic optimization. Track your velocity monthly, identify trends, and implement targeted strategies that address your specific bottlenecks. With the right approach and tools, you can accelerate your sales velocity and achieve predictable revenue growth.
The content in this article is provided for informational purposes only and, to the best of monday.com’s knowledge, the information provided in this article is accurate and up-to-date at the time of publication. That said, monday.com encourages readers to verify all information directly.
Frequently asked questions
What is the sales velocity calculation for SaaS companies?
The sales velocity calculation for SaaS companies uses the same core formula: (Opportunities × Deal Value × Win Rate) ÷ Sales Cycle. However, SaaS businesses often adapt it by using monthly recurring revenue (MRR) or annual contract value (ACV) for the "Deal Value" component instead of one-time deal values. The calculation may also consider expansion revenue from existing customers through upsells and cross-sells.
How does sales velocity differ from lead velocity rate?
Lead velocity rate measures the growth rate of qualified leads month-over-month, while sales velocity measures how quickly those leads convert to revenue. Lead velocity is a leading indicator of future performance, while sales velocity is a comprehensive revenue metric.
What is a good sales velocity benchmark?
Good sales velocity varies significantly by industry, deal size, and sales model. B2B SaaS companies might target $2,000-$5,000 daily velocity per sales rep, while enterprise software companies might see $10,000+ daily velocity per rep despite longer cycles.
Can sales velocity predict future revenue?
Sales velocity helps forecast future revenue by showing current revenue generation rates, but should be combined with pipeline analysis and market conditions for accurate predictions. Velocity trends over time are more predictive than single-point measurements.
How often should you measure sales velocity?
Most businesses should measure sales velocity monthly, with weekly tracking for fast-moving sales environments and quarterly analysis for longer sales cycles. Consistent measurement frequency is more important than the specific interval chosen.
What is deal velocity vs. sales velocity?
Deal velocity measures how quickly individual deals move through pipeline stages, while sales velocity measures overall revenue generation rate across all deals. Deal velocity focuses on process efficiency, while sales velocity focuses on revenue outcomes.