
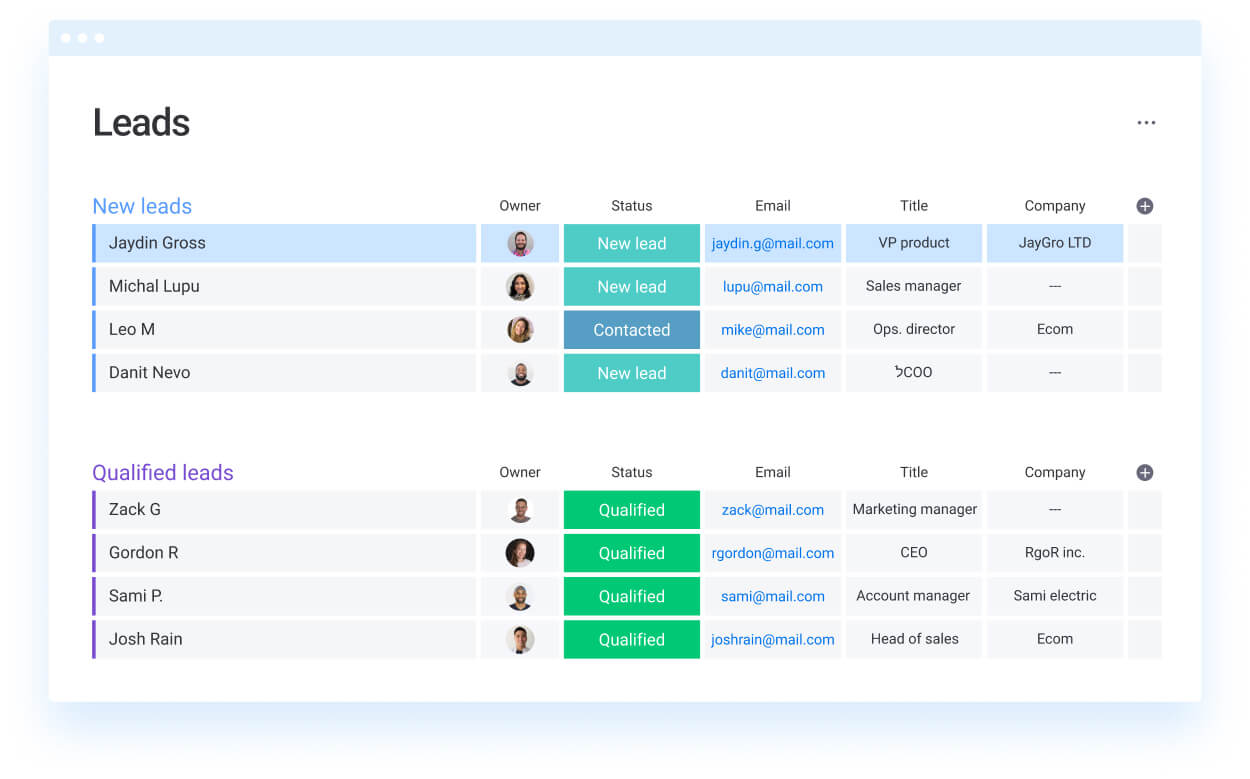
This month, a company receives 200 new leads. Half have generic company emails and downloaded only one whitepaper. The other half includes VPs at target companies who visited the pricing page three times and requested demos. Which group should receive attention first?
Many revenue teams still rely on intuition or basic demographics to determine lead quality. Lead scoring rules replace guesswork with measurable criteria, assigning points to prospect characteristics and behaviors. For example, a director at a 500-person SaaS company who downloads an ROI calculator automatically ranks higher than someone with a personal email who only visited a blog once.
This guide explores seven proven lead scoring frameworks, demonstrating how to identify high-value leads, prioritize pipeline activity, and accelerate conversion rates. From demographic qualification to advanced AI-driven predictions, the frameworks below provide practical methods for focusing on prospects most likely to convert.
Key takeaways
- Start with five to seven core criteria that predict 80% of conversions: Focus on job title, company size, and high-intent behaviors like demo requests before adding complexity.
- Combine positive and negative scoring to filter out time-wasters: Award points for ideal customer traits while deducting points for competitors, personal emails, and unsubscribes.
- Set your MQL threshold to capture the top 20% of leads by score: This typically means 50–75 points on a 100-point scale, resulting in 15–25% conversion rates from qualified leads to closed deals.
- Use time-based score decay to keep leads current: Reduce points by 25% monthly without new activity so recent engaged prospects don’t get buried behind stale high-scoring leads.
- Leverage monday CRM’s AI to optimize scoring rules: the platform analyzes your data to identify conversion patterns and continuously improves accuracy as it learns from new deals.
What are lead scoring rules?
Lead scoring rules function as a prospect grading system. Each action a lead takes (and each trait they demonstrate) either adds or subtracts points, giving your team a clear signal of who is ready to buy and who is just exploring options.
These rules convert intuition about lead quality into data-driven insights. Instead of relying on guesses, sales teams can automatically rank prospects based on observable behaviors.
For example, a director at a 500-person SaaS company who downloads a pricing guide earns more points than someone with a personal email who visits a blog only once.
With 71% of organizations now using generative AI in marketing and sales, lead qualification and prioritization have become increasingly important, and more precise.
Well-constructed scoring rules serve two critical purposes: they prevent teams from pursuing unqualified leads and ensure no high-potential prospect is overlooked. Revenue teams that implement these rules can also focus on leads most likely to convert, shortening sales cycles and improving forecast accuracy.
Explicit vs implicit scoring rules
Lead scoring captures signals in two complementary ways. By understanding both explicit and implicit scoring, teams can identify high-potential leads from every possible angle.
Explicit scoring relies on information prospects provide directly through forms, profiles, or conversations. These details indicate who a lead is and how well they match your ideal customer profile.
Common explicit scoring criteria include:
- Job title and seniority: C-level executives earn more points than individual contributors.
- Company size: Organizations in your target range score higher.
- Industry alignment: Companies in your core verticals get maximum points.
- Budget authority: Decision-makers with purchasing power score highest.
Implicit scoring monitors behavioral signals that reveal interest and buying intent. These actions indicate what prospects care about and how seriously they are evaluating solutions.
Key implicit scoring behaviors include:
- Website engagement: Pricing page visits signal higher intent than blog reads.
- Content consumption: Case study downloads show evaluation-stage research.
- Email interaction: Opens, clicks, and replies indicate engagement level.
- Demo requests: Direct sales inquiries earn maximum points.
Positive vs negative point assignment
An effective scoring model does not only reward interest: It also filters out poor fit.
Positive points highlight traits and actions that signal real opportunity, such as senior decision-makers, target industry alignment, pricing page visits, or demo requests. These behaviors push high-value leads to the top of your queue.
At the same time, negative points protect your pipeline from distraction. Signals like personal email addresses in B2B, competitor employees, unsubscribes, or mismatched company size should actively reduce a lead’s score.
As the table below shows, strong buying signals can add significant weight, while clear red flags can quickly pull a score down. A lead may accumulate 60 points through engagement, but a major disqualifier can reduce that total dramatically. That balance ensures sales teams focus on genuine opportunities instead of inflated activity.
| Positive scoring examples | Point value | Negative scoring examples | Point value |
|---|---|---|---|
| C-level decision maker | 30 | Personal email (B2B) | -15 |
| Target industry match | 25 | Competitor employee | -50 |
| Pricing page visit | 20 | Email unsubscribe | -25 |
| Demo request | 40 | Wrong company size | -20 |
| Multiple stakeholders | 25 | Single page bounce | -10 |
Well-constructed scoring rules serve two critical purposes: they prevent teams from pursuing unqualified leads and ensure no high-potential prospect is overlooked. Revenue teams that implement these rules can also focus on leads most likely to convert, shortening sales cycles and improving forecast accuracy.

7 lead scoring frameworks that drive revenue
These lead scoring frameworks below are practical, proven approaches that sales teams use to close millions in revenue. Each framework addresses a different aspect of lead qualification and can be combined to create a comprehensive scoring system that captures multiple dimensions of lead quality.
Framework 1: Demographic qualification scoring
Demographic qualification evaluates whether a prospect resembles your best customers on paper. Points are assigned when they match the companies that already engage successfully with your product.
Company characteristics form the foundation of demographic scoring:
- Size alignment: Companies with 100–500 employees earn 25 points if that matches your ideal customer profile.
- Revenue ranges: Organizations within your target revenue range earn maximum points.
- Industry fit: Technology companies earn 25 points for SaaS solutions, healthcare earns 20 points for compliance features.
Geographic location affects scoring based on market maturity:
- Primary markets: North american leads earn 20 points for established presence.
- Secondary markets: European leads earn 15 points for growing presence.
- Expansion markets: Apac leads earn 10 points for new territories.
Decision-making authority directly correlates with conversion probability:
- C-level executives (CEO, CRO, CFO): +30 points for independent purchase authority.
- VPs and Directors: +25 points for budget control and influence.
- Managers: +15 points for research and recommendations.
- Individual contributors: +5 points for limited purchasing power.
Framework 2: Behavioral engagement scoring
Behavioral engagement scoring measures digital interactions, often revealing purchase intent more accurately than demographics alone. A mid-level manager visiting your pricing page multiple times may indicate stronger intent than a VP visiting once.
Website engagement reveals research depth and solution interest:
- Homepage visits: 5 points for initial awareness.
- Product pages: 15 points for consideration-stage research.
- Pricing pages: 25 points for high-intent evaluation.
- Customer stories: 20 points for validation research.
- Session duration: Visits over five minutes earn bonus points.
Content consumption patterns show research seriousness:
- Ebooks and whitepapers: +15 points for problem recognition.
- Case studies: +20 points for solution evaluation.
- Webinar attendance: +25 points for time investment.
- Video views: +10 points for engagement.
- Multiple downloads: Bonus points for accelerated research.
Email and social engagement provide additional scoring signals:
- Email opens: +5 points, clicks +10 points, replies +20 points.
- Forwarded emails: +15 points when shared with stakeholders.
- Social follows: +5 points, shares +10 points, comments +15 points.
Framework 3: Lead source value scoring
Lead value often depends on its source. A warm referral is typically more valuable than a cold email. Customer referrals convert three to four times more often than cold signups, reflecting trust and pre-qualification.
High-value sources deserve maximum points:
- Customer referrals: 50 points for pre-qualified, pre-sold leads.
- Partner referrals: 45 points for trusted recommendations.
- Employee referrals: 40 points for internal advocacy.
- Direct website traffic: 35 points for brand searches.
- Organic search: 30 points for solution-focused queries.
Lower-intent sources earn fewer points:
- Paid search: 15 points for broader targeting.
- Social media ads: 10 points for awareness campaigns.
- Display advertising: 10 points for wide-net approach.
- Cold outreach responses: 15 points for initiated interest.
Accurately track sources using UTM parameters, referral codes, and form fields. Adjust scoring based on historical conversion data for example, webinar leads converting at 25% should score higher than paid search leads converting at 8%.
Framework 4: Purchase intent scoring
Purchase intent scoring differentiates “just browsing” from prospects ready to buy. This framework highlights prospects actively searching for solutions today.
High-intent actions earn maximum points because they signal immediate needs:
- Pricing page engagement (3+ minutes): 40 points.
- Demo request submissions: 50 points.
- Free trial signups: 45 points.
- Contact sales forms: 50 points.
Comparison research indicates shortlist building:
- Competitor comparison pages: 35 points.
- Comparison guide downloads: 40 points.
- Alternative solution content: 30 points.
Implementation questions reveal near-term plans:
- Rollout timing questions: 30 points.
- Implementation support inquiries: 25 points.
- Migration assistance questions: 35 points for solution replacement.
Budget discussions signal purchase readiness:
- Pricing tier questions: 25 points.
- ROI calculator usage: 30 points.
- Payment term inquiries: 35 points.
- Multiple stakeholder engagement: +20 points for two contacts, +25 for three, +30 for four or more.
Framework 5: Account-based scoring
Account-based scoring evaluates the whole organization rather than individual leads. When multiple people influence purchases, five engaged contacts indicate a stronger opportunity than one highly scored individual. This approach aligns with market trends, as 19% of B2B decision makers report AI is already part of buying and selling processes.
Total account engagement uses aggregate scoring across all contacts:
- Base calculation: Five contacts averaging 40 points each = 200 base points.
- Recency weighting: Last 30 days = full score, 31-60 days = 75%, 61-90 days = 50%.
Stakeholder diversity indicates organizational buy-in:
- Two departments engaged: +20 points.
- Three departments: +25 points.
- Four or more departments: +30 points.
- Key combination (sales + IT + finance): +10 bonus points.
Account penetration measures stakeholder coverage:
- 30% penetration: +15 points.
- 50% penetration: +20 points.
- 70%+ penetration: +25 points.
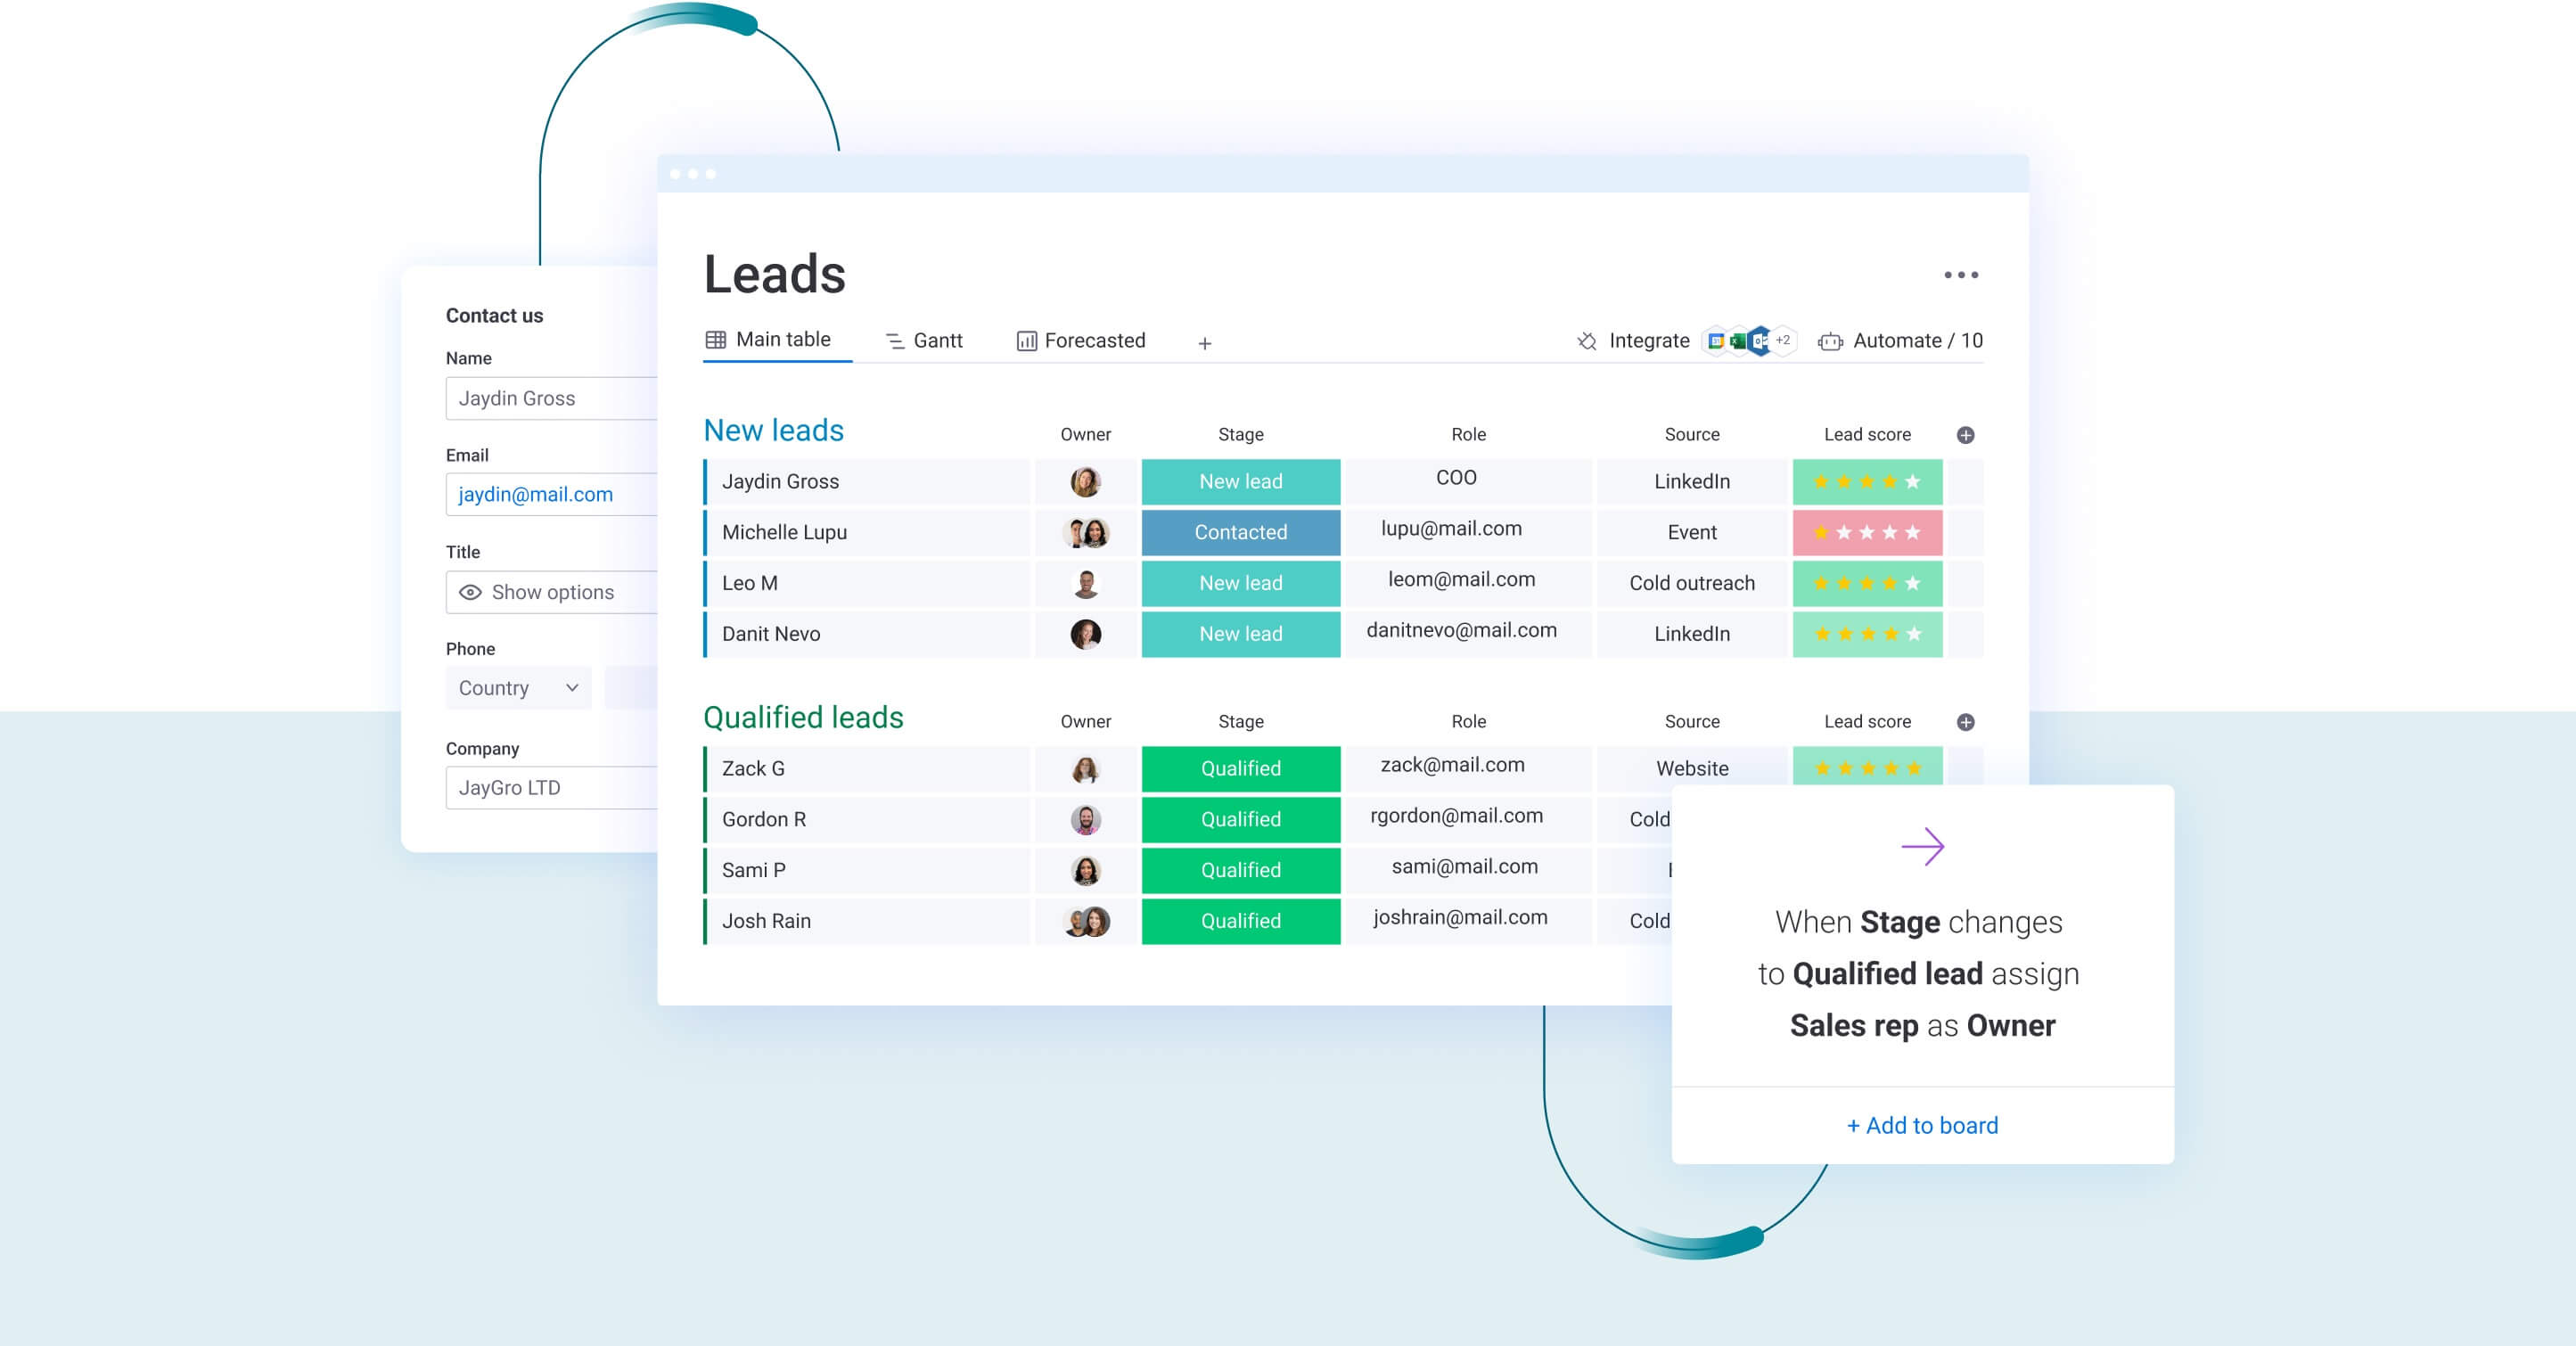
Platforms like monday CRM aggregate individual scores into comprehensive account views, providing stakeholder maps that show which departments and seniority levels are engaged across the buying committee.
Framework 6: Product interest mapping
When selling multiple products, scoring should reveal exactly what prospects are researching. Engagement with enterprise security features indicates a higher deal value than interest in free-tier options.
Feature-specific engagement indicates deal potential:
- Enterprise content: 30 points for larger deals.
- Mid-market features: 20 points for standard deals.
- Small business content: 15 points for starter deals.
- Integration content: 25 points for technical sophistication.
Use case complexity shows deal size:
- Complex multi-team implementations: 35 points.
- Department-specific use cases: 25 points.
- Individual use cases: 15 points.
- Industry-specific engagement: 10 bonus points for high-value verticals.
Demo specificity highlights precise needs:
- Enterprise demos: 45 points.
- Professional tier demos: 30 points.
- Basic tier demos: 20 points.
- Custom demo requests: 40 points regardless of tier.
Framework 7: AI-predictive scoring
AI lead scoring identifies patterns humans may miss, continuously improving as it analyzes which behaviors and characteristics lead to closed deals.
Pattern recognition reveals high-converting journeys:
- Multi-step journeys: pricing → case studies → pricing within seven days converts at 40%.
- Sequence analysis: other patterns convert at only 15%, highlighting optimal engagement paths.
Predictive modeling analyzes hundreds of variables:
- Comprehensive analysis: Demographics, behaviors, timing, engagement frequency, and content preferences.
- Correlation weighting: Based on actual conversion data in your business.
Lookalike modeling identifies prospects similar to your best customers:
- Customer analysis: AI examines the top 20% of customers for shared traits.
- Similarity scoring: Leads matching 80% or more of best customer patterns earn maximum points.
Modern platforms like monday CRM enable predictive scoring without requiring a data science team. The intelligent solution analyzes historical data, suggests optimal rules, and continuously refines predictions based on new conversions and losses.
Try monday CRMBuild your lead scoring model in 4 steps
Creating a lead scoring system that delivers results requires a careful and well thought out approach. Follow these four steps below to base your rules on actual buyer patterns rather than assumptions. This ensures your scoring model predicts lead quality accurately and supports measurable sales growth.
Step 1: Define your ideal customer profile
Begin by analyzing your existing customers to identify those who convert consistently and generate the most value. Export your customer list and segment by revenue, retention, expansion potential, and profitability. Your ideal customers are not only those who purchase but also those who stay, expand, and create sustainable profit.
Focus on your top performers:
- Identify top 20%: Analyze customers by lifetime value.
- Find patterns: Look for demographic and firmographic patterns appearing in 60%+ of this group.
- Document criteria: Record eight to ten specific, measurable characteristics.
Create concrete ICP criteria such as:
- Technology companies with 100-500 employees.
- $10M-$50M annual revenue.
- Using specific technology platforms.
- Located in North America.
- VP+ level decision makers.
- Experiencing 20%+ annual growth.
These criteria become your highest-scoring demographic factors.
Step 2: Map buyer journey touchpoints
A lead analytics dashboard ensures you capture every engagement opportunity across the buyer journey. Prospects interact through multiple channels, and each action provides valuable scoring insights.
Awareness stage touchpoints indicate problem recognition:
- Blog visits: +5 points for initial research.
- Social media views: +5 points for brand discovery.
- Organic search arrivals: +10 points for problem searches.
Consideration stage touchpoints show solution evaluation:
- Ebook downloads: +15 points for deeper research.
- Webinar registrations: +20 points for time commitment.
- Product page visits: +20 points for solution research.
Decision stage touchpoints reveal purchase readiness:
- Demo requests: +50 points for explicit intent.
- Pricing page visits: +30 points for cost evaluation.
- Case study downloads: +25 points for proof seeking.
- ROI calculator usage: +30 points for business case building.
Step 3: Assign point values to actions
Points should reflect conversion correlation rather than arbitrary choices. Analyze closed-won deals from the past year to determine which actions precede conversions.
Use a 100-point scale for intuitive thresholds:
- 75+ points: Hot leads requiring immediate attention.
- 50-74 points: Warm leads for active nurturing.
- 25-49 points: Cool leads for automated sequences.
- Below 25: Cold leads for basic marketing.
Weight actions by conversion impact:
| Action | Conversion rate | Base points | 30-day decay | 60-day decay |
|---|---|---|---|---|
| Demo request | 60% | 50 | 38 | 25 |
| Pricing visit | 35% | 30 | 23 | 15 |
| Case study | 25% | 20 | 15 | 10 |
| Webinar | 20% | 15 | 11 | 8 |
| Blog read | 5% | 5 | 4 | 3 |
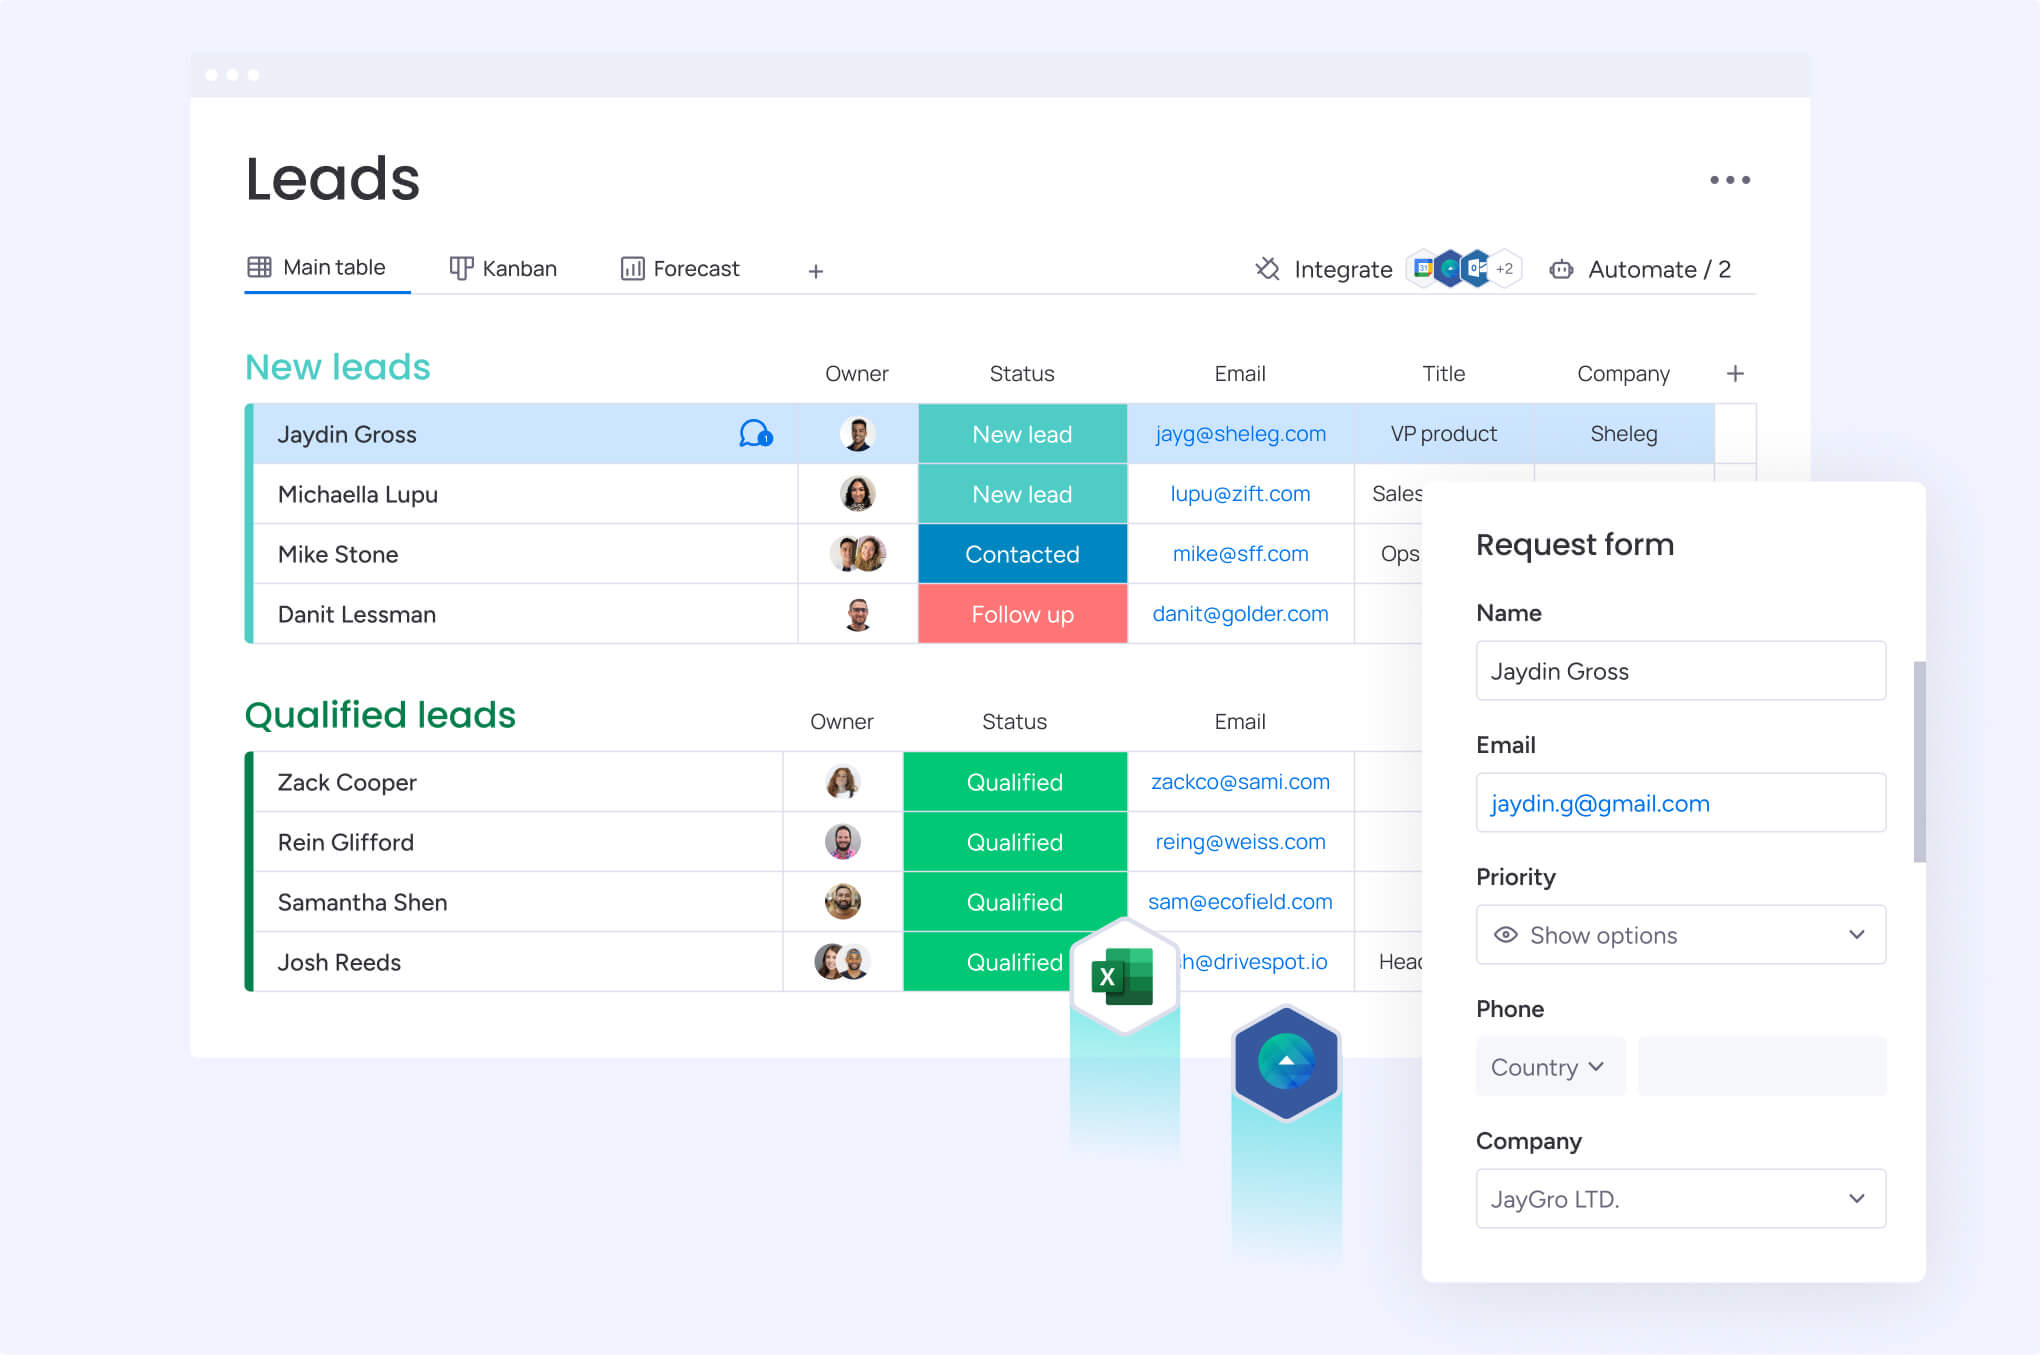
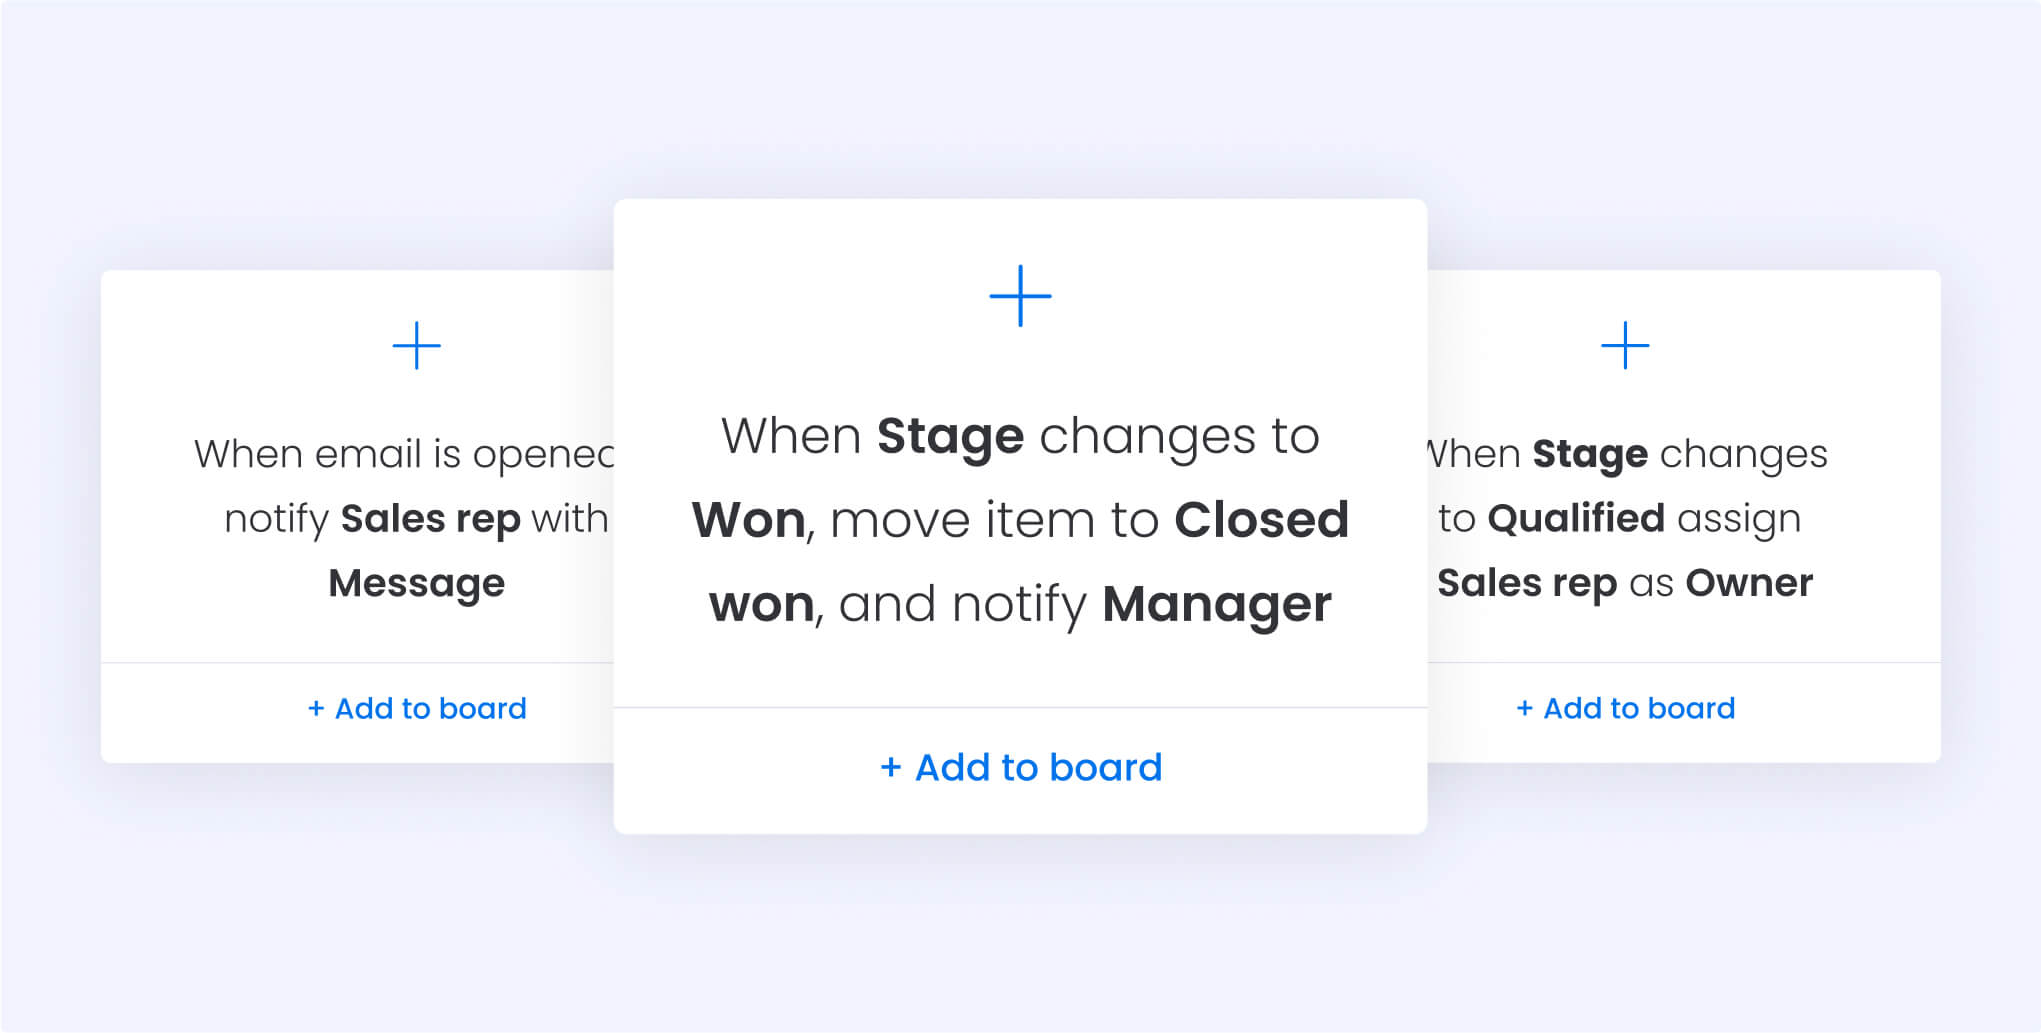
Modern platforms like monday CRM can automate these scoring rules as prospects engage. AI can also suggest optimal point values based on historical conversion data.
Step 4: Set MQL thresholds and handoffs
Marketing qualified lead (MQL) thresholds balance lead quality with pipeline volume. Review scores from the last 6–12 months and analyze conversion rates by range. Natural inflection points highlight where leads are most likely to convert.
Start with conservative thresholds:
- Capture the top 20% of leads by score.
- If the average lead scores 35 points, set an initial MQL threshold at 70 points.
- Monitor metrics over 30 days: MQL volume, MQL-to-SQL conversion, and SQL-to-closed conversion.
Define clear handoff processes for different score ranges:
- 90+ points: Immediate phone call within two hours.
- 75–89 points: Email outreach within 24 hours.
- 60–74 points: Nurture with personalized content.
- Below 60 points: Marketing automation only.
“With monday CRM, we’re finally able to adapt the platform to our needs — not the other way around. It gives us the flexibility to work smarter, cut costs, save time, and scale with confidence.”
Samuel Lobao | Contract Administrator & Special Projects, Strategix“Now we have a lot less data, but it’s quality data. That change allows us to use AI confidently, without second-guessing the outputs.”
Elizabeth Gerbel | CEO“Without monday CRM, we’d be chasing updates and fixing errors. Now we’re focused on growing the program — not just keeping up with it."
Quentin Williams | Head of Dropship, Freedom Furniture“There’s probably about a 70% increase in efficiency in regards to the admin tasks that were removed and automated, which is a huge win for us.“
Kyle Dorman | Department Manager - Operations, Ray White"monday CRM helps us make sure the right people have immediate visibility into the information they need so we're not wasting time."
Luca Pope | Global Client Solutions Manager at Black Mountain“In a couple of weeks, all of the team members were using monday CRM fully. The automations and the many integrations, make monday CRM the best CRM in the market right now.”
Nuno Godinho | CIO at VelvLead scoring criteria that actually convert
Not every action deserves equal weight. The most effective lead scoring systems focus on signals that consistently appear before closed deals.
Your own sales data should guide final point values, but most high-performing teams rely on three core categories: high-intent behaviors that signal buying readiness, firmographic traits that reflect ideal customer fit, and negative triggers that filter out wasted effort.
The sections below break down the criteria that typically have the strongest impact on conversion.
High-intent behaviors worth maximum points
Immediate purchase signals deserve the highest scores because they indicate active evaluation and near-term buying decisions.
Immediate purchase signals include:
- Pricing page engagement (3+ minutes): 40 points for cost consideration.
- Demo request submissions: 50 points for sales conversation request.
- Free trial signups: 45 points for hands-on evaluation.
- Competitor comparison research: 35 points for shortlist building.
Strong purchase indicators include:
- Multiple product page visits (3+ in one session): 30 points for thorough research.
- Case study downloads: 25 points for validation seeking.
- Webinar attendance: 20 points for education investment.
- Multiple website sessions (5+ in 30 days): 20 points for sustained interest.
Firmographic factors for B2B scoring
Company characteristics that align with your ideal customer profile provide strong predictive value for conversion likelihood and deal size.
Company characteristics:
- Employee count in target range: +30 points for size fit.
- Industry match: +25 points for vertical alignment.
- Geographic location: +20 points for market presence.
- Technology stack compatibility: +15 points for integration potential.
Decision-maker attributes:
- C-level title: +30 points for final approval power.
- VP/Director level: +25 points for budget control.
- Manager level: +15 points for influence.
- Verified business email: +10 points for legitimacy.
Negative scoring triggers to filter out
Disqualifying characteristics prevent wasted sales effort by identifying prospects unlikely to convert or generate value.
Disqualifying characteristics:
- Competitor employees: -50 points for competitive research.
- Students: -30 points unless targeting education.
- Job seekers: -25 points for career research.
- Personal email addresses: -25 points in B2B context.
Poor engagement patterns:
- Email unsubscribes: -25 points for explicit disinterest.
- Bounced emails: -20 points for invalid contact.
- No activity after initial visit: -10 points for one-time curiosity.
- Fake form data: -30 points for spam submissions.
AI-powered scoring rules for sales teams
AI transforms lead scoring from static rules into intelligent systems that continuously improve. Modern AI capabilities make advanced scoring accessible to teams without dedicated data science resources, enabling more accurate predictions and automated optimization.
Let AI suggest your initial rules
AI analyzes historical data to recommend scoring rules based on actual conversion patterns. Machine learning examines thousands of leads and their outcomes to identify which characteristics and behaviors correlate with closed deals.
Pattern analysis reveals unexpected insights:
- Behavioral sequences: AI identifies that prospects visiting pricing pages twice within seven days convert at 40%.
- Single visits: Convert at only 18%, highlighting the importance of timing.
- Complex journeys: Multi-step engagement patterns exceed the complexity of manual rules.
Correlation discovery uncovers non-obvious factors:
- Timing patterns: Tuesday afternoon engagement converts 30% higher than Monday morning.
- Page combinations: Prospects viewing exactly three product pages convert more than two or four.
- Engagement depth: Specific session durations correlate with higher conversion.
AI features on intelligent platforms like monday CRM analyze your data and suggest optimal scoring rules, explaining the reasoning behind each recommendation so your team understands why certain actions carry higher scores.
Implement automatic score decay
Time-based score reduction keeps lead scores current and prevents outdated high-scoring leads from cluttering pipelines while ensuring recently engaged prospects receive proper attention.
Behavioral point decay:
- Monthly reduction: 25% decrease without new activity.
- Example progression: 40 points → 30 (30 days) → 23 (60 days) → 17 (90 days).
- Reset mechanism: New engagement boosts scores back up.
Different decay rates by action type:
- Demographic scores: Remain stable since job titles rarely change quickly.
- High-intent behaviors: Decay faster as purchase urgency diminishes.
- Demo requests: Lose 50% value after 30 days.
- Whitepaper downloads: Decay more slowly for longer research cycles.
Track zero-click intent signals
Zero-click intent identifies prospects showing purchase interest through external research behavior, allowing sales teams to engage leads before they interact directly with your brand.
Intent data tracking monitors keyword research and content consumption across the web:
- Solution searches: Prospects researching your category indicate buying intent.
- Problem content: Reading articles about challenges you solve signals need recognition.
Organizational signals indicate buying windows:
- New leadership hires: +30 points for potential change agents.
- Funding announcements: +25 points for available budgets.
- Expansion news: +20 points for growth needs.
- Technology adoption: +15 points for integration opportunities.
Best practices for an effective lead scoring system
.jpg)
A scoring model only works if the sales team trusts it. When rules feel arbitrary or outdated, reps default back to instinct. The goal is clarity, relevance, and alignment across teams.
Below are the most common mistakes that weaken adoption and how to avoid them.
Creating overly complex rule systems
Excessive complexity reduces usability and trust. Systems with 20+ criteria and arbitrary point values often revert sales teams to gut instincts.
Simplicity principles:
- Focus on five to seven criteria that predict 80% of conversions.
- Group similar behaviors rather than scoring every page individually.
- Use clear categories: product pages +15 points, pricing pages +25 points, general content +5 points.
Visual rule builders on modern platforms like monday CRM make scoring logic transparent and easy to adjust without technical expertise.
Ignoring time-based score adjustments
Static scores become outdated quickly. A lead who earned 80 points six months ago but has not engaged recently should not rank above someone with 60 recent points.
Time-based adjustments:
- Recent actions: Indicate current interest and urgency.
- Older actions: Reflect historical curiosity that may no longer be relevant.
- Decay implementation: Last 30 days = full points, 31–60 days = 75%, 61–90 days = 50%.
This keeps your pipeline focused on active prospects rather than outdated opportunities.
Missing cross-team alignment on definitions
Sales and marketing alignment ensures consistent understanding of lead quality. Misalignment wastes time and causes friction.
Alignment strategies:
- Regular review meetings: Evaluate lead quality and adjust thresholds using conversion data.
- Feedback loops: Share insights about why leads did not convert to refine scoring.
- Shared dashboards: Provide transparent performance metrics to all teams.
Turn lead scoring into revenue acceleration with monday CRM
Lead scoring moves from a nice-to-have feature into a revenue-driving system when implemented strategically. Using the frameworks outlined above, sales teams can prioritize prospects with the highest conversion likelihood, reduce wasted effort on low-value leads, and respond quickly to hot opportunities.
Starting simple is key. Begin with five to seven core criteria that predict most conversions, then iterate based on actual performance in your market.
Modern and sophisticated platforms like monday CRM remove guesswork with AI-powered scoring, providing transparency into why leads score higher. Automated scoring applies rules instantly as prospects engage, while continuous learning improves prediction accuracy over time.
Get started with monday CRM today and move one step closer to revenue acceleration.
Try monday CRMFrequently asked questions
How often should you update lead scoring rules?
To maintain accurate lead prioritization, review lead scoring rules quarterly and update them immediately if conversion patterns shift significantly or new products are introduced. Monthly performance checks help identify when refinements are needed, but avoid constant changes that compromise reliable measurement.
What's the difference between lead scoring and lead grading?
Lead scoring assigns numerical values based on engagement and behavior, while lead grading evaluates demographic fit using letter grades. The most effective approach combines both: use grades for demographic alignment and scores to measure behavioral engagement.
How many lead scoring criteria should you start with?
Start with five to seven key criteria that focus on the most predictive factors, such as job title, company size, and high-intent behaviors like demo requests. A simpler setup allows you to test effectiveness and gradually introduce more complexity as you better understand what drives conversions.
What's the ideal score threshold for sales handoff?
Set your initial threshold to capture the top 20% of leads by score, often 50–75 points on a 100-point scale. Adjust based on sales capacity and conversion performance, aiming for thresholds that typically result in 15–25% of marketing-qualified leads converting to closed deals.
Can small businesses implement lead scoring effectively?
Small businesses can successfully use lead scoring by focusing on three to five core criteria and leveraging automated platforms to reduce technical overhead. Begin with basic demographic and behavioral scoring, then expand as you gather more conversion insights.
How do you score buying groups vs individual leads?
Evaluate buying groups by aggregating individual lead scores within an account and adding bonus points for stakeholder diversity. Give greater weight to decision-maker engagement while rewarding broad organizational interest through multiple contacts interacting across departments.