
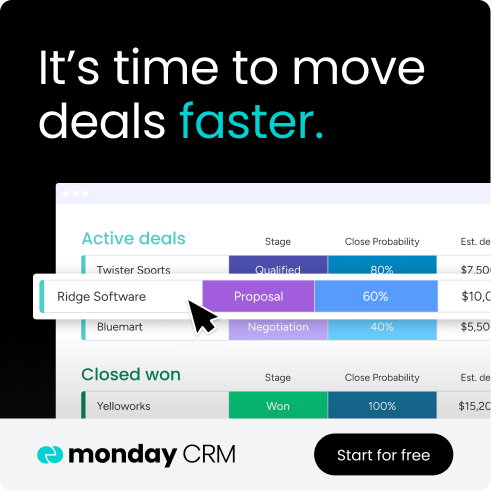
Sales teams close deals every day, but which opportunities will actually convert? Revenue leaders often rely on outdated reports and intuition, transforming forecasts into guesswork rather than strategic planning. Limited pipeline visibility, restricted to weekly spreadsheets and monthly reviews, causes teams to miss critical warning signs and scramble when targets approach.
CRM dashboards transform this dynamic by converting raw sales data into real-time insights that enable immediate action. Rather than waiting for reports detailing last week’s activities, dashboards reveal current pipeline status across all stages. The visibility shows which deals require attention, which representatives need support, and whether targets remain achievable.
This guide provides comprehensive instruction for building dashboards that deliver measurable results, from metric selection and visualization design to AI-powered features that predict outcomes before they materialize.
Key takeaways
- Real-time visibility beats outdated reports: CRM dashboards show what’s happening now, not last week, so you can fix problems before they cost you deals.
- Track the right metrics to predict success: focus on pipeline health, revenue performance, and sales activities — the three categories that actually drive results.
- Different roles need different dashboard views: sales reps, managers, and executives each need customized metrics that match their responsibilities and decision-making needs.
- Drag-and-drop builders create dashboards in minutes: modern platforms like monday CRM skip the technical complexity with pre-built templates, customizable widgets, and AI features that automatically highlight deals needing attention.
- AI transforms dashboards from reporting to intelligence: predictive deal scoring, anomaly detection, and automated recommendations help teams focus effort where it matters most.
What are CRM dashboards?
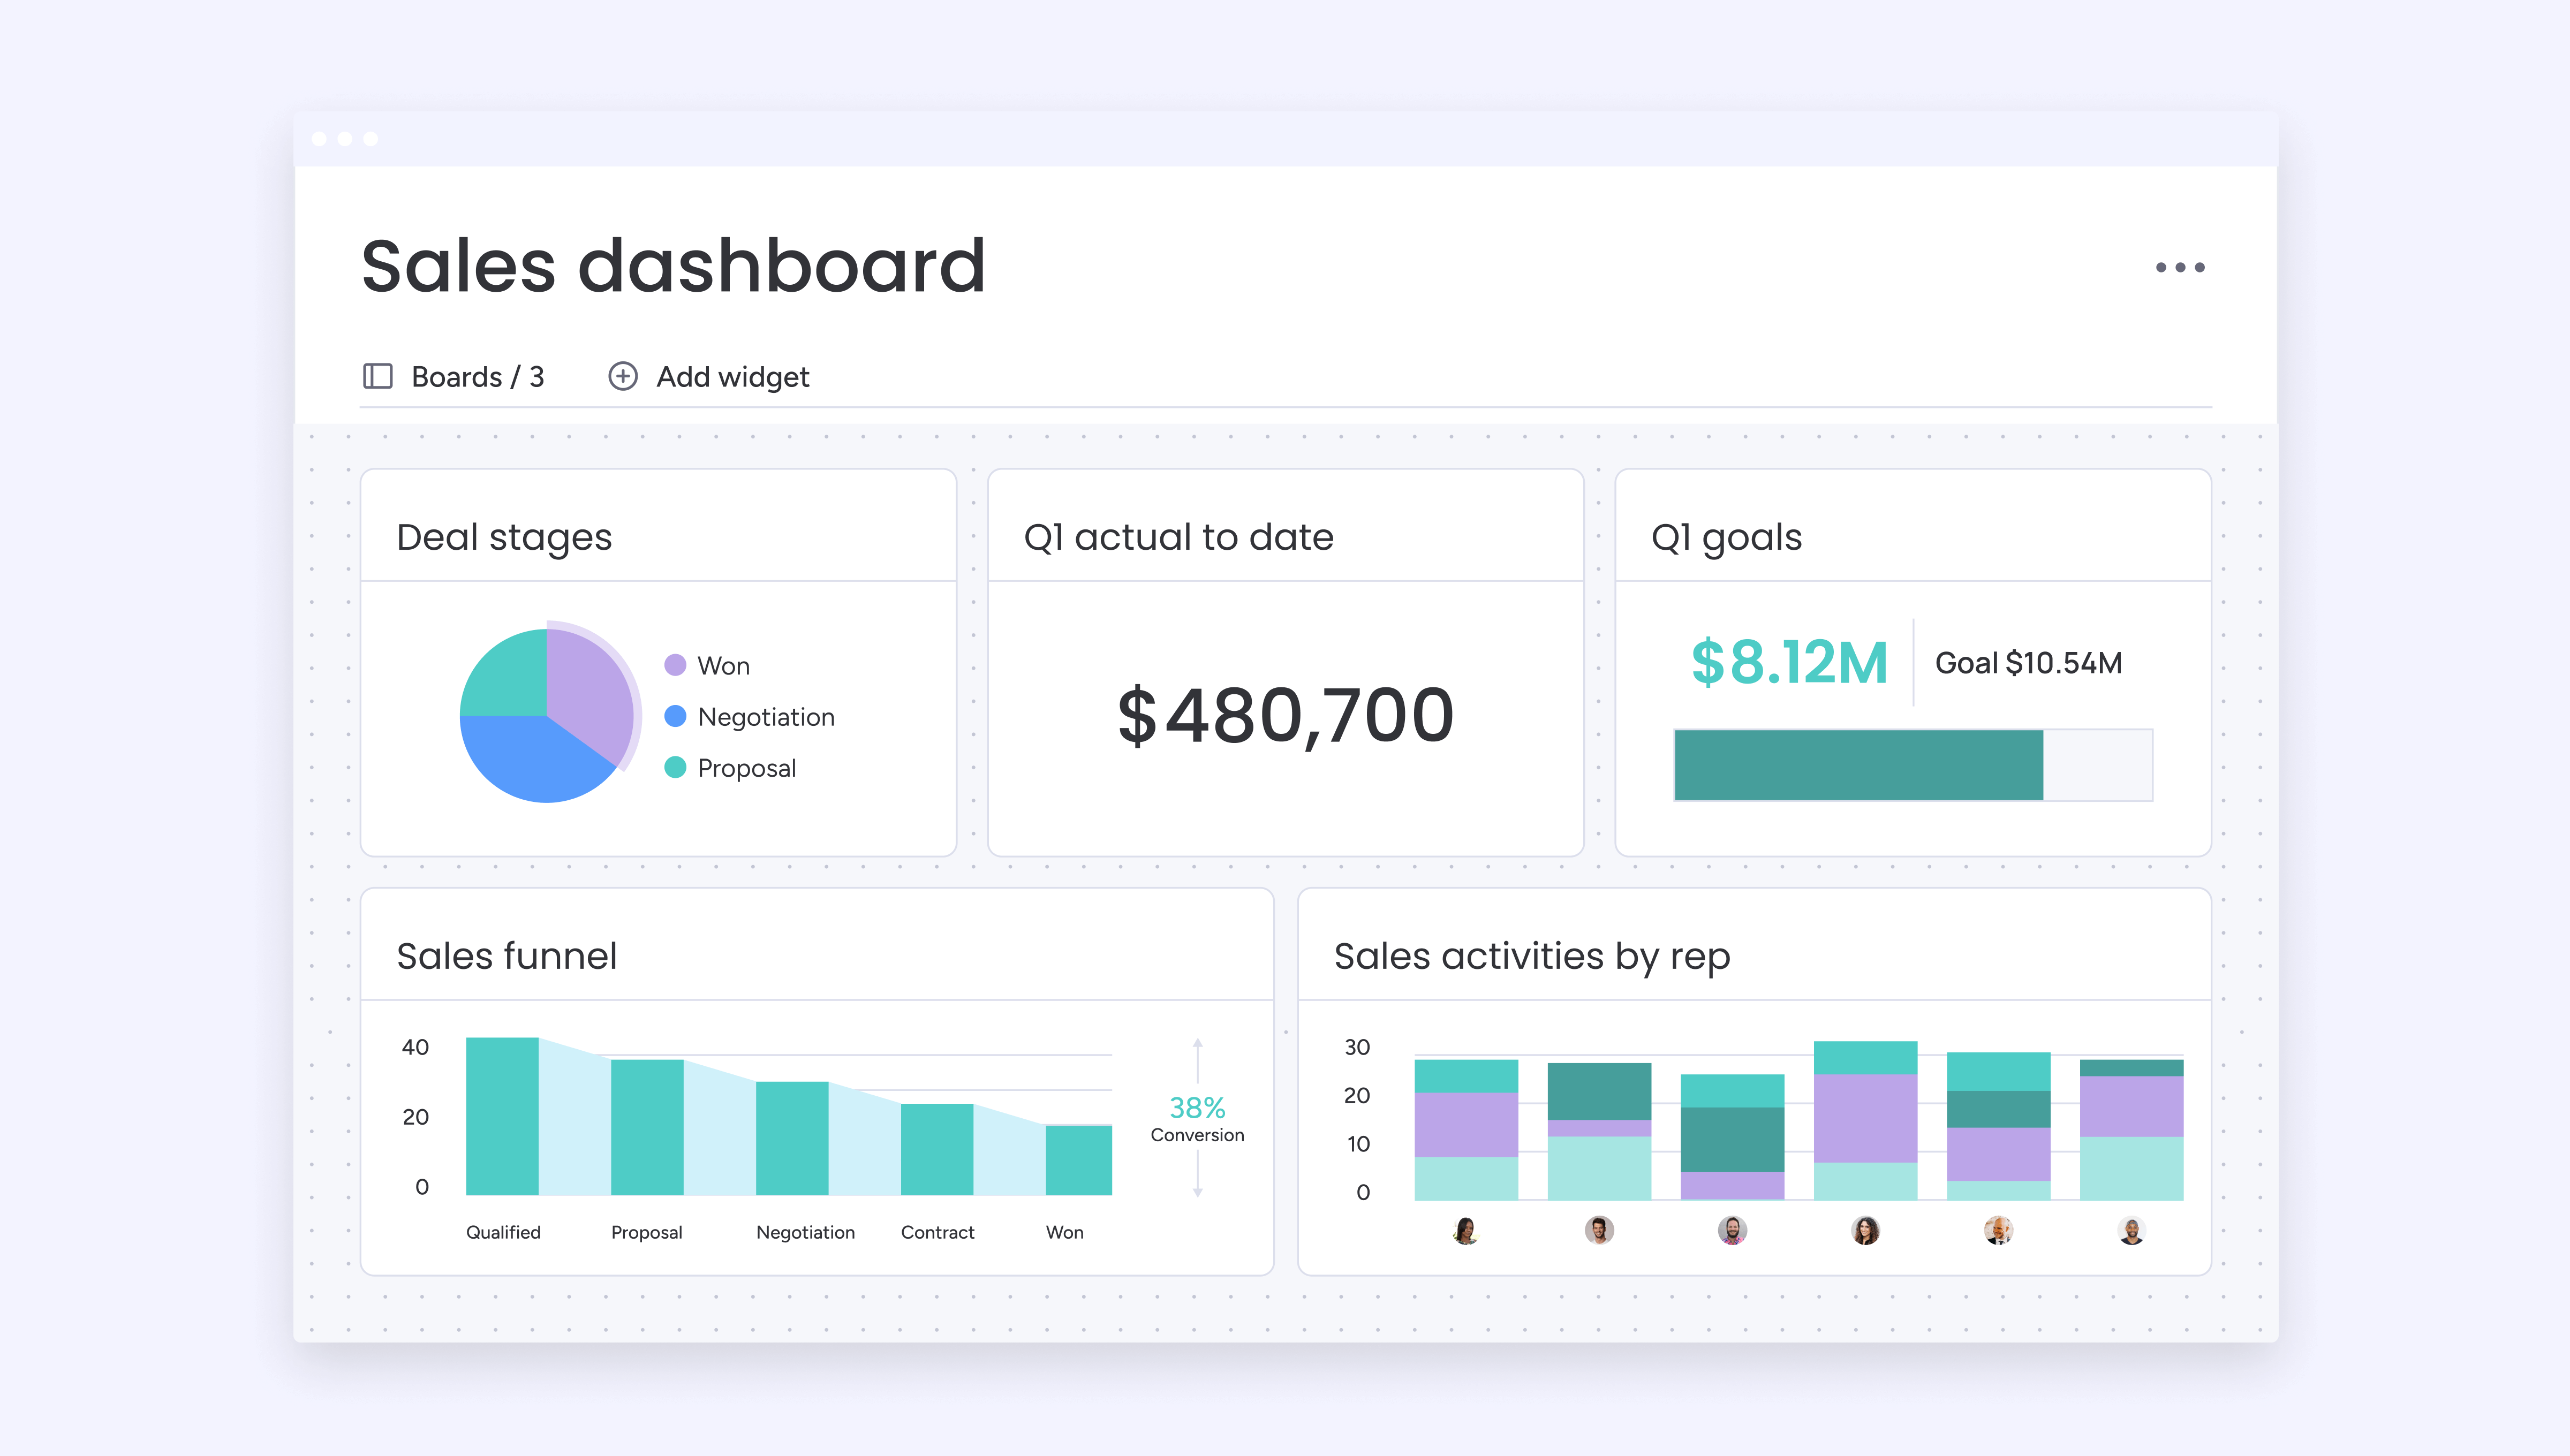
CRM dashboards work like visual command centers, turning raw sales data into charts and metrics you can act on. They’re your sales mission control: giving you a single, live view of performance. You see exactly what’s happening, right now.
These platforms pull live information directly from your CRM system and update automatically as deals progress and customer interactions occur without manual compilation or data lag. When a representative logs a call or advances a deal, that information immediately reflects in the dashboard, giving you current performance at a glance.
However, what makes dashboards truly powerful is their ability to make complex data instantly understandable. Teams can identify patterns that raw numbers obscure, and each user receives precisely the view they need for their specific role. Sales managers track team performance and coaching opportunities, while executives monitor revenue forecasts and pipeline health.
The advantages of dashboards over traditional reporting
CRM dashboards deliver distinct advantages over traditional reporting methods that fundamentally change how sales teams operate. Leading organizations are making the switch for these reasons:
- Real-time visibility vs. outdated snapshots: static reports tell you what happened last week. Dashboards show you what’s happening now and what needs your attention immediately.
- Eliminate data lag: traditional reports leave you behind as you spend hours compiling and formatting data, and by the time you distribute it, it’s already outdated. Deals have moved forward and new opportunities have emerged, costing you the chance to solve problems early and protect your results.
- Proactive problem-solving: real-time dashboards eliminate lag entirely. You spot bottlenecks as they form, not after they’ve cost you deals. You see which reps need support today, not at the end of the month when quotas are already missed.
- Immediate coaching opportunities: the shift from periodic reports to continuous visibility changes team dynamics. Instead of waiting for scheduled reviews, managers coach in the moment. Reps self-correct when they see their metrics dipping.
- Single source of truth: everyone stays aligned because they’re looking at the same live data, not different versions of outdated spreadsheets.
Essential KPIs every CRM dashboard must track
Selecting the right KPIs determines whether your dashboard drives action or becomes ignored noise, and sales dashboard templates can help you display these metrics effectively. The most effective dashboards balance forward-looking indicators that predict future performance with historical metrics that measure results, which a sales dashboard template can help organize.
Below you’ll find the three critical categories every sales dashboard needs.
Pipeline health metrics
Pipeline health indicators show you the quality and momentum of your potential revenue before deals even close. Skip these metrics and you’re basically running on hope instead of data; guaranteed to miss targets and scramble at the last minute.
The metrics that provide predictive intelligence about your pipeline include:
- Deal velocity: average time from first contact to closed deal, helping you forecast when opportunities will convert.
- Pipeline coverage: ratio of total pipeline value to quota targets, indicating whether you have sufficient opportunities.
- Stage conversion rates: percentage of deals progressing between stages, identifying where prospects stall.
- Pipeline aging: how long deals remain in specific stages, highlighting stagnant opportunities.
Teams using platforms like monday CRM discover these metrics update automatically through customizable pipeline widgets and conditional labels that flag deals requiring immediate attention, which a sales dashboard templates guide can simplify.
Revenue performance indicators
Financial metrics connect sales activities directly to business results, and sales dashboard templates examples illustrate their practical impact. They answer the ultimate question: are we hitting our targets and generating profitable growth?
Accountability is driven by these critical revenue metrics:
- Monthly/quarterly revenue: actual revenue compared to targets reveals whether you’re on track.
- Average deal size: trends in deal value indicate pricing pressure or successful upselling.
- Win rate: percentage of qualified opportunities that close successfully.
- Revenue per rep: individual and team revenue generation normalized across territories.
Sales activity tracking
Activity metrics predict future revenue by tracking the behaviors that generate pipeline. These leading indicators help managers distinguish between effort issues and skill gaps when diagnosing performance problems.
Essential activity measurements include:
- Call volume: daily and weekly outreach measuring prospecting effort.
- Email engagement: open and response rates revealing message effectiveness.
- Meeting conversion: ratio of scheduled to completed meetings.
- Follow-up consistency: time between touchpoints ensuring opportunities stay warm.
How CRM dashboards drive sales performance?
Dashboard visibility creates specific behavioral changes that directly improve sales outcomes, a principle supported by a sales dashboard templates approach. Understanding these performance drivers helps teams maximize their dashboard investment. With advanced platforms like monday CRM, teams can leverage these principles to achieve measurable results.
When teams see their performance in real time, they make faster corrections and maintain focus on high-impact activities, which a sales dashboard templates reference can streamline.
The following drivers demonstrate how visibility translates into improved sales outcomes:
- Real-time performance visibility: enables immediate course corrections. A rep who sees declining activity metrics on Tuesday adjusts their schedule for the rest of the week. Managers spot underperforming territories within hours and reallocate resources before issues compound.
- Data-driven coaching opportunities: emerge when managers identify specific patterns across their team. One rep consistently converting demos at twice the average reveals a best practice worth sharing. Another struggling with stage-three conversions receives targeted objection handling training rather than generic sales coaching.
- Competitive motivation: develops naturally when performance metrics are visible. Sales professionals respond to leaderboards by increasing effort and adopting successful tactics from top performers. Teams achieve this using solutions like monday CRM’s leaderboard widget to create healthy competition without management pressure.
- Predictable forecasting: becomes possible when dashboards aggregate pipeline data with historical patterns. Revenue leaders provide accurate guidance because they’re working from comprehensive data rather than gut feelings. AI capabilities enhance forecasting by identifying patterns humans miss.
7 CRM dashboard types delivering results
To maximize the impact of your data, you must tailor views to specific roles. While a representative needs execution metrics to manage their day, an executive requires a high-level strategic overview. Smart companies customize their visibility through these seven proven dashboard types:
1. Sales pipeline dashboard
Pipeline dashboards give managers operational visibility for weekly reviews and resource allocation. These dashboards answer critical questions about deal flow and forecast accuracy.
Key components of an effective pipeline dashboard:
- Total pipeline value by stage: shows distribution of opportunities.
- Weighted forecast amount: applies probability to each stage.
- Deals closing this period: highlights immediate priorities.
- Stage conversion trends: reveals process improvements or degradation.
Visual elements like funnel charts show progression, while bar graphs compare individual pipelines. Organizations using modern platforms like monday CRM leverage drag-and-drop widgets to customize these views for their specific sales cycle.
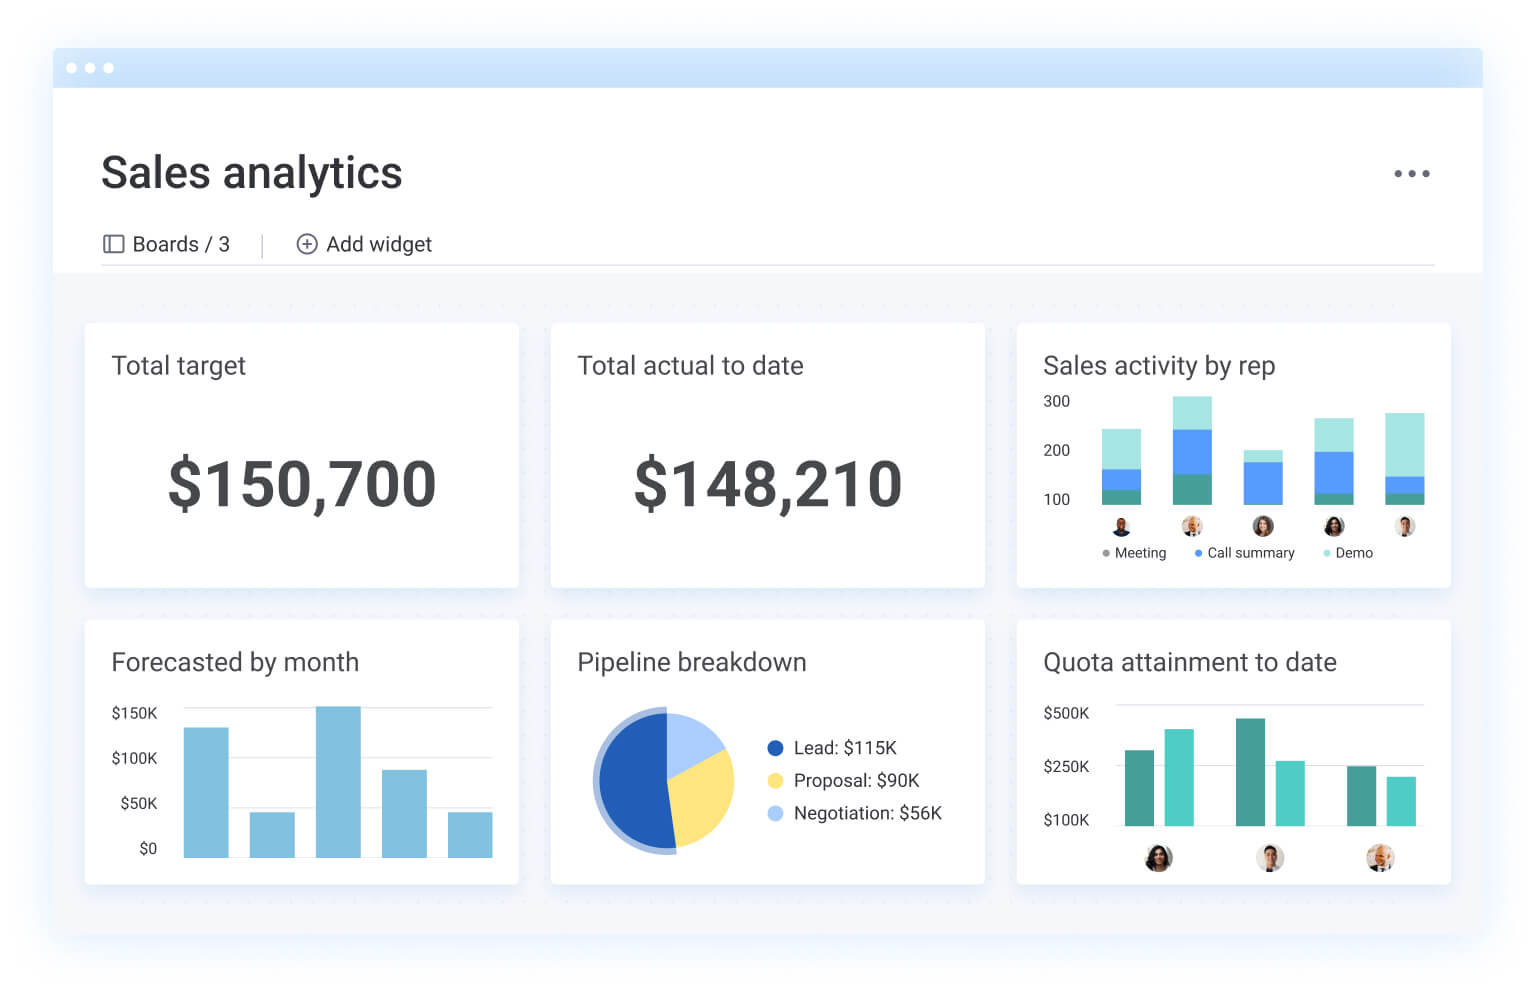
2. Revenue forecast dashboard
Forecast dashboards combine current pipeline with historical patterns to project quarterly performance. Executives and revenue operations teams rely on these for strategic planning and investor communications.
Critical forecast dashboard elements:
- Committed vs. best-case scenarios: shows a range of possible outcomes.
- Pipeline coverage ratios: indicates forecast confidence.
- Variance from targets: highlights gaps requiring action.
- Historical accuracy trends: validates forecasting methodology.
3. Team performance leaderboard
Leaderboards drive motivation through visible performance rankings. These dashboards make achievement transparent while helping underperformers identify improvement areas.
Effective leaderboard metrics include:
- Revenue rankings: current period performance.
- Activity scores: leading indicator compliance.
- Win rate comparisons: efficiency metrics.
- Goal achievement percentages: individual target progress.
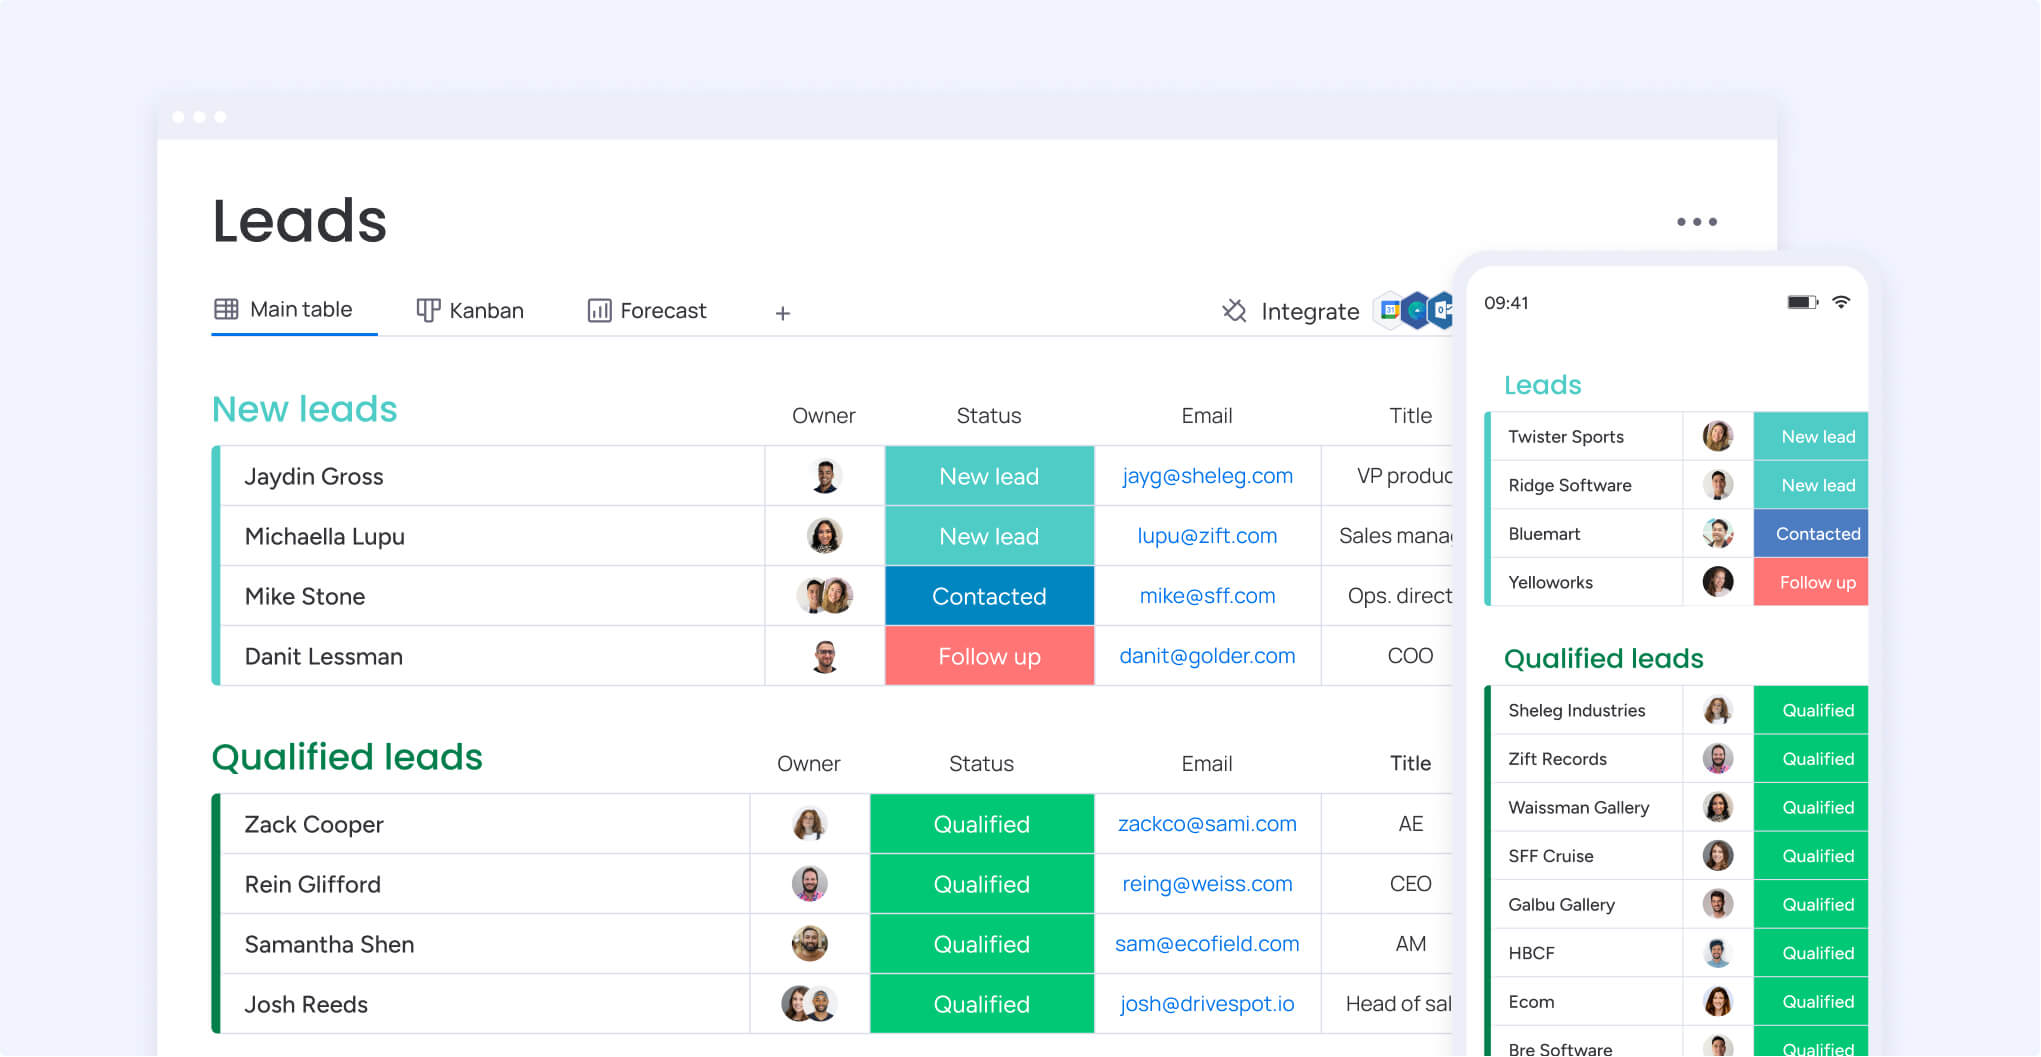
4. Lead tracking dashboard
Lead dashboards ensure alignment between marketing investment and sales-ready opportunity creation. These platforms prevent qualified prospects from falling through cracks while optimizing demand generation.
Essential lead tracking components:
- Volume by source: shows which channels deliver results.
- Qualification rates: measures lead quality.
- Response time metrics: ensures prompt follow-up.
- Conversion to opportunity: connects marketing to revenue.
5. Customer journey dashboard
Journey dashboards visualize the complete customer experience, identifying at-risk accounts and expansion opportunities before they become obvious.
Key journey visibility metrics:
- Adoption rates: product usage patterns.
- Support ticket trends: early warning indicators.
- Health score tracking: composite satisfaction metrics.
- Engagement frequency: relationship strength indicators.
6. Activity management dashboard
Activity dashboards ensure reps maintain consistent outreach while identifying which activities drive results. Managers use these to coach on both quantity and quality of customer interactions.
Core activity tracking includes:
- Daily activity completion: calls, emails, meetings logged.
- Activity-to-outcome ratios: which actions generate pipelines.
- Time allocation: where reps spend their effort.
- Coverage metrics: territory and account penetration.
7. Executive summary dashboard
Executive dashboards distill complex sales data into strategic insights without operational detail. C-level leaders need high-level metrics that guide major decisions.
Executive dashboard priorities:
- Revenue vs. target: overall business health.
- Year-over-year growth: trend analysis.
- Customer acquisition cost: efficiency metrics.
- Market share indicators: competitive position.
5 steps to build custom CRM dashboards
Creating effective dashboards follows a strategic process connecting business objectives to data visualization. Teams that approach design methodically create platforms driving adoption and value. This step-by-step framework ensures your dashboard delivers actionable insights from day one.
Step 1: map your sales process
Start with documenting each stage from initial contact through a closed deal. Identify key activities, decision points, and handoffs between teams. Consider where deals typically stall and what information managers need at each stage.
Understanding what healthy deals look like at each stage reveals which metrics matter most. Revenue teams can map their unique process using customizable pipeline stages that match their actual workflow.
Step 2: select your key metrics
Your next step should be choosing KPIs that directly support business goals and provide actionable insights. Limit each view to five to eight core metrics preventing information overload. Balance leading indicators predicting future performance with lagging indicators measuring results.
Consider whether metrics are within user control. A rep dashboard should focus on activities they can influence, while manager views include team-wide performance indicators.
Step 3: choose visualization types
Match data types to appropriate chart formats for maximum impact. Different visualizations serve different purposes:
- Bar charts: compare values across categories like rep performance.
- Line graphs: show trends over time such as pipeline growth.
- Pie charts: display proportional relationships (limit to five to six segments).
- Scatter plots: reveal relationships between variables.
Step 4: design your layout
Visual hierarchy determines whether users quickly extract insights or become overwhelmed. Place critical metrics in the top-left where eyes naturally focus. Group related measurements using white space and section headers.
Test layouts with actual users ensuring the design matches how they process information. Modern dashboard builders let teams experiment with arrangements instantly, finding optimal layouts without technical dependencies.
Step 5: automate data updates
At the end, configure automatic refresh schedules based on data change frequency and decision urgency. Sales activity metrics might update every 15 minutes while monthly revenue could refresh daily.
Integration capabilities determine whether dashboards pull data seamlessly or require manual updates. Platforms with native integrations connect email systems, marketing automation, and support platforms automatically.
“With monday CRM, we’re finally able to adapt the platform to our needs — not the other way around. It gives us the flexibility to work smarter, cut costs, save time, and scale with confidence.”
Samuel Lobao | Contract Administrator & Special Projects, Strategix“Now we have a lot less data, but it’s quality data. That change allows us to use AI confidently, without second-guessing the outputs.”
Elizabeth Gerbel | CEO“Without monday CRM, we’d be chasing updates and fixing errors. Now we’re focused on growing the program — not just keeping up with it."
Quentin Williams | Head of Dropship, Freedom Furniture“There’s probably about a 70% increase in efficiency in regards to the admin tasks that were removed and automated, which is a huge win for us.“
Kyle Dorman | Department Manager - Operations, Ray White"monday CRM helps us make sure the right people have immediate visibility into the information they need so we're not wasting time."
Luca Pope | Global Client Solutions Manager at Black Mountain“In a couple of weeks, all of the team members were using monday CRM fully. The automations and the many integrations, make monday CRM the best CRM in the market right now.”
Nuno Godinho | CIO at Velv
“monday.com provides developmental flexibility, operational efficiency, and data transparency — all in one place. We became a company that moved from chasing data to leading with it.”
Hyunghan Lee | Team Lead, Sandbox Network
"monday.com brought every part of our business into one connected space. The harmony between work management and CRM has become our operating system — giving us the clarity and confidence to scale.”
Jennifer Chinburg | Executive Vice President of Corporate Development & Brand, Chinburg Properties
“We just weren’t getting value from our old CRM. With monday.com, it's a thousand times better. Our sales teams are more informed, more consistent, and far more connected."
James Arnold | Chief Operating Officer, CenversaAI features transforming CRM dashboards
AI transforms your dashboards from backward-looking reports into forward-thinking intelligence that predicts what’s next and tells you what to do about it. You stop analyzing what happened and start seeing what’s coming.
These three AI capabilities are reshaping how sales teams use dashboard data:
- Predictive deal scoring: AI analyzes patterns across thousands of closed deals identifying characteristics correlating with success. The system scores each opportunity based on engagement frequency, stakeholder involvement, and progression pace. This capability changes resource allocation from intuition to data-driven strategy.
- Automated anomaly detection: AI monitors metrics continuously, flagging unusual patterns humans miss during routine reviews. Sudden activity drops, unexpected conversion changes, or deals progressing unusually fast trigger alerts requiring investigation. Revenue teams leverage AI capabilities provided by modern platforms like monday CRM including timeline summaries that analyze complete deal history automatically.
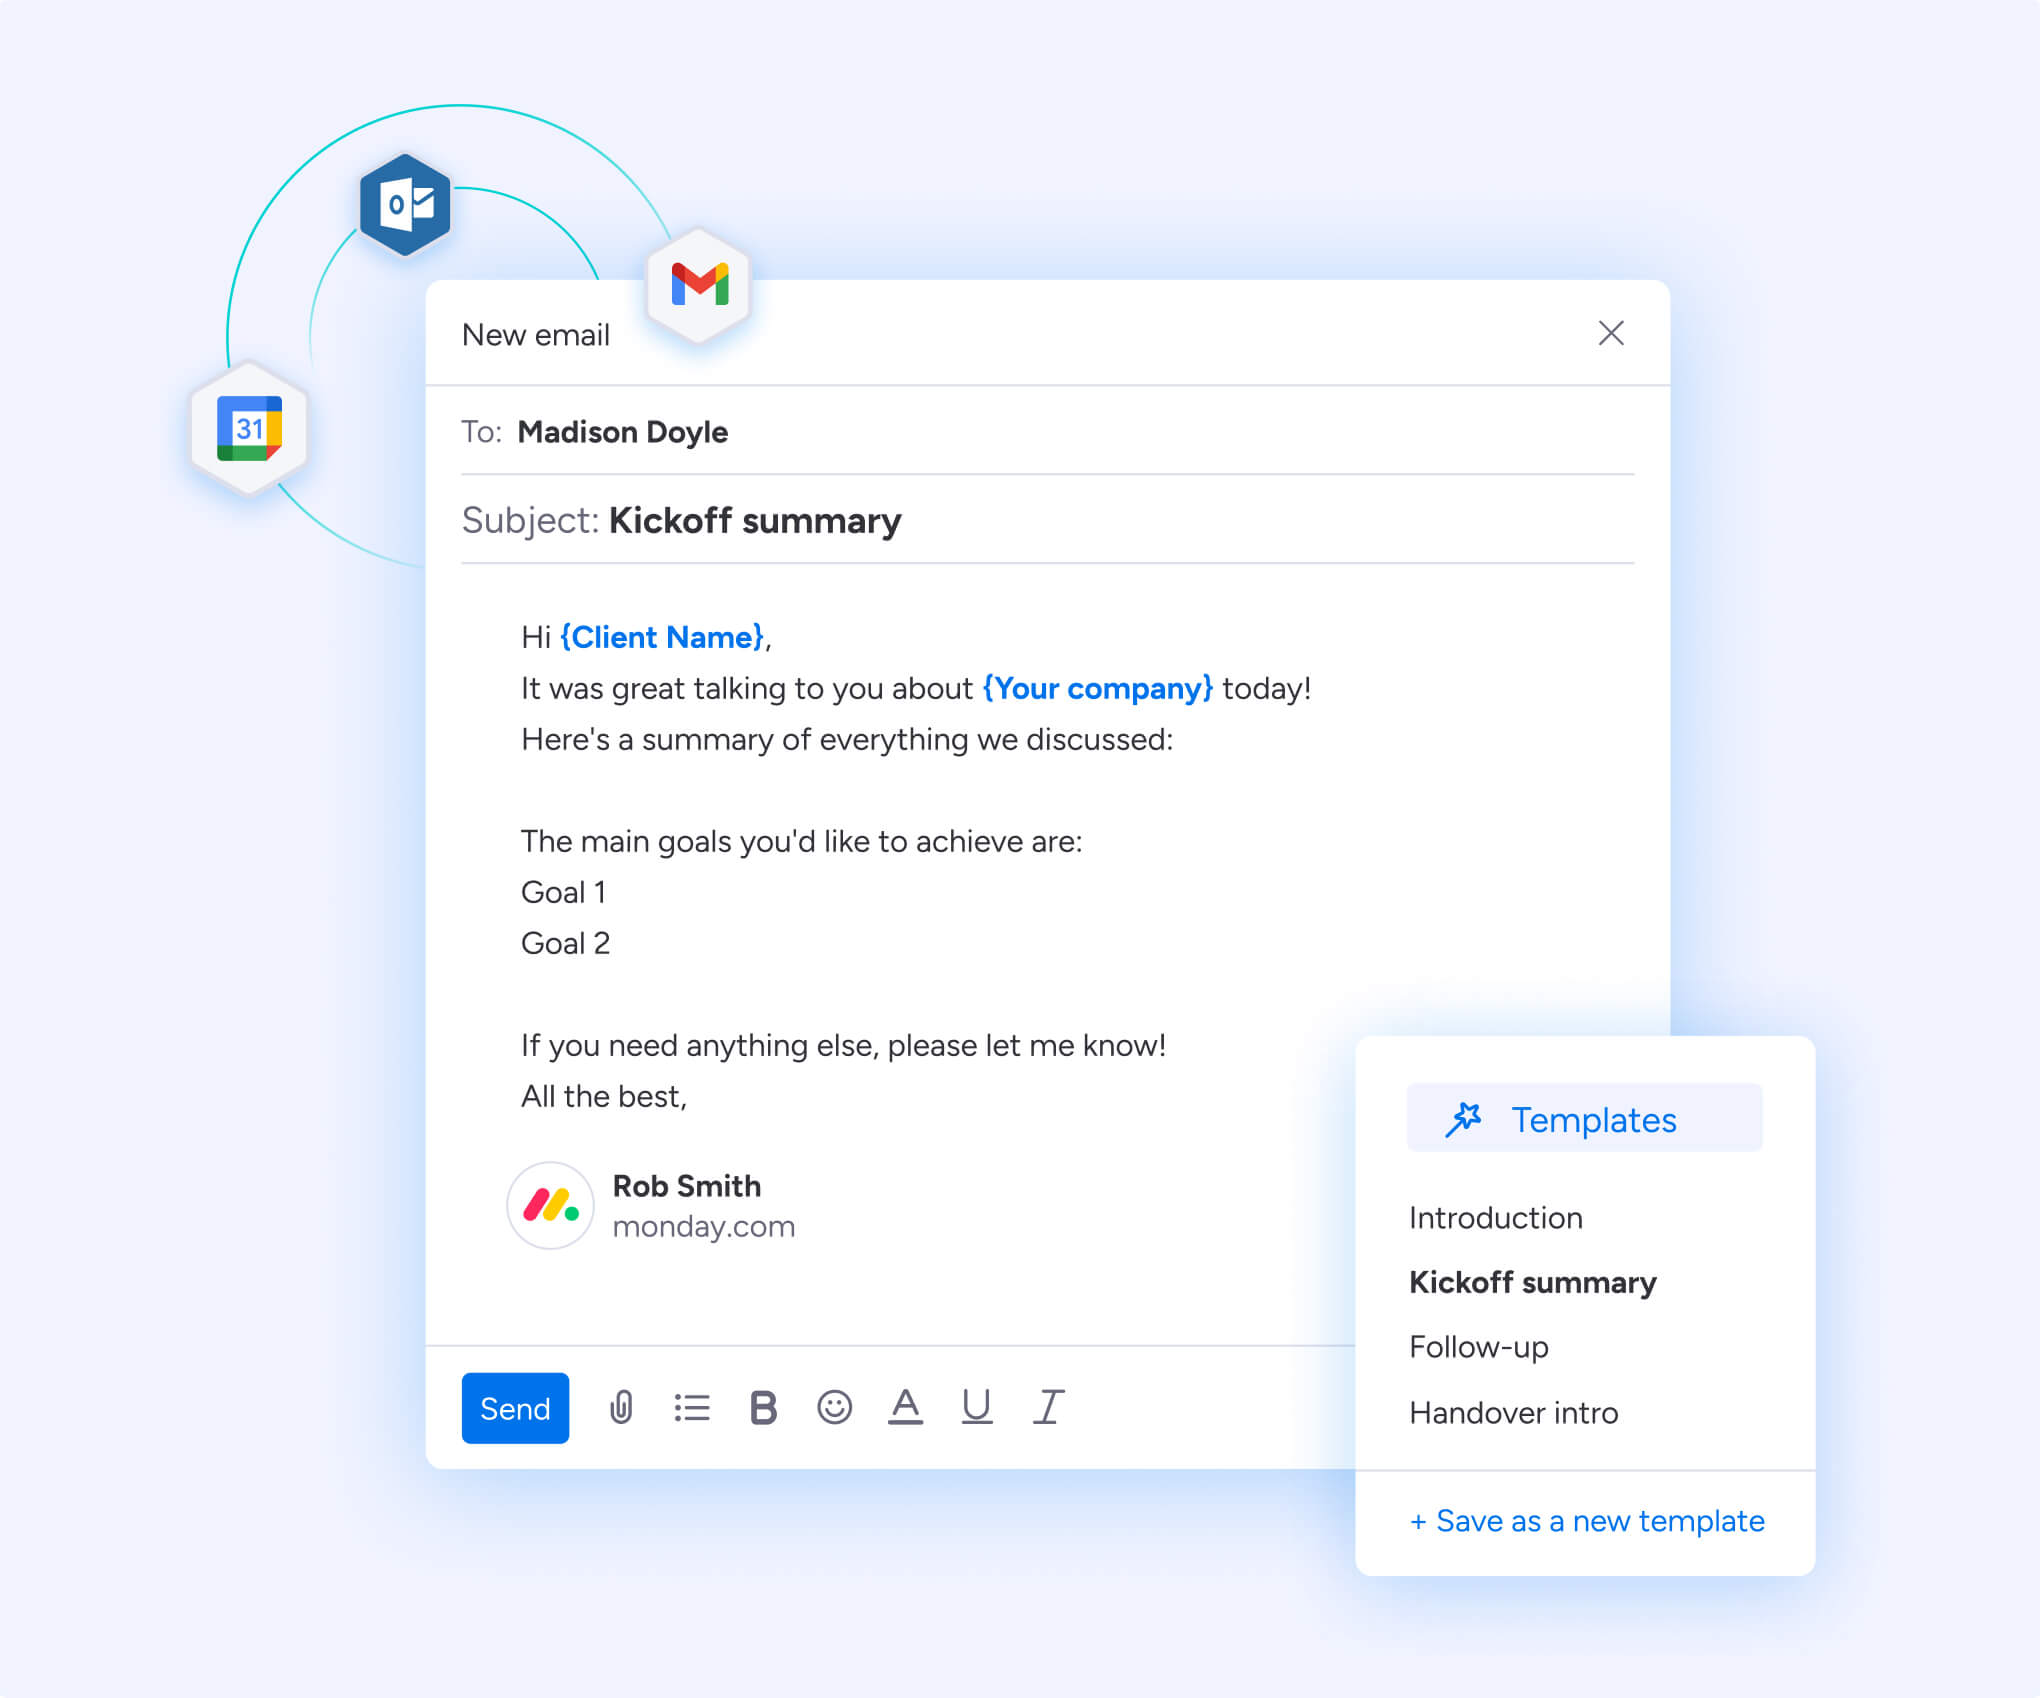
- Intelligent recommendations: AI suggests next actions based on successful patterns from similar situations. The system might recommend optimal follow-up timing, which stakeholders to engage, or accounts ready for expansion based on usage patterns. The platform’s AI email composition integrates with dashboard metrics suggesting personalized outreach based on prospect behavior.
Dashboard success best practices
Effective dashboards deliver actionable insights that drive measurable business outcomes. Following these proven practices ensures your dashboards achieve both user adoption and tangible value. These guidelines help teams avoid common pitfalls while maximizing dashboard ROI.
- Start with user needs: by designing for specific roles rather than creating one view serving everyone. Sales reps need different metrics than managers, executives require different detail than operations teams.
- Limit metrics per view: to prevent paralysis. Every metric should answer a specific question or support particular actions. If users can’t explain why a metric matters, remove it.
- Ensure data accuracy: through quality processes and regular audits. One incorrect data instance destroys credibility causing users to revert to manual reporting. Implement validation rules and assign ownership for maintenance.
- Design for mobile access: since sales professionals spend significant time away from desks. Mobile-friendly designs use larger touch targets and prioritize critical metrics for quick reference.
- Provide context: including benchmarks, targets, and historical comparisons helping users interpret performance. Metrics without context are just numbers, showing current win rate below target or above last quarter makes data actionable.
- Enable drill-down capabilities: allowing exploration at different detail levels. Managers should navigate from regional metrics to individual performance to specific deals. This layered approach provides both overview and detail.
- Regular optimization: through quarterly assessments evaluates whether metrics align with priorities and users find value. Business needs evolve and dashboards should adapt accordingly.
Change your sales visibility with monday CRM
With comprehensive dashboard capabilities that address visibility and predictability challenges, monday CRM helps sales organizations transform their data into actionable insights. The platform combines intuitive design with powerful customization creating dashboards teams actually use.
The drag-and-drop dashboard builder enables sophisticated visualizations without technical expertise. Pre-built templates for pipeline management, forecasting, and team performance provide starting points teams customize for their workflows.
Dynamic widgets for precise data visualization
Customizable widgets allow you to display data exactly as needed. Specifically, you can leverage:
- Pipeline widgets: visualize deal progression with custom columns for value and close dates.
- Leaderboard widgets: rank team members on revenue or activities.
- Conditional labels: automatically highlight deals requiring attention when metrics cross thresholds.
Built-in AI for enhanced sales intelligence
Native AI features enhance dashboard intelligence without the need for separate platforms. For example, the timeline summary AI analyzes deal history to generate comprehensive updates instantly. Additionally, automated data enrichment populates records with company information, ensuring your metrics always reflect complete and accurate data.
Centralized management to eliminate data silos
Centralized management ensures all phases of the customer lifecycle are connected in one place. As a result, you can track every stage effectively:
- Lead Management: monitor prospects from initial contact through qualification.
- Deal Management: visualize pipeline stages with customizable probability fields.
- Post-Sales Tracking: monitor renewals and expansion opportunities to prevent churn.
Native integrations connect your email, marketing automation, and support systems. This connectivity creates a single source of truth, ensuring your dashboards reflect comprehensive data rather than partial views that miss critical context.
The content in this article is provided for informational purposes only and, to the best of monday.com’s knowledge, the information provided in this article is accurate and up-to-date at the time of publication. That said, monday.com encourages readers to verify all information directly.
Frequently asked questions
How long does it take to set up CRM dashboards?
The time it takes to set up CRM dashboards varies from hours for basic templates to weeks for complex custom implementations. No-code platforms reduce setup to minutes for standard dashboard types through pre-built templates and drag-and-drop customization.
Can CRM dashboards connect to multiple data sources?
Yes, CRM dashboards integrate data from email platforms, marketing automation, support systems, and external databases. Integration capabilities depend on your platform's API connections, with leading solutions offering extensive native integrations.
What's the difference between CRM dashboards and reports?
CRM dashboards provide real-time visual displays for ongoing monitoring, while reports offer detailed static analysis generated on-demand. Dashboards prioritize immediate visibility while reports focus on comprehensive historical analysis.
How often should dashboard data refresh?
Dashboard data should refresh in real-time or every 15-30 minutes for critical metrics. Refresh frequency depends on data volume, system capabilities, and business requirements, with activity metrics updating more frequently than monthly summaries.
Do you need coding skills to create dashboards?
While traditional dashboard creation required technical skills, solutions like monday CRM offer a drag-and-drop builder that eliminates coding requirements. Our no-code solution allows sales teams to create and customize dashboards independently, without IT involvement.
Can different teams customize their own views?
Most CRM platforms allow role-based dashboard customization, enabling sales reps, managers, and executives to create personalized views. This ensures each team member sees relevant metrics without irrelevant information cluttering their view.